

The Key to Identifying Trend Reversals: Double Bottom and Double Top (Excerpt from a Paid Product)
Today I would like to talk about entries aiming for trend reversal using the classic reversal chart patterns of a double bottom and double top.
The double bottom and double top are among the “textbook entries” that you would first learn when you start FX, but in practice it is quite difficult to reliably find and use them correctly.
First of all, the so-called“bottom-to-top entry”is, in FX methods, one of the more difficult categories.
The rough flow of a trend reversal is
1. Formation of the trend
2. End of the trend (entering a range)
3. Appearance of the opposite trend (trend reversal)
which is not always strictly the case,
3'.Continuation of the same trend again
is also a pattern.
In other words, if you fail to identify a trend reversal correctly,
・you may enter too early while still in the range
・you may end up being swept into a continuing trend
Therefore, you must carefully select entry timing and confirm that you have broken out of the adjustment range after the trend has formed.
Hence, a trend-reversal-oriented bottom-to-top entry using double bottoms or double tops requires especially careful narrowing of entry opportunities.
Compared to this, following a trend after a clear move like a pullback buy or a pullback sell is relatively easier; even if you miss the exact entry moment a bit, you can often win thanks to the big trend wave.
Therefore, in the extreme, there is also the option to“not aiming for difficult trend reversals and just following the trend”, but that alone would limit entry opportunities.
Moreover, there are many opportunities to target trend reversals using double bottoms or double tops on a day-trading scale, so it would be a waste to miss these chances.
However, because double bottoms and double tops can appear in many places, it is easy to lose track of which ones are reliable.
Therefore, I would like to discuss in detail how to find reliable double bottoms and double tops and how to use them for trend-reversal entries.
How to discern the major starting points of big trend reversals in double bottoms and double tops: wait for the opponent to run out of ammunition
Why do double bottoms or double tops function as starting points for trend reversals in the first place, or why do they sometimes fail?
To know how to discern this, you need to understand more about thefundamental process of how genuine double bottoms and double tops form.
A double bottom or double top isto wait for the opponent’s ammunition to run outto be effectively used.
We tend to focus only on our own trading plan, but we must always be aware that there are people thinking in the opposite buy/sell directions.
This means entering as the opponent, who holds a position opposite to our intended entry, runs out of ammunition and escapes.
For example, consider using a double bottom for a pullback buy in a long-term uptrend.
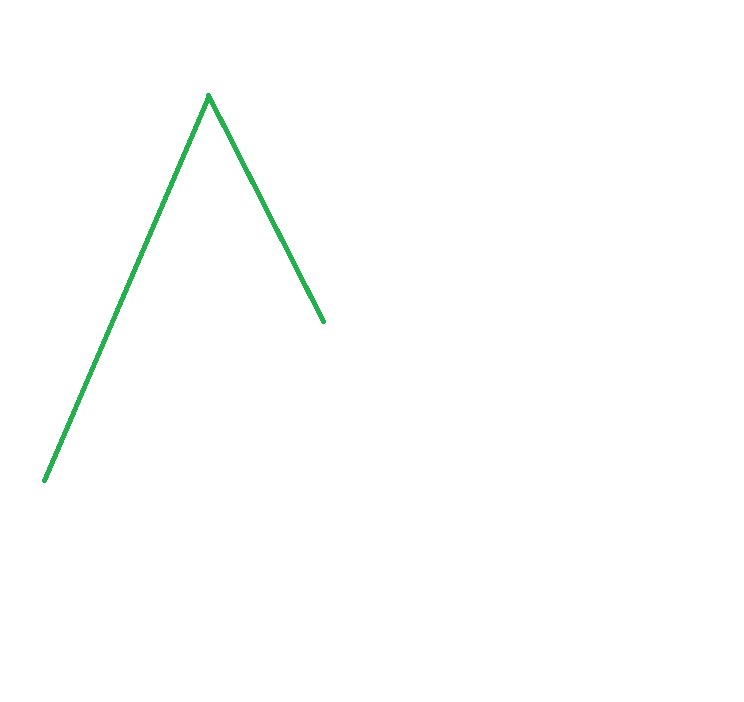
In this way, after an uptrend, if a temporary decline occurs, the pullback-buy scenario is natural to consider, but at the same time some people think about“a return sell against the temporary downtrend”.
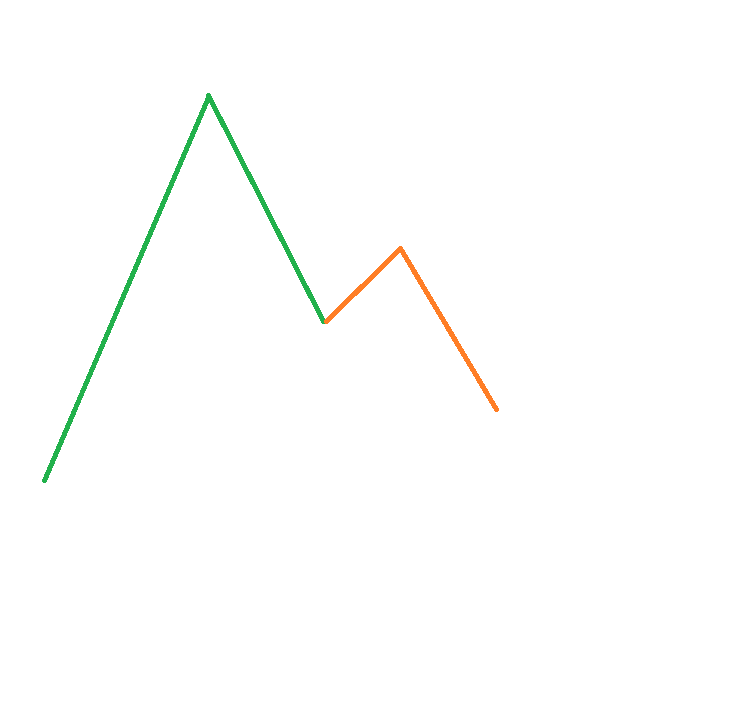
In other words, when the pullback-buy and the return-sell sides start to battle and the price enters a range, if you enter before a decisive outcome is reached, you are more likely to lose.
And for the return-sell side, there must be some basis for wanting to sell after the price has been pulled back to a certain level.
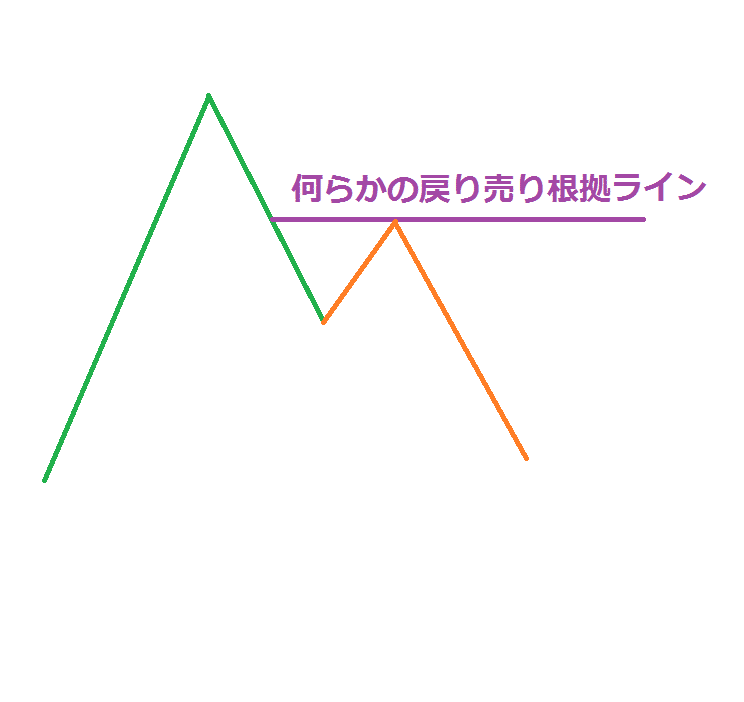
Or perhaps they are basing it on moving averages or some other curve as a basis.
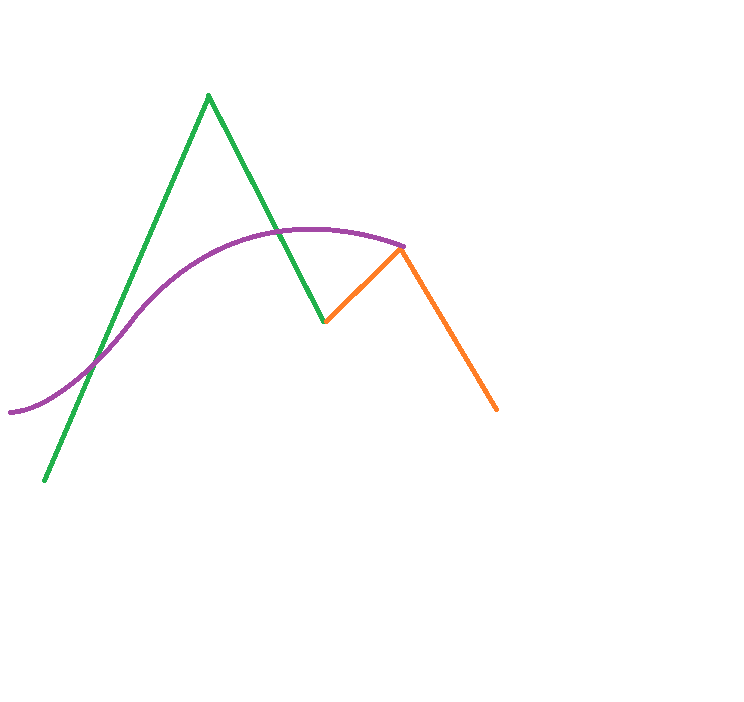
And if the price pulls back as anticipated and then sells again, what will the return-sell side think?
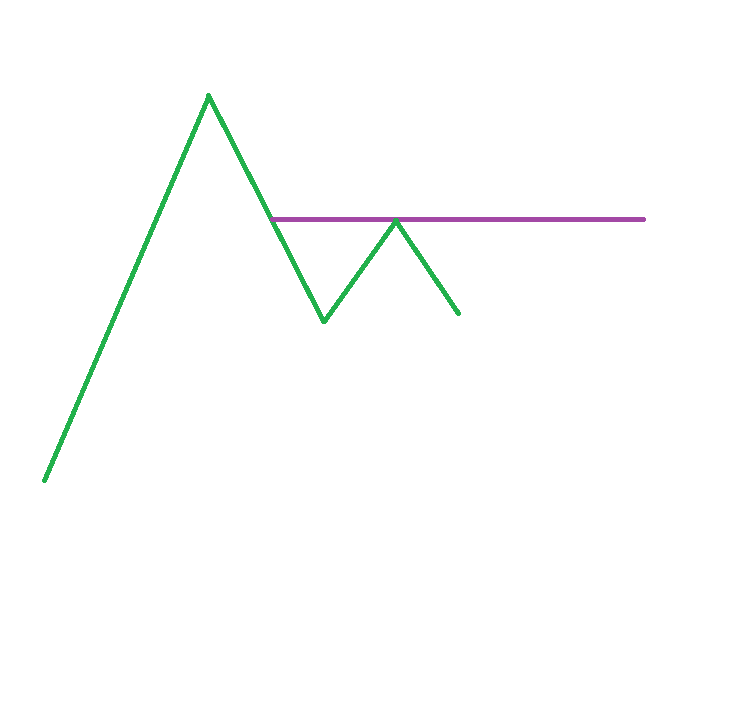
「I pulled back this far and entered with confidence, so if this fails, I’ll just cut and run quickly!」
I think many will flee at once. This causes small gains to take profits, break-even orders to cluster, and even stop-loss buys to rise.
This is“waiting for the opponent’s ammunition to run out”and is the essential thinking behind double tops and double bottoms.
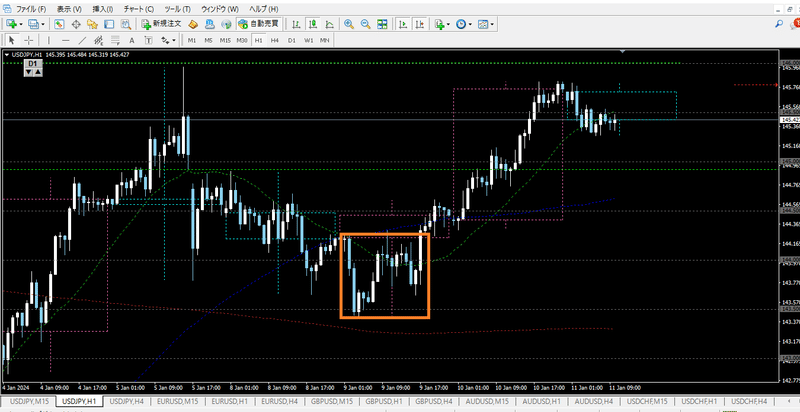
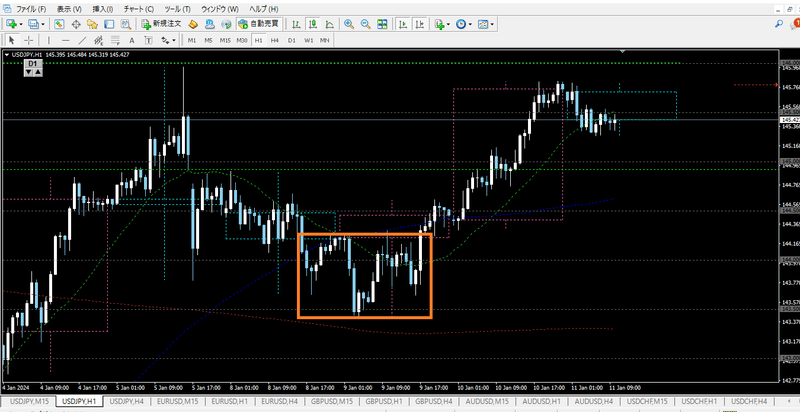
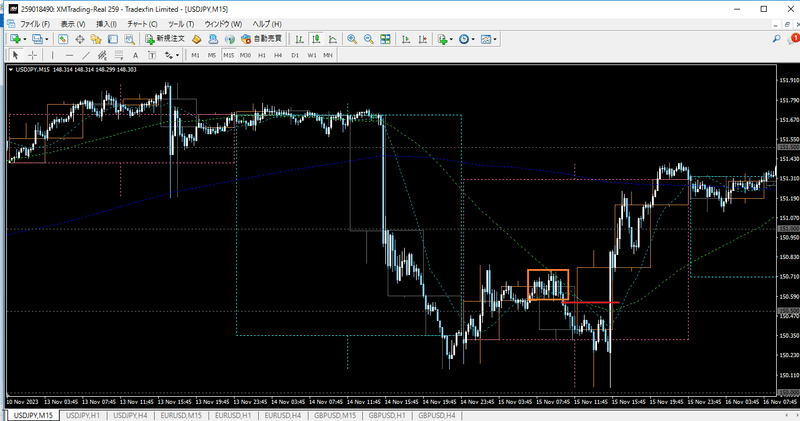
Let me show you a practical example. Please look at the next USD/JPY 15-minute chart.
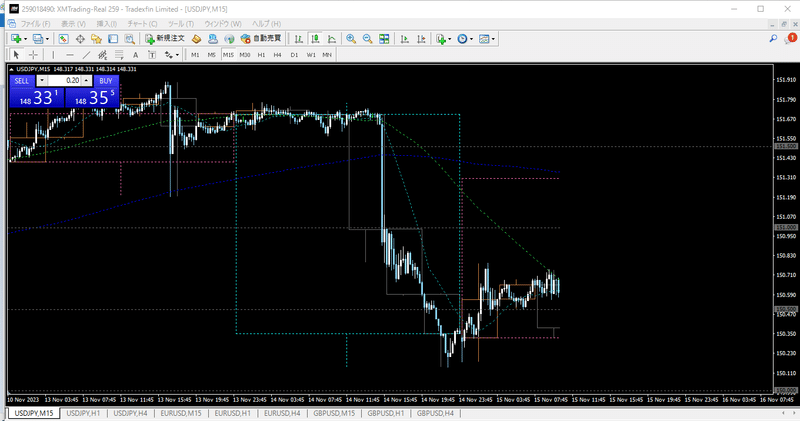
It is a scenario where we want to target a return-sell against a downtrend on the left, but
・the functioning 1-hour SMA21
・the 31.8% Fibonacci level
overlap as multiple pullback candidates, creating a high of lower highs and a small head-and-shoulders move, which clearly suggests considering a return-sell scenario.
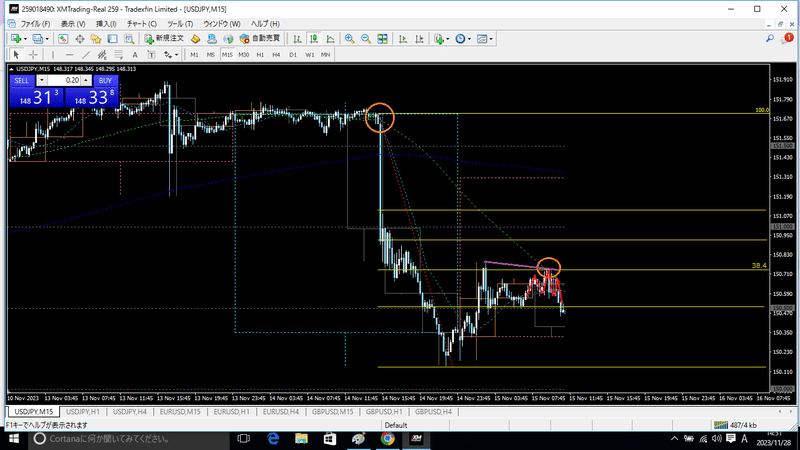
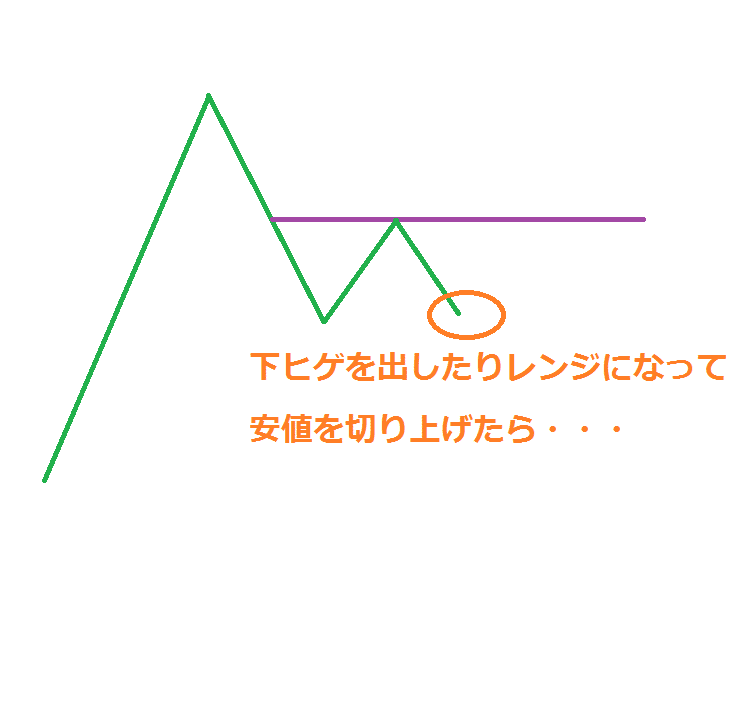
However, in reality it then fell somewhat and later formed a long lower wick and turned upward.
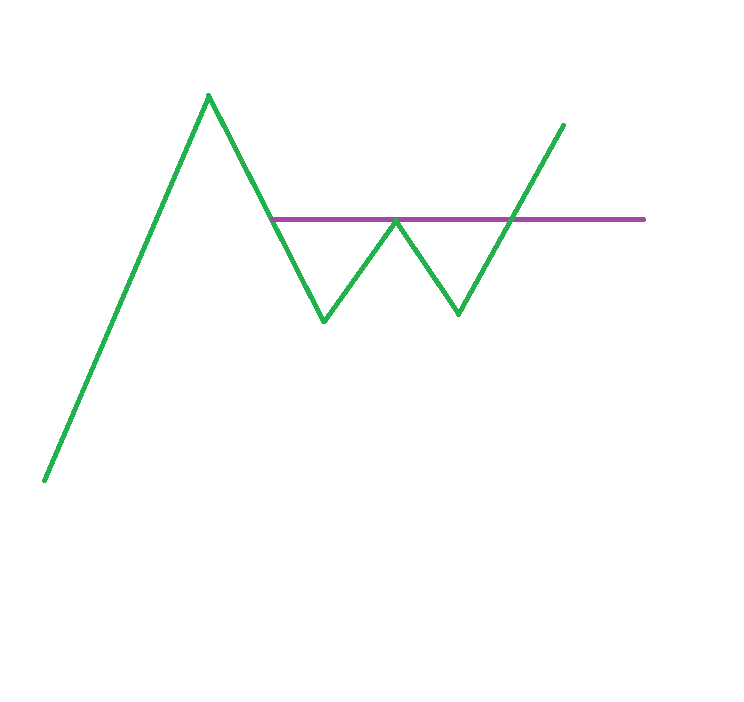
Well, this movement is influenced by economic indicators, so a sudden reversal is not common, but because the return-sell setup had multiple supporting factors, when it moved against the trend, buyers’ ammunition ran out and it reversed upward, culminating in a completed double bottom.
This is the essential way to identify trend reversals using double bottoms and double tops.
In other words, forming a genuine starting point for a trend reversal with a double bottom or double top takes time, and the reason is“it takes a certain amount of time for the opponent to run out of ammunition”.
How to find reliable double bottoms and double tops
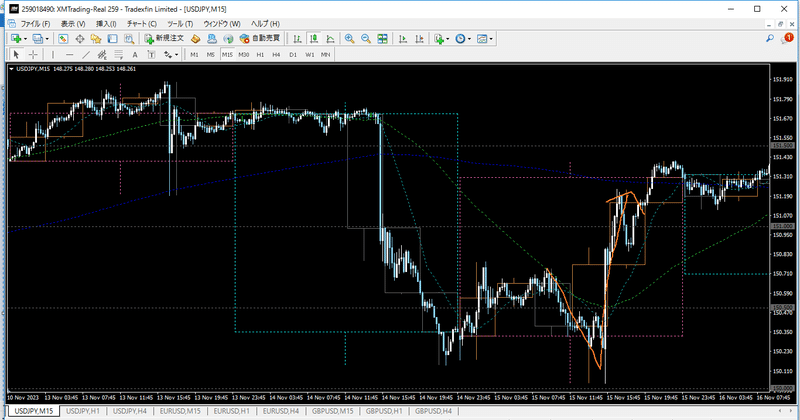
Double bottoms and double tops do not often appear in the market in the “textbook shapes.”
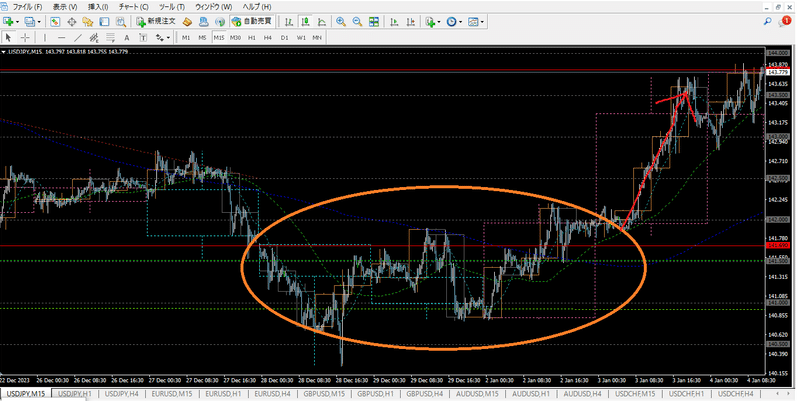
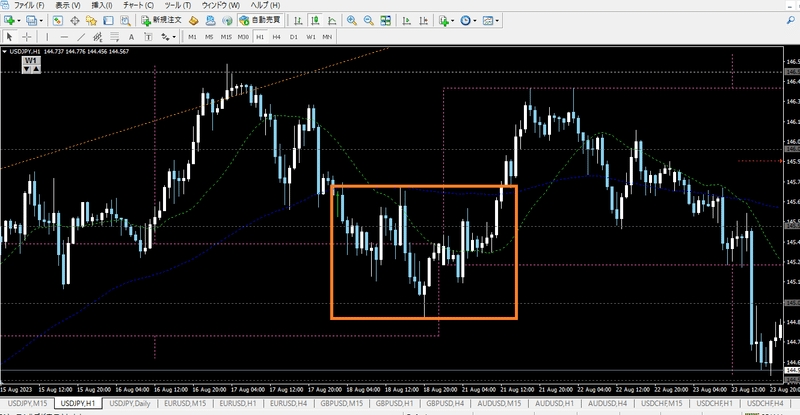
This is a USD/JPY 15-minute chart, and within this chart you can see many shapes that look like a double bottom or double top.
Some of them fail and are unreliable, but for now“successful cases”we will examine only those.
First of all, an important thing to note is that reversal chart patterns like double bottoms and double tops are about scale.In a four-hour chart there is a four-hour-level double bottom, in an hourly chart there is an hourly-level double bottom, and in a five-minute chart there is a five-minute-level double bottom.
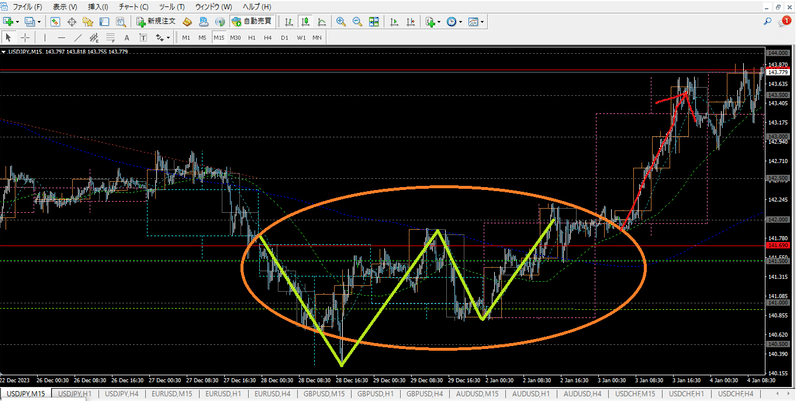
To begin with, one example can be found at the following point in the chart.
From this double bottom formation, about 50 pips rose.
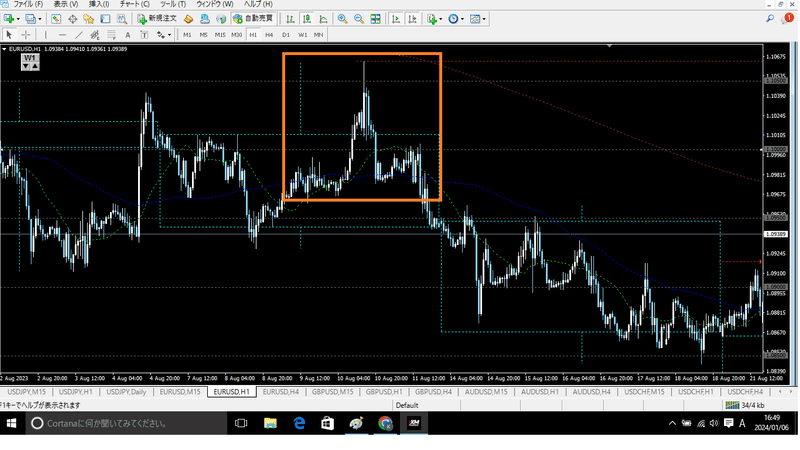
Actually, you can see that within this chart there is also a larger-scale double bottom appearing, right?
In this way, a still larger-scale double bottom containing the earlier smaller double bottom formed at the same time, and from this double bottom, about 200 pips rose.
Probably, people who do not understand how to read double bottoms or double tops would feel uncomfortable calling this a double bottom.
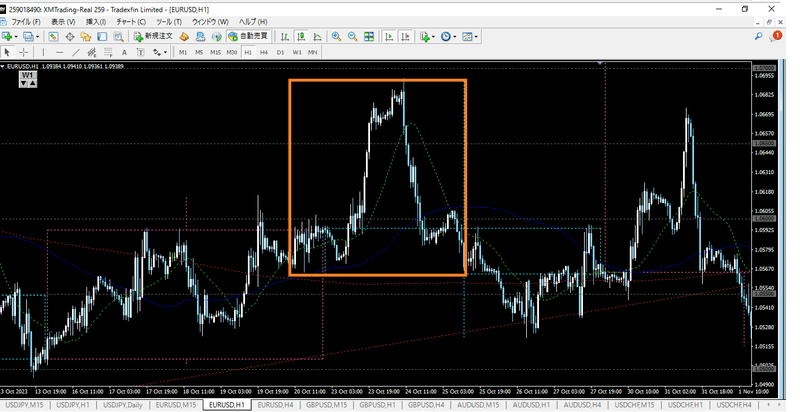
This double bottom is hard to see on a 15-minute chart, but it becomes clearer when viewed on a larger time frame such as the hourly chart.
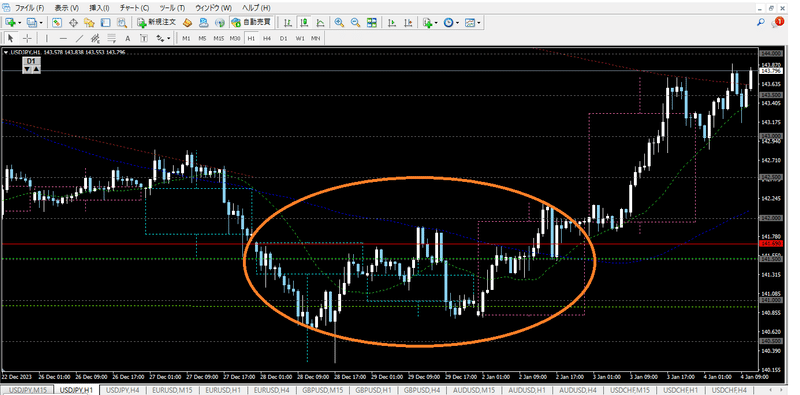
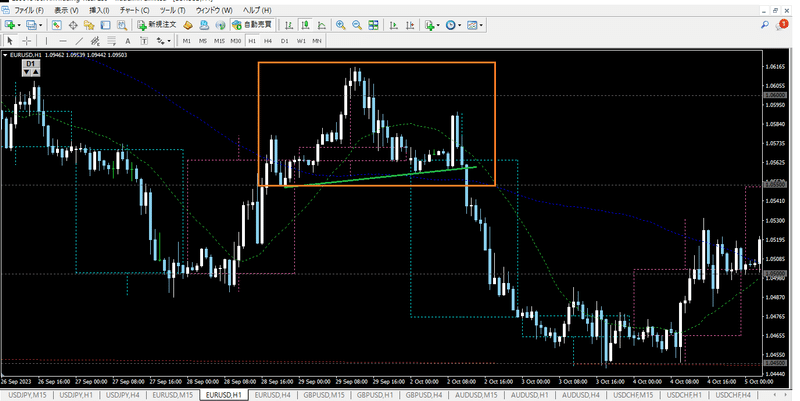
If even the hourly chart’s double bottom doesn’t click for you, looking at the higher 4-hour chart becomes even easier to understand.
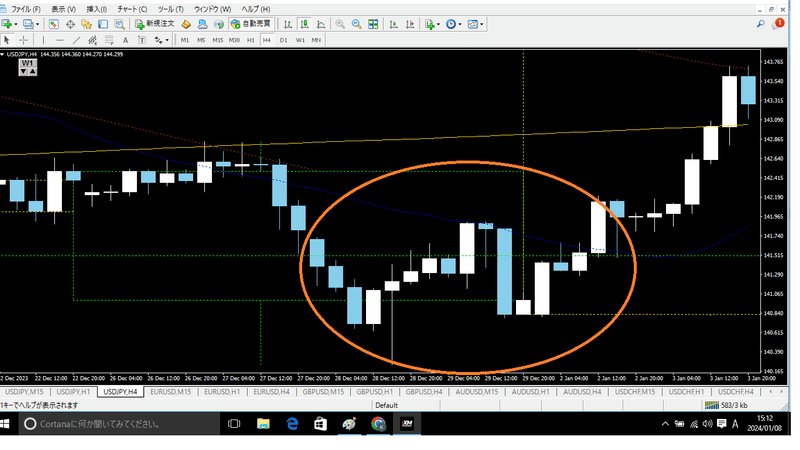
At this point, you can fairly image the textbook-like shape of a double bottom.
Seeing more detailed price action on lower timeframes can be a double-edged sword; if you focus only on 5- or 15-minute charts, you may get caught up in the near-term fluctuations and lose sight of the bigger trend, which is a common pitfall for FX beginners.
Thus, instead of chasing the precise moves on lower timeframes, you can deliberately lower the chart’s “resolution” to more reliably locate double bottoms and double tops.
When looking for larger-scale double bottoms and double tops, it is good to
“look for cases where the left and right peaks or valleys are roughly the same size.”
In the above double bottom, the left valley formation takes about a day and a half, and the right valley formation about a day, making their scale roughly similar.
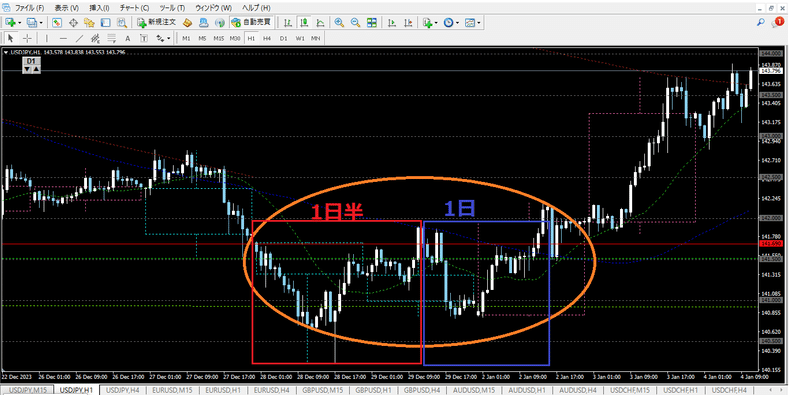
In fact, for double bottoms and double tops, matching the scale of the left and right sides is more important than the exact shape of the pattern itself.
Moreover, larger-scale patterns look distorted and less reliable if you chase too much micro-movement, so it is better to drop the resolution to at least the hourly chart.Conversely, entries based on double bottoms or double tops that can only be seen on 15-minute or 5-minute charts are not very trustworthy.
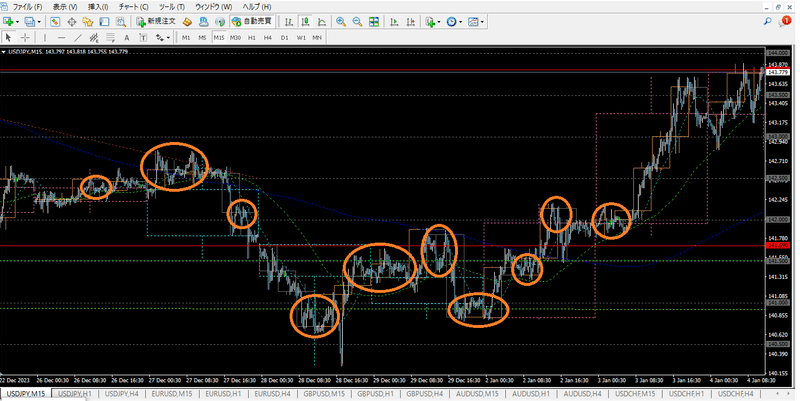
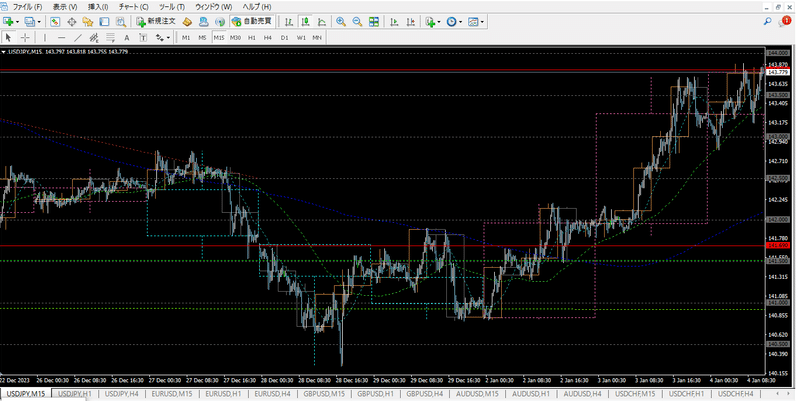
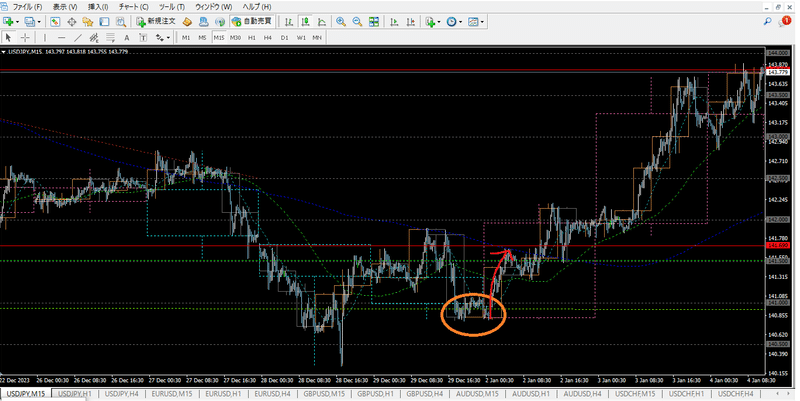
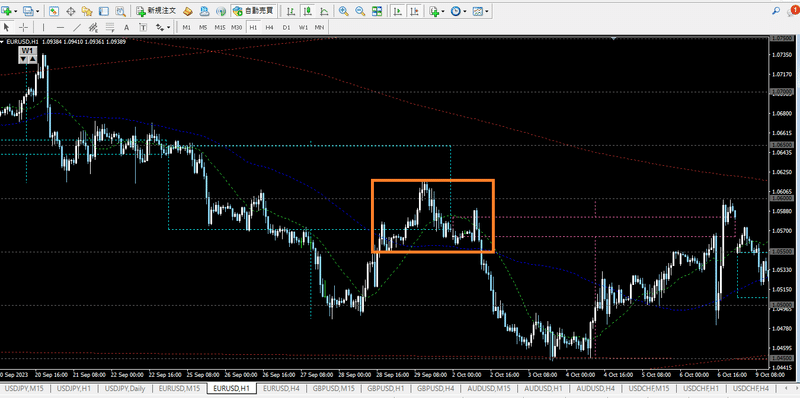
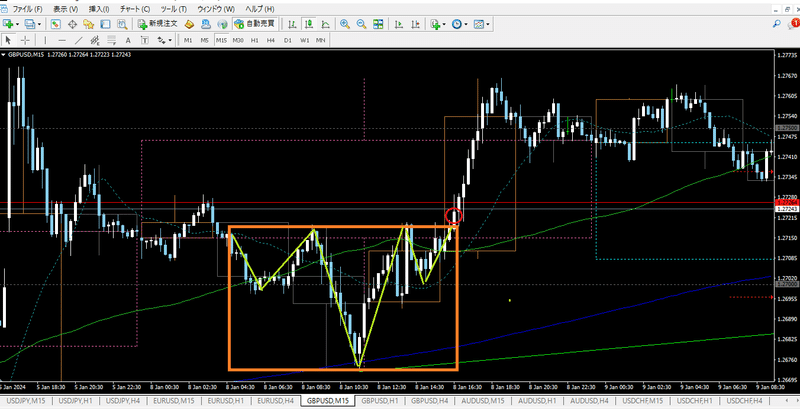
You can see double bottoms or double tops in many places if you look for them.
Smaller-scale double bottoms and double tops tend to present more “clear textbook shapes.”This also means they are more likely to appear clearly as teachable examples.
However, even if you had entered all the circled areas, you would often end up with a mix of wins and losses, and overall not much profit.
Some patterns extend quite effectively, but unless you identify exactly the right point, you cannot use them effectively; waiting for larger-scale patterns to appear is often easier.
Winning and losing trades are mentally exhausting, and in trading where mental stability is crucial, that mental fatigue can lead to reckless trading aimed at “recovering losses.”“to recover losses”.
To avoid this, waiting for a larger time frame to form a double bottom or double top and then narrowing entries to the crucial moment is less mentally exhausting and makes it easier to secure large profits with less effort.
In fact, with a single entry at the hourly double bottom level, you can be comfortably ahead compared to entering all the finer double tops and double bottoms on lower time frames.

Personally, my trading style aims for about 30–50 pips per day in day trading, but for trend-reversal trading of that scale, it is best to look for double bottoms and double tops that can be confirmed at least at the hourly chart level.
Completion of double bottoms and double tops and timing differences in trend reversals
When basing on the scale of double bottoms and double tops that can be confirmed at the hourly level,
・The larger the shape, the higher the potential for a larger reversal
・The larger the shape, the more time it takes for a genuine trend reversal to occur
Keep that in mind.
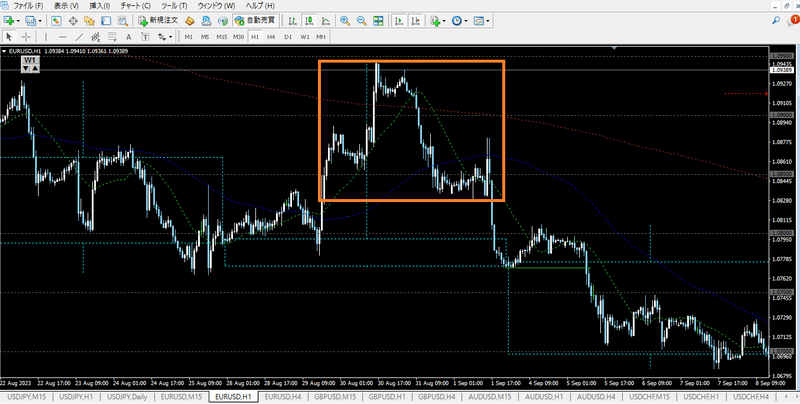
For example, in the chart mentioned earlier, the small double bottom at the 15-minute level rose relatively quickly, but that rise did not constitute a genuine trend reversal.
By contrast, the larger-scale double bottom completed through a neck-line body break began a genuine rise after about a day from its completion.A rise that spans days.

Correctly
・The larger the shape, the higher the potential for a large rise
・The larger the shape, the longer it takes for a genuine trend reversal to occur
these facts are clearly reflected in the chart.
In fact, double bottoms and double tops at the hourly scale are often a matter of timing: the moment the pattern is completed and when it truly changes into a new trend can be offset in time.
In many cases, timing shifts when the pattern completes and when it becomes a real trend reversal occur.
As such, when the neck line breaks, entering immediately can be too early and may result in a premature “touch entry” accident; caution is required.
However, this also meansyou do not need to rush into entries just because a double bottom or double top is completed on the hourly chart; a brief pause before entering is often sufficient.
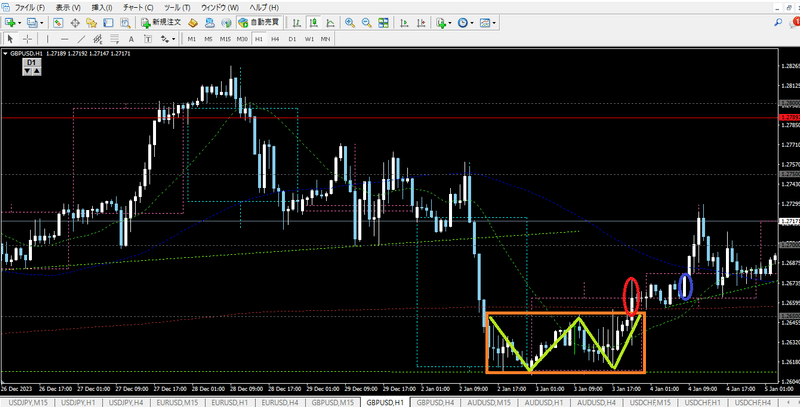
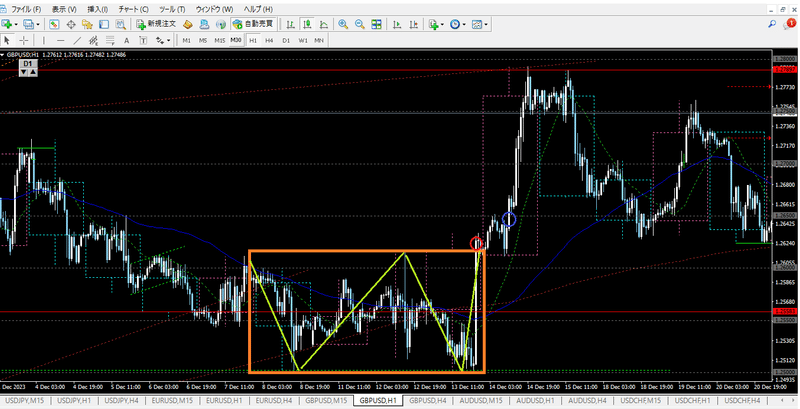
About the Head and Shoulders pattern
This is a brief aside: like double bottoms and double tops, there is also the Head and Shoulders pattern that targets trend reversals.
The Head and Shoulders pattern can be a more powerful trend reversal signal than double bottoms or double tops.
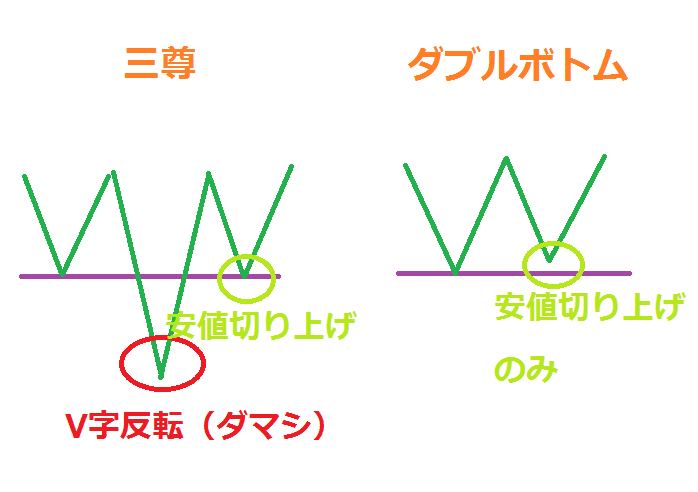
From the principle of its formation,
・V-shape reversal (false break)
・Lower lows or higher highs
The Head and Shoulders pattern has stronger justification as a reversal signal.
Moreover, the Head and Shoulders often encompasses double bottoms or double tops.
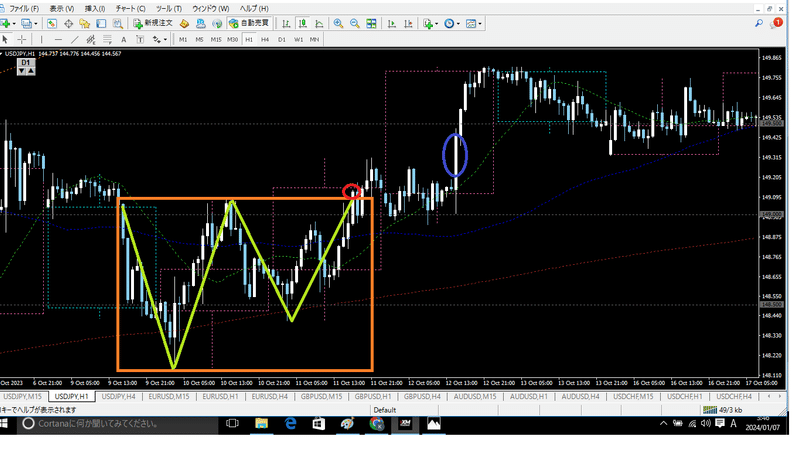
This is a double bottom that appeared on the USD/JPY hourly chart, which can also be seen as a Head and Shoulders shape if you view a bit more of the left side.
Regardless of interpretation, the number of observations supporting trend reversal only increases, making it more credible.
From these facts, the Head and Shoulders can be regarded as a superior version of double bottoms and double tops.たHeads and Shoulders—the pure upgrade of double bottoms and tops.
When an hourly chart-wide Head and Shoulders appears, you can trade on it alone for that day with confidence.
Alternatively, if it appears on lower timeframes such as the 15-minute chart, you can still use it as a signal for pullback buys or pullback sells on lower timeframes.
It is a versatile tool usable on higher or lower timeframes, with relatively few false moves, and even patterns that are slightly off-angle can still be used normally.
In shortthe Head and Shoulders itself is a highly reliable signal, so there are not many particular points to be cautious about.
However, it does not occur extremely often, so it is realistic to treat its appearance as lucky.
Compared with Head and Shoulders, double bottoms and double tops occur more frequently, so for daily trend-reversal entry opportunities it is more efficient to focus on how to discern double bottoms and double tops rather than over-analyzing Head and Shoulders.
Thus, we do not discuss Head and Shoulders in much depth here.
Still, since Head and Shoulders is essentially a superior version of double bottoms and double tops, the methods discussed here can be applied to Head and Shoulders as well.
Additionally, patterns like the Triple Bottom or Triple Top can also be viewed as higher-order counterparts to double bottoms and double tops.
The importance of aligning higher and lower timeframe perspectives: two-stage authentication
Large-scale double bottoms and double tops have a timing discrepancy between completion and actual trend reversal, which can be extended by applying it to look for higher-probability entry signals using lower timeframes.In other words, there is room to search for more advantageous entry signals by watching the price action on the lower timeframes.