
USD/JPY long signal currently active
It is a 1-hour chart
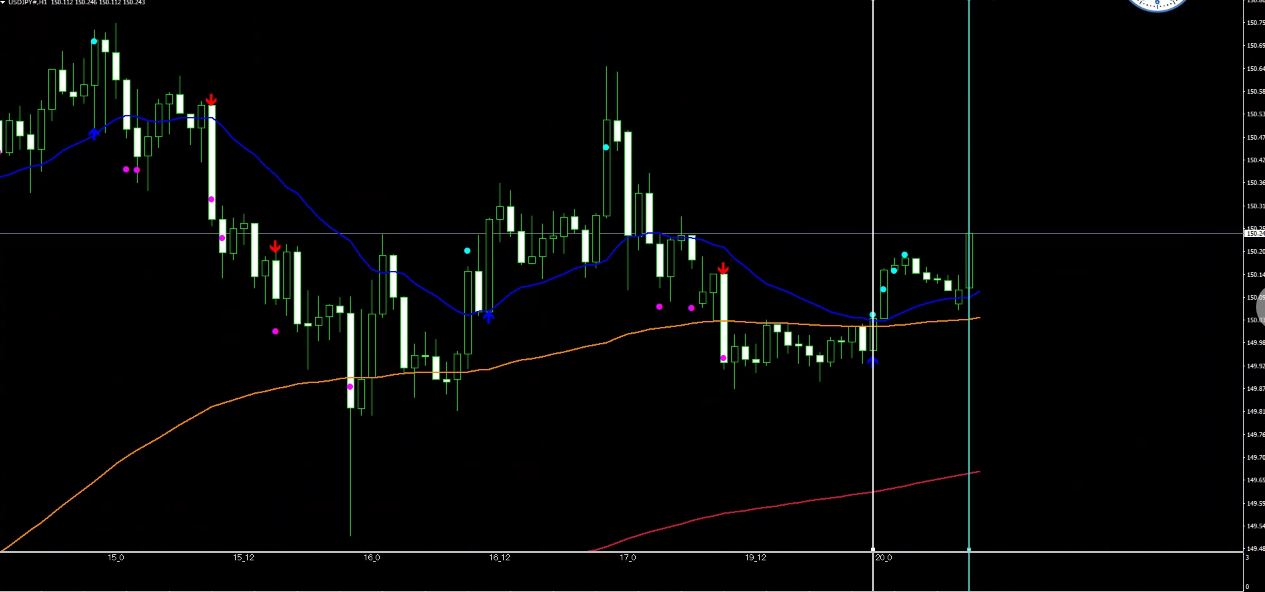
An entry condition has formed with white vertical lines and we are currently in a floating profit state.
Here, as a review, if you miss this 1-hour signal or impulsively go long, it would be better to look at the 5-minute or 15-minute chart.
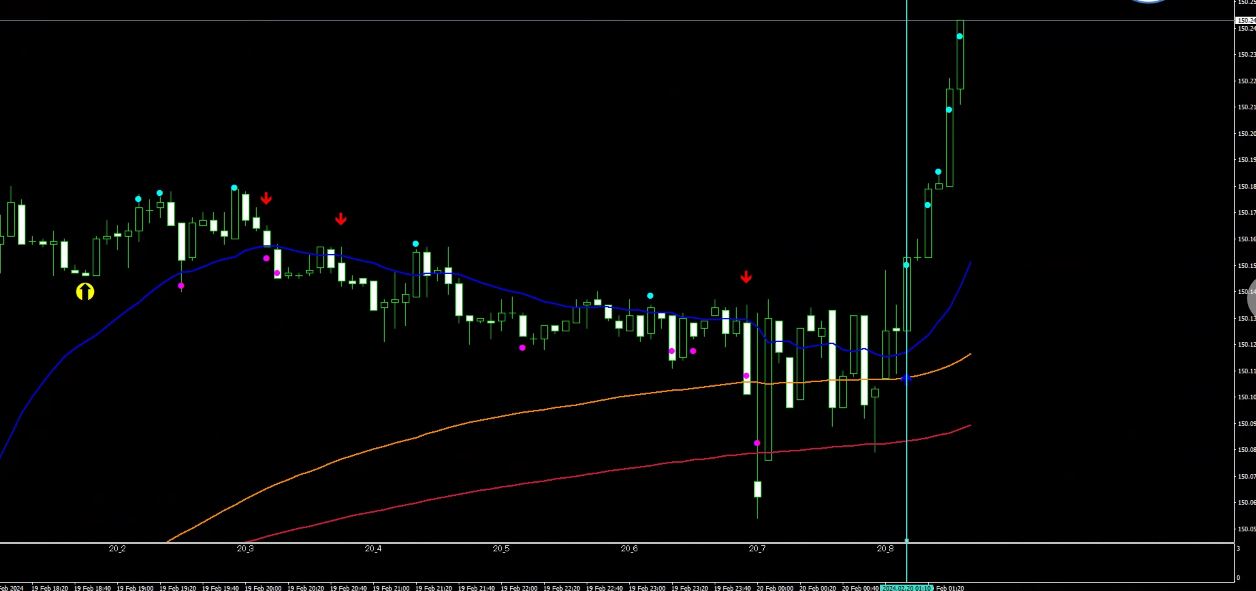
Yes, this is the 5-minute chart.
A long entry has formed with a light blue vertical line, and it is in a rising phase afterward.
The 1-hour signal changes to a new day on 2/20, so most people are probably asleep in the middle of the night.
I was also fast asleep.
By looking at the 5-minute chart, you can pick up opportunities during actual trading times, so the burden is lighter.
And once again, please look at the 1-hour chart: the point where the right light blue vertical line marks is exactly where the 5-minute blue line has formed a leg.
Looking at it this way, you can clearly see the point where the 1-hour chart has advanced and then re-rose.
It's a trend-following tool that works well with higher timeframes.
Other blogs also publish contrarian reversal-taking methods.
Two signals provide a clear entry point; other tips are explained in the manual, so beginners can rest assured!