
Recent USD/JPY chart
Recently I caught a cold and haven’t been feeling well, so I fell behind on updating the blog.
My nose is sensitive, and when I catch a cold I inevitably develop acute sinusitis, which takes time to fully recover.
Every time, the area around my eyes and cheeks hurts and it’s tough, but I’ve finally started to recover.
Now, with that in mind, I’d like to look back on recent USD/JPY movements.
From the 1-hour chart
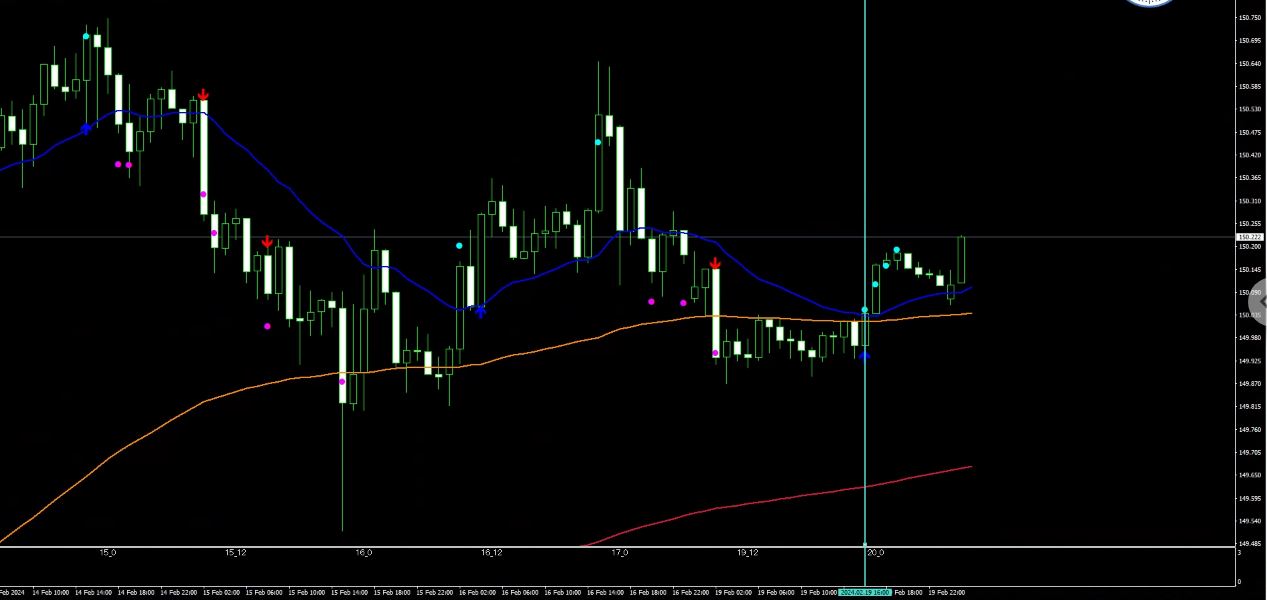
It’s not a pristine uptrend.
With the yellow arrow, the bias is upward, and I’ve drawn a vertical line on the candles where the entry was formed.
The first yellow line indicates a point to be cautious.
This point recently showed a strong upward move (left edge of the image), and there was a possibility of a strong pullback.
And the stop-loss point is quite far, so waiting a bit more for a pullback before going long seems safer.
However, even if you had jumped in long at that moment, you would have won properly (manual take-profit point).
Afterwards I drew three blue vertical lines, and the logic fit perfectly for a comfortable win.
Finally, there is another yellow vertical line, but this is a pass.
This is described in the manual as just a big bullish candle that will retrace, so better to skip!
On the 5-minute chart, since the 1-hour chart shows an up bias, the conventional approach is to target longs on the 5-minute as well, but
of course, against the down moves forming in the 1-hour bear market pullback, you can also capture shorts clearly on the 5-minute.
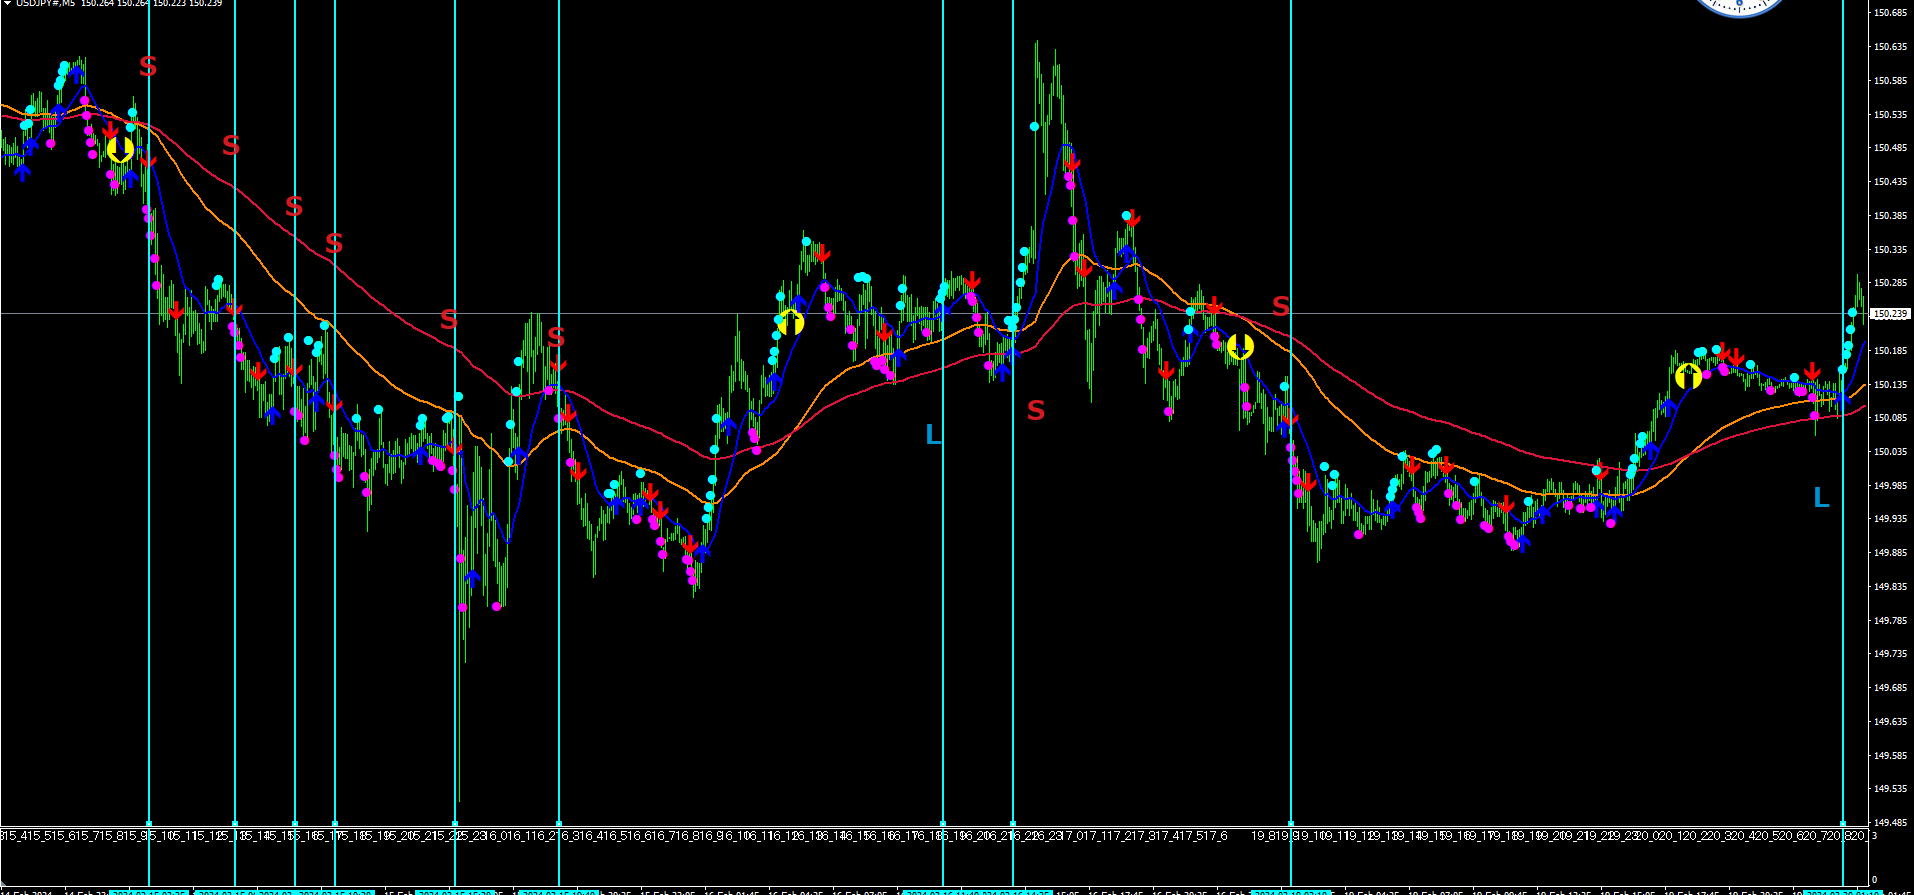
I apologize if this is hard to follow, but I mark the entry point with a vertical line and for shorts I add red text “S,” and for longs I add a blue background with “L.”
Most of these are take-profits, and even in unlucky cases it’s a break-even exit, showing how effective this tool is.
And now we are again at a long-entry point.
That article will come next time