

Translate the following HTML to English, keep the HTML format, do not add markdown code blocks or line breaks, and perform standard decoding before translation: Original: 「見える化インジケータ」の活用(その134) Translation: Utilization of the "Visualization Indicator" (
Usage of the "Visualization Indicator" (its134)
1. Further enhance the "28 Currency Pairs List Indicator" into a visualization indicator
"8CP Visualization Indicator"to plotGBPCHF.
The "8CP Visualization Indicator" hasOceania version,London version,NewYork version,AnyCP version. This time, I used theLondon version.
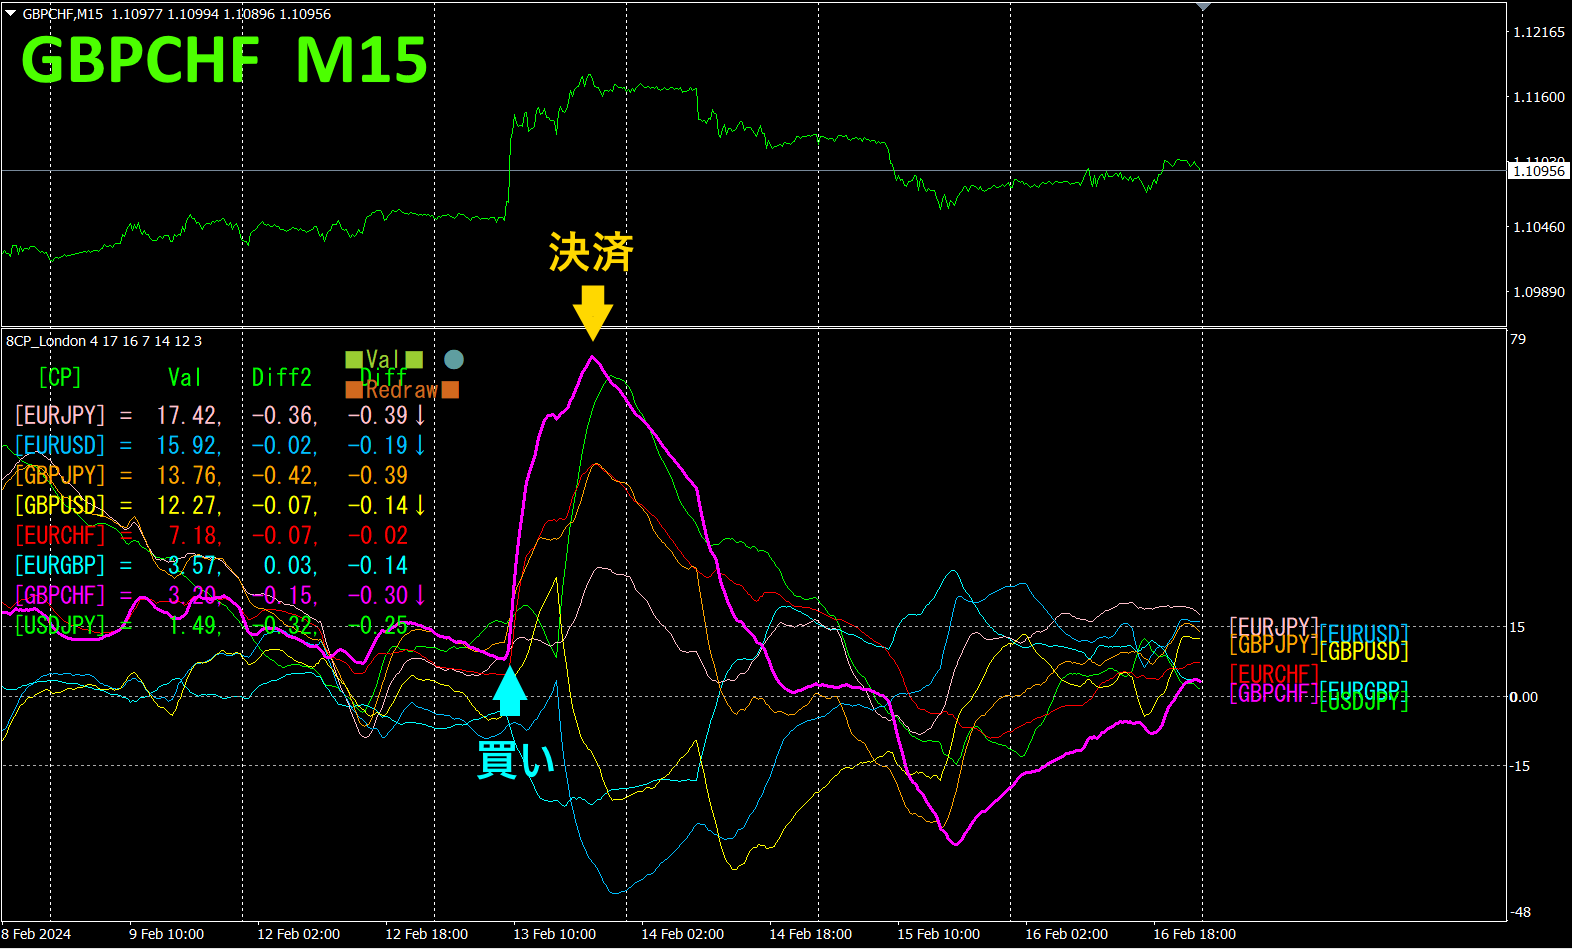
The upper half is theGBPCHF 15-minute chart. The lower half is from the “CP Visualization Indicator,” and the red-purple thick line representsGBPCHF.
On Tuesday,GBPCHF surged above other graphs, creating a large upward deviation, so I entered a buy. It settled for the day with a profit of approximately90pips.Profit was obtained.
With the “8CP Visualization Indicator,” you can focus only on the moves of the currency pair with the greatest movement, enabling efficient trading.
2. Best SelectTry the Indicator
The following figure is a screenshot taken onFebruary,2024,16:42 (JST).
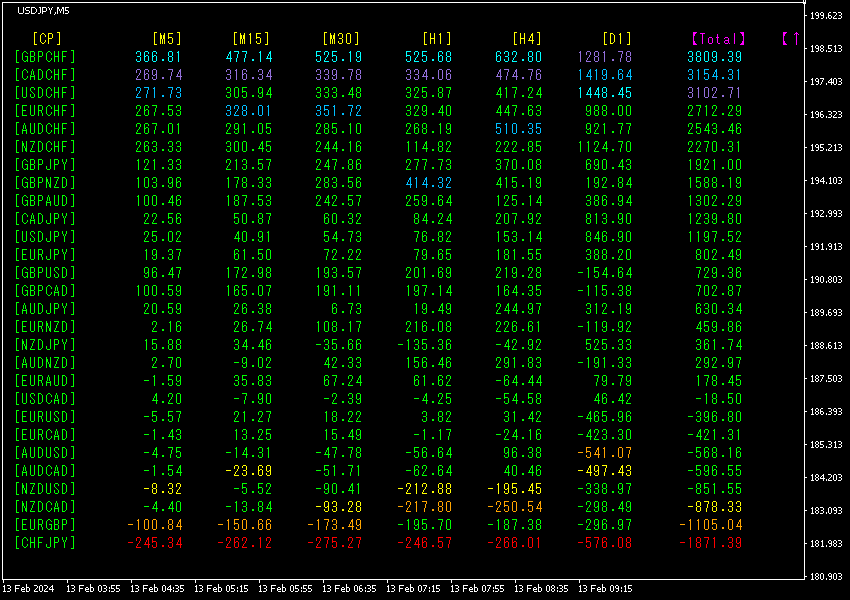
Totalvalues are sorted in descending order. The top row'sGBPCHF shows blue colors across all timeframes, and its value is3809.39, indicating a strong positive value. This shows an uptrend inGBPCHF
Now, let's look at theGBPCHF chart.
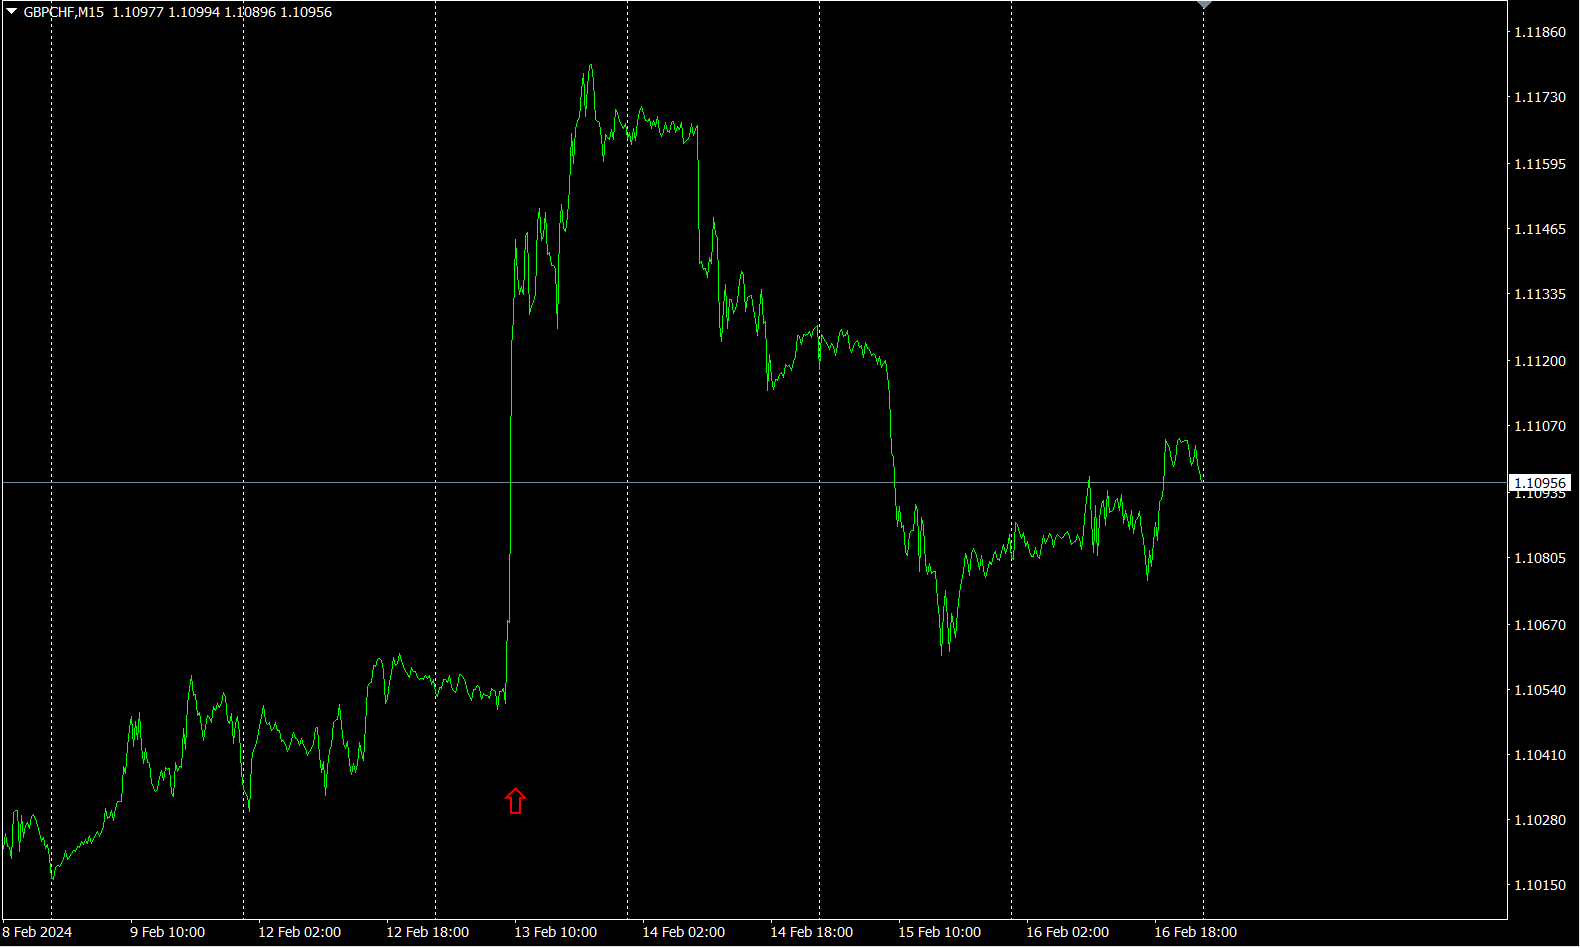
The red arrows indicate where the screenshot was captured. It captures a rapid rise.
“28 currency pairsBest Select indicator can easily identify which currency among the 28 pairs has the strongest trend. It also tells you, with numbers and colors, whether you should trade now. It is an excellent indicator for assessing all currency pairs at a glance.
“28 currency pairsBest Select indicator”
https://www.gogojungle.co.jp/tools/indicators/35128

3. 2021Year5月から追っているEURJPY movement, what happened?
In2021 year, May,
To view overall trends, I have drawn about30 minutes of the most recent3 weeks on a chart.
Previously I wrote the following.
JPY is rising,EUREURJPY is expected to fall.
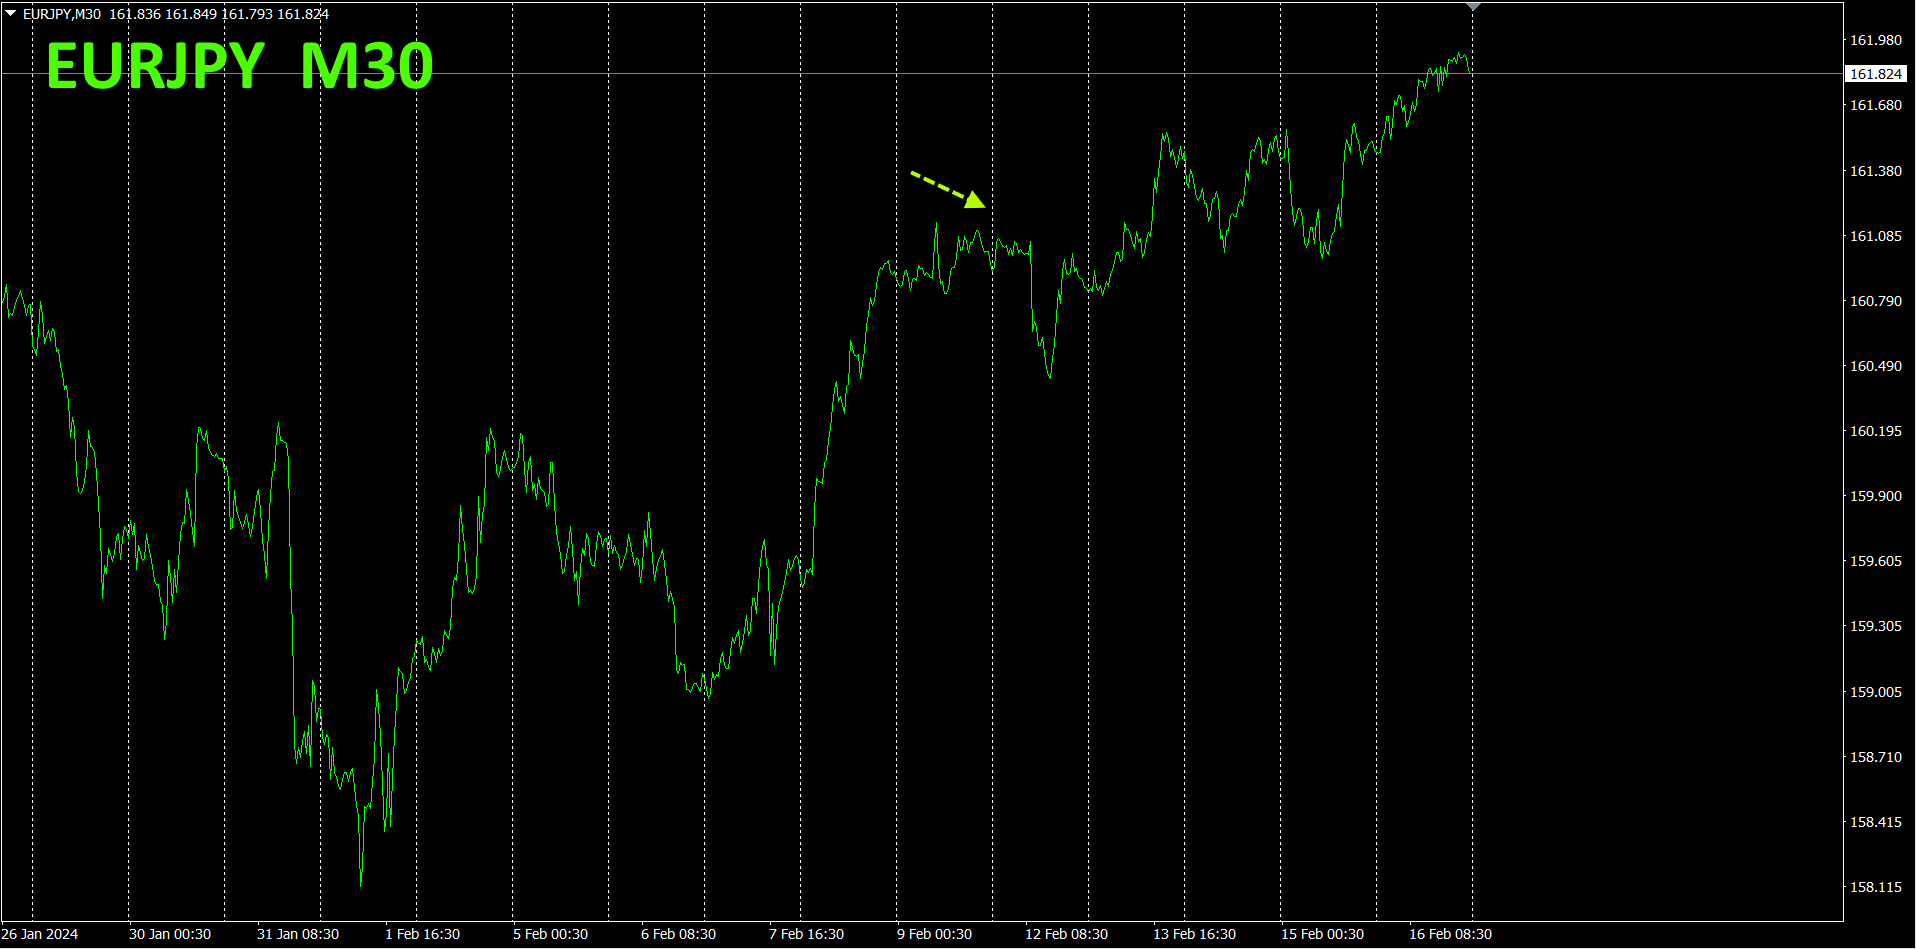
It dipped slightly on Monday, but then rose.
30 minutes of currency-strength chart.
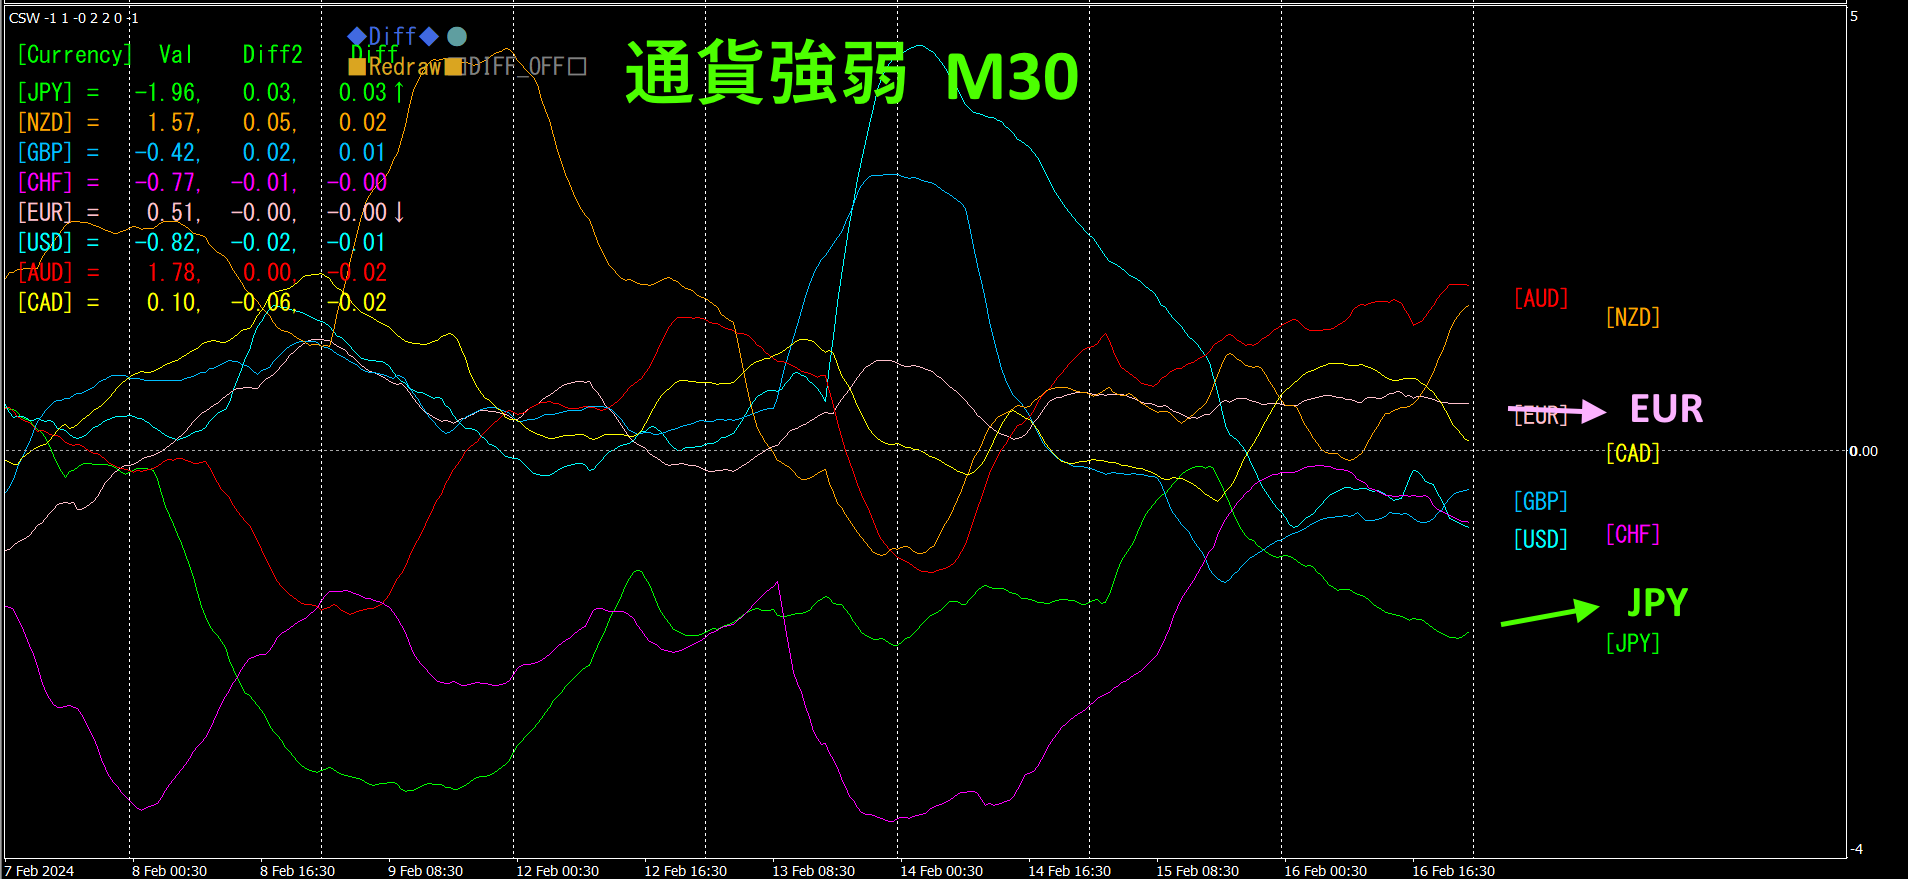
Pink indicatesEUR, green indicatesJPY.JPY is slightly rising,EUR is slightly falling. The chart has little directional clarity, but is expected to dip slightly.
4. Identify tops and bottoms across all currency pairs and formulate a trend strategy (target:NZDCHF).
Use"天底Search Indicator" to select the currency pair at the bottom, choosingNZDCHF. Aiming for a rise from the bottom.
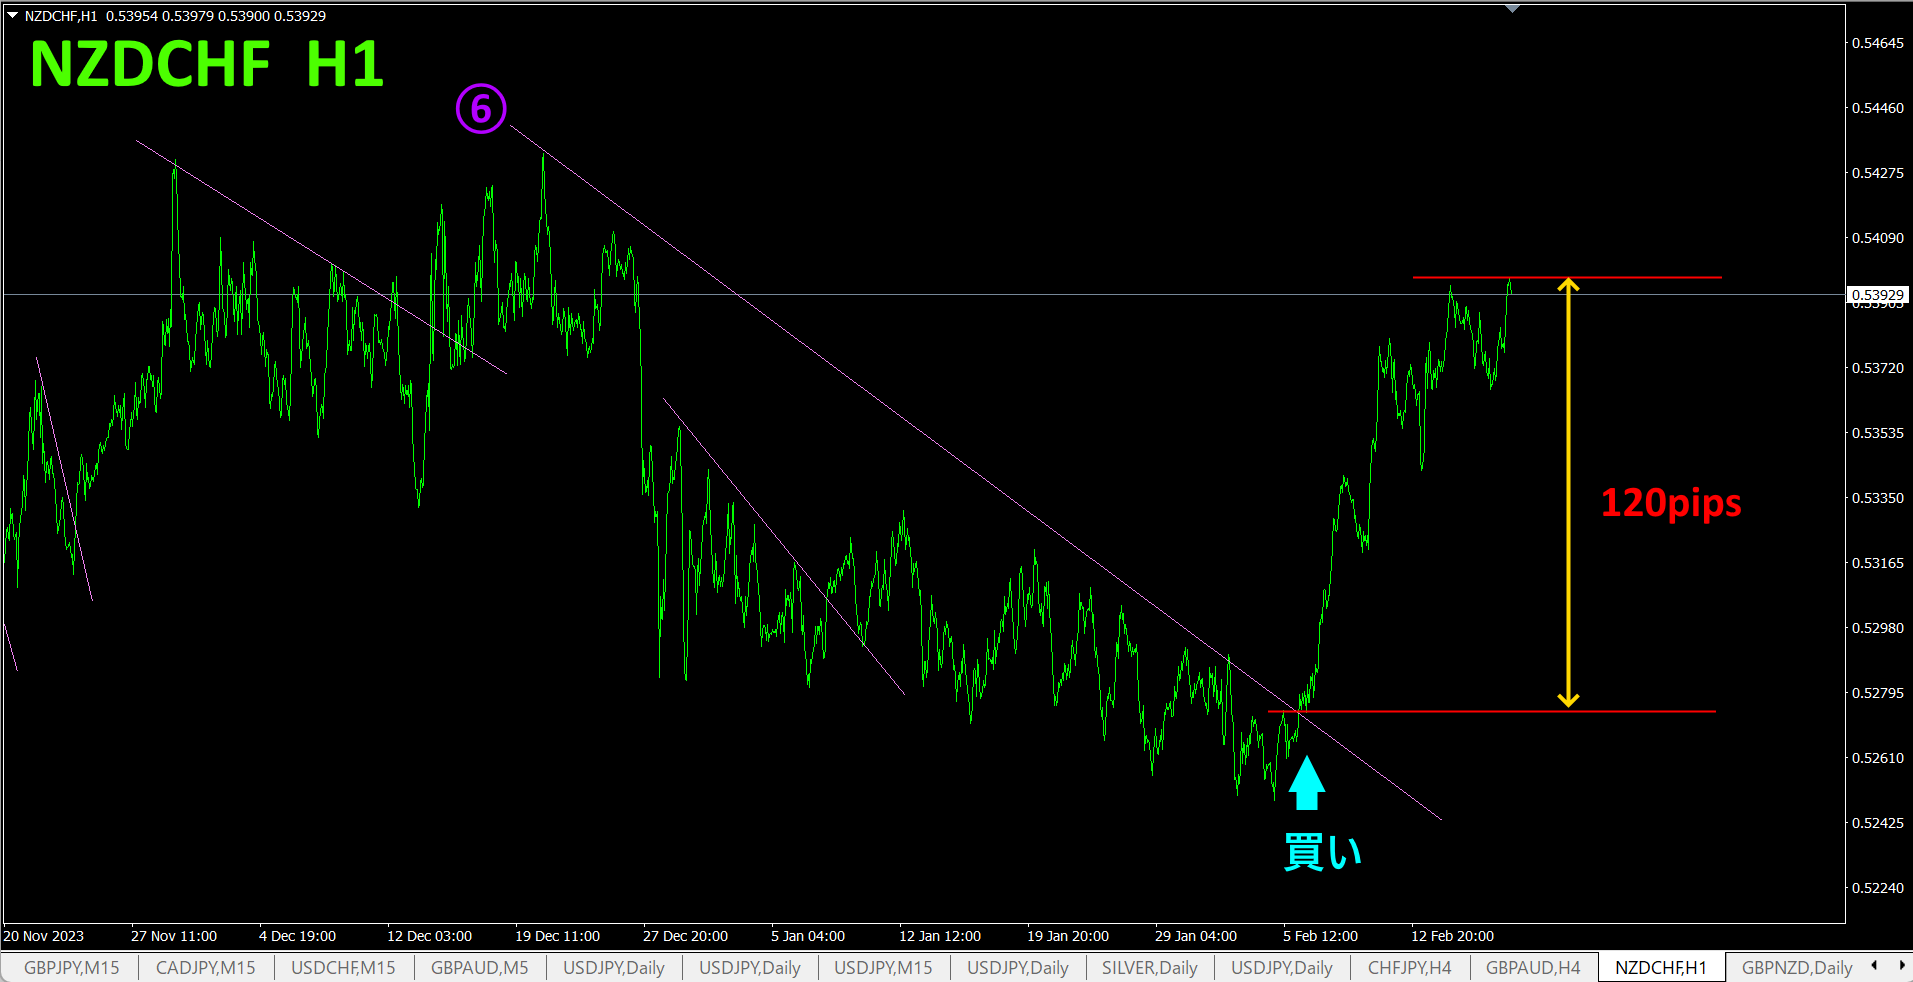
Having broken above the sixth decreasing line, I opened a buy position. It seems to have hit resistance and paused briefly. With unrealized gains of120pips, you could exit to lock in profits. Alternatively, you could hold until the rising trend line is broken using the“Trend Line EX”.
Refer to the 4-hour currency-strength chart.
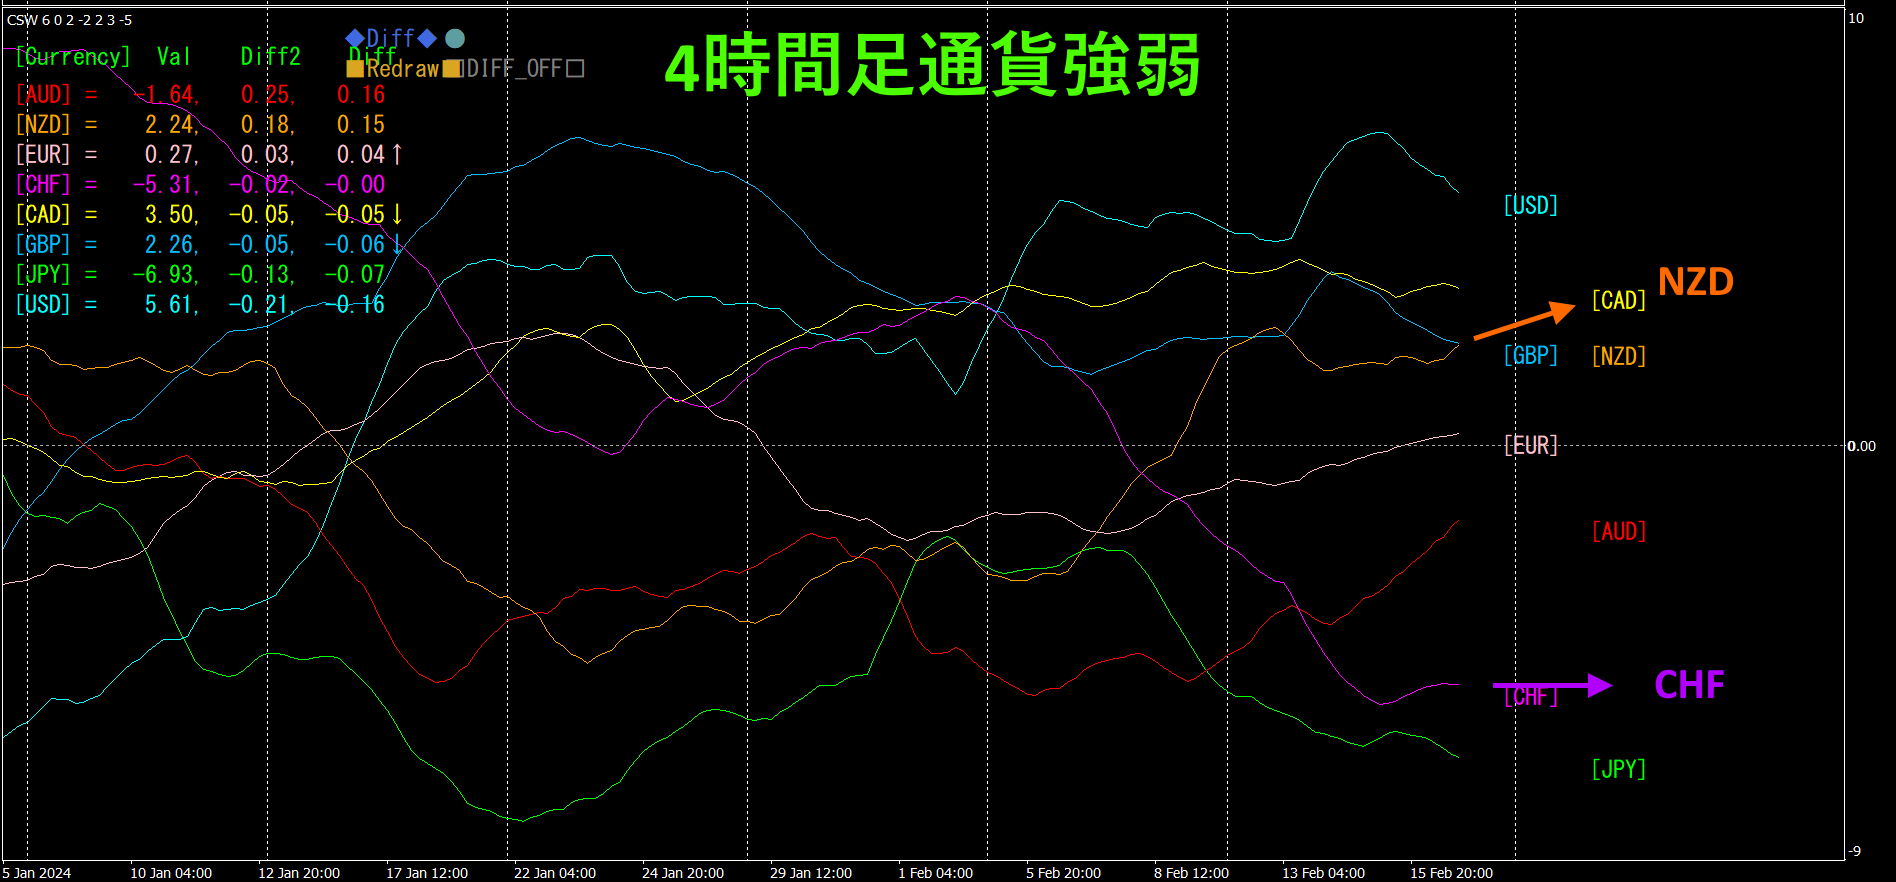
Red-purple indicatesCHF, orange indicatesNZDNZD is slightly rising,CHF is flat,NZDCHF
By comparing the usualFX charts with currency-strength charts simultaneously, the trend direction becomes clearly “visualized.”
Semi-automaticEA’s “Trend Line EX” allows you to draw an angled downward line and automatically buy when it is broken upward, and automatically close when the ascending line is broken, enabling a passive trading style.
※“Trend Line EX

https://www.gogojungle.co.jp/tools/indicators/42257
If you are interested in the “8C Currency Strength Visualization Indicator,” please refer to the page below.
MT4 version https://www.gogojungle.co.jp/tools/indicators/39150
MT5 version https://www.gogojungle.co.jp/tools/indicators/39159
【My items for sale】


