

【February 11, 2024】Past validation using sky and earth indicators (Bitcoin)
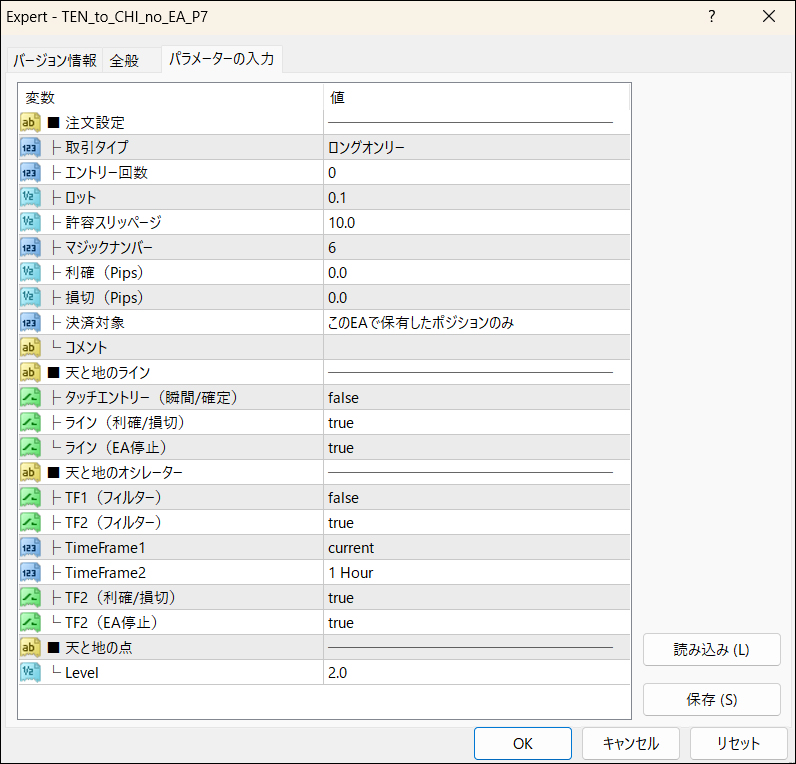
This is a verification for BTCUSD (Bitcoin). We will introduce the trading method using the EA pattern⑦ that we distributed recently. Some strong users have already put it into practice. They reportedly generated profits reliably.

・This article mainly focuses on past verifications using the “Heaven and Earth Indicator.”
・The content is based on the premise of using the most accurate“15-minute chart + 4-hour chart simultaneous monitoring method” in this tool.
・This tool is a groundbreaking trading tool that can be used even without understanding the so-called FX theories (Elliott Wave, Dow Theory, Gann’s laws, cycle theory, price action, Fibonacci, support/resistance, channels, etc.).
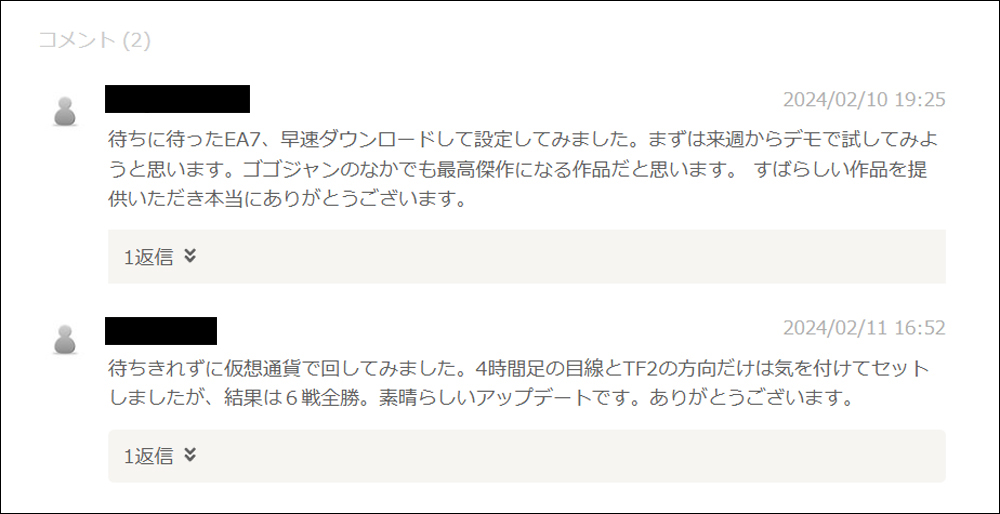
・The articles linked below feature valuable DMs from users. We are carefully selecting winning reports and other useful DMs, so I’m sure they will be helpful to everyone.
【Updating daily】 Impressions from users who actually used Heaven and Earth Indicator (DM version)
【February 4, 2024】 Searched for “Heaven and Earth Indicator”

Heaven and Earth Indicator is a trading method using my original indicator, released in February 2022, developed by me, Abi. Thanks to everyone’s support, I have won the“GogoJungle Award 2022, 2023” for two consecutive years.
■ Heaven and Earth Indicator
https://www.gogojungle.co.jp/tools/indicators/35780
■ Heaven and Earth Indicator【MT5版】
https://www.gogojungle.co.jp/tools/indicators/47523
■ Heaven and Earth Mountain
https://www.gogojungle.co.jp/tools/indicators/37744
■ Heaven and Earth EA ~ Semi-discretionary Auto Trading System ~
https://www.gogojungle.co.jp/tools/indicators/43213
■ Heaven and Earth Dashboard
https://www.gogojungle.co.jp/tools/indicators/46257
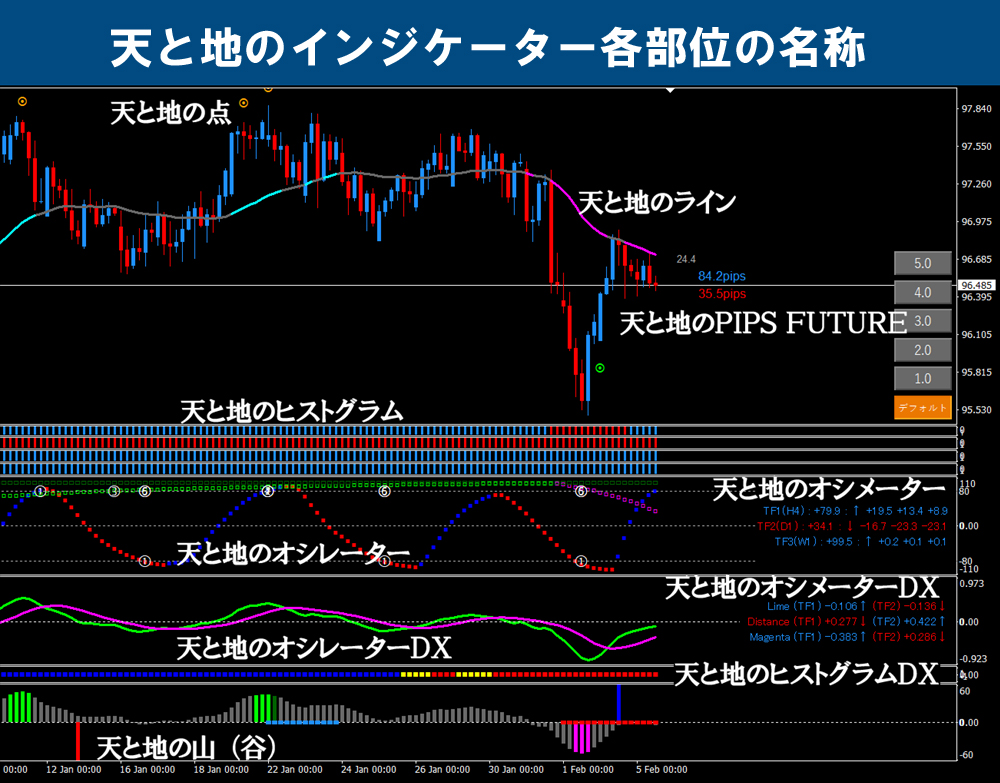
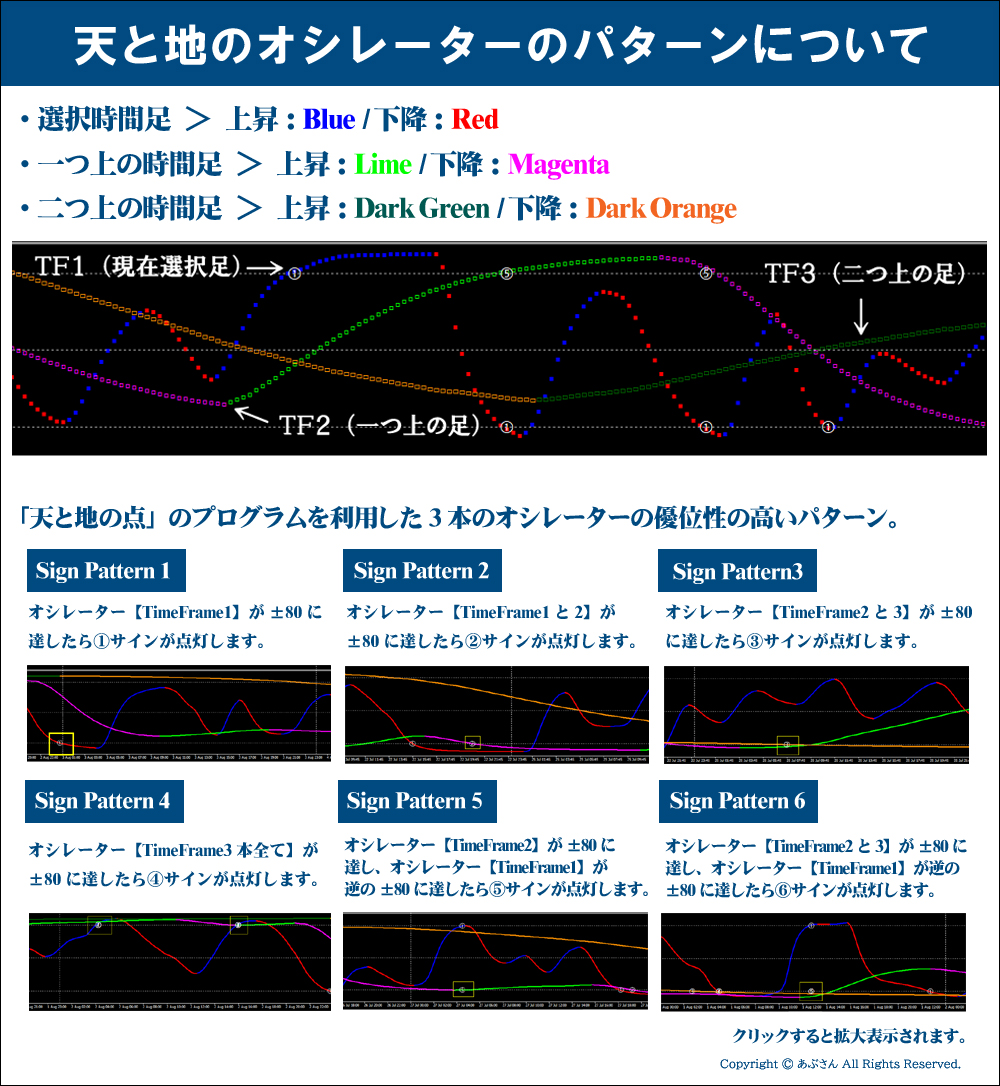
※Regarding the specialized terms used in this blog, please refer to the following: “Names of each part of Heaven and Earth Indicator” and “Oscillator patterns of Heaven and Earth.” If you have any further questions, you can usually understand by referring to Heaven and Earth Indicator’s sales page. If you are already a user, reading the manual should suffice.
Now, I would like to proceed to verification.
Thank you in advance!
※ All images can be enlarged by clicking on them.

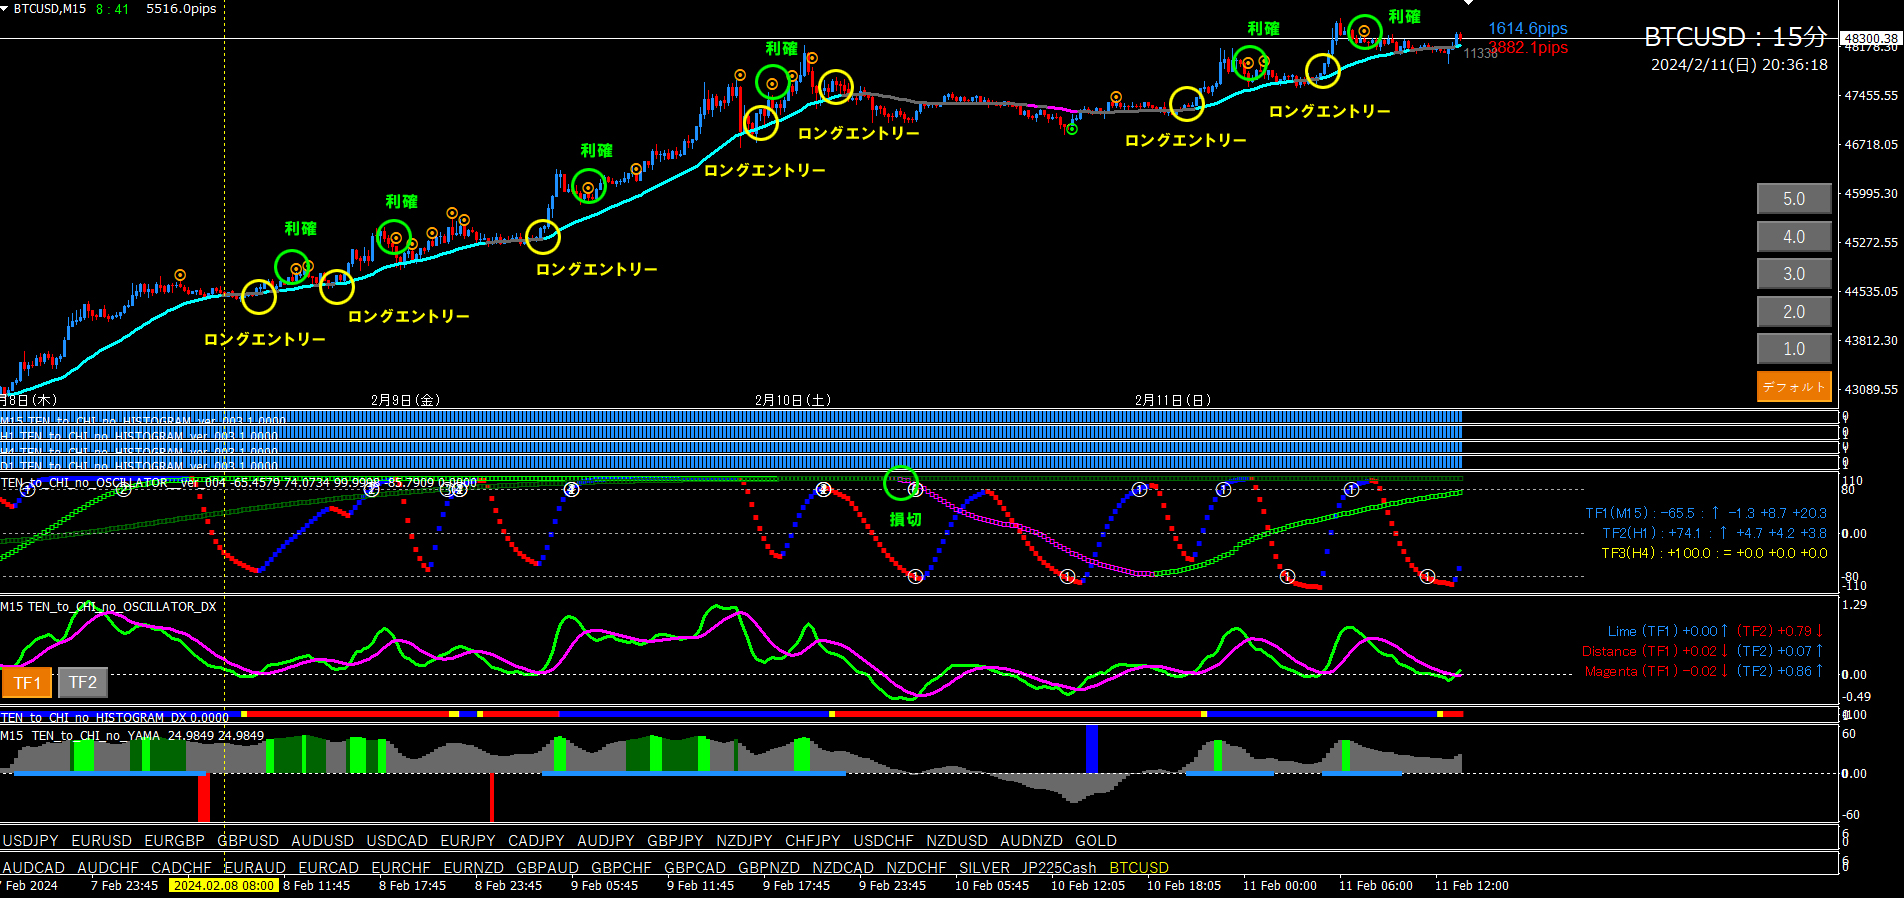
BTCUSD15-minute chart + 4-hour chart Past Verification (February 8, 2024 –Present)
※ Please look at the yellow vertical line. There is a yellow vertical line in the 15-minute chart as well. (Using the LINK LINE)LINK LINE.
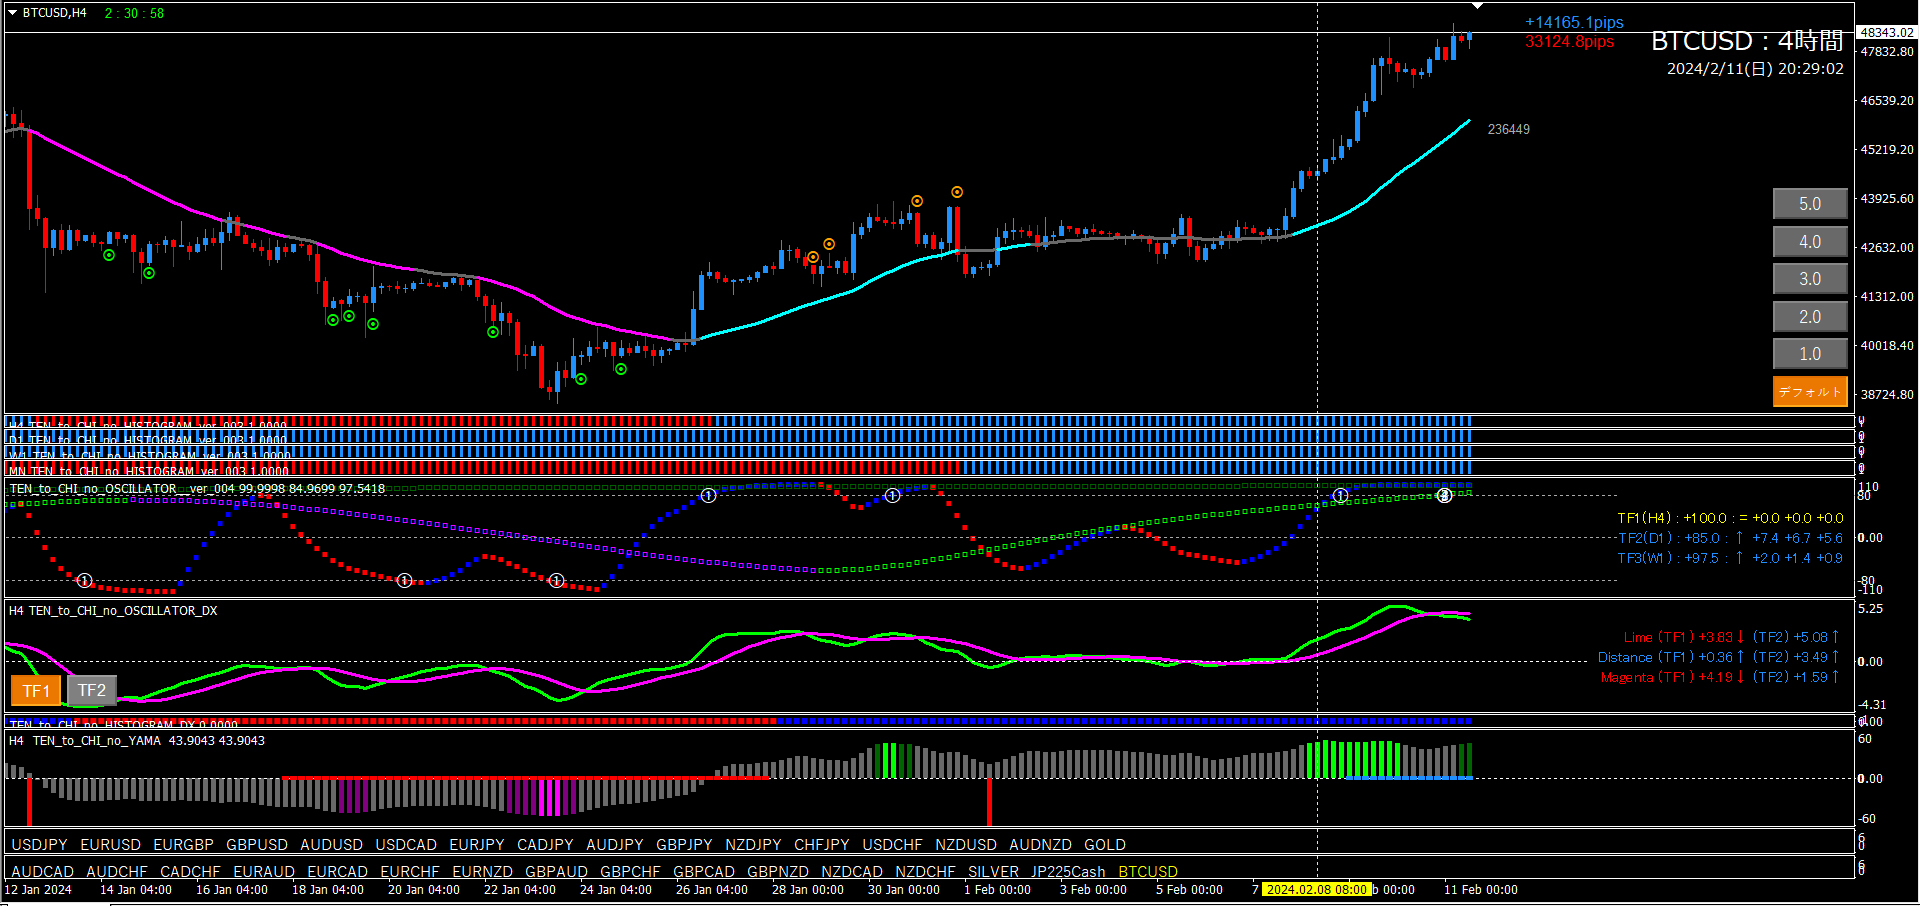
■ 4-hour chart (Environmental recognition)
The yellow vertical line marks the place where the upward trend is judged.
Oscillator TF2 is rising toward +80, and TF1 is also around +80. This pattern indicates the last surge of upward momentum. Oscillator DX is also diverging. Heaven and Earth Mountain is highlighted, the histogram is fully blue. Based on these, it is reasonable to expect a short entry signal to appear with an upward bias.
The yellow vertical line marks the point on the 4-hour chart where the upward bias was judged.
The yellow circle indicates the short entry point. The green circle indicates the take-profit point.
From the 4-hour chart state, we determine a very strong uptrend and adopt Trade Pattern ③ Reversion version. However, be sure to adhere to the condition that the 4-hour short entry signal must appear first.

That’s all.
I hope it provides some help for everyone.
