

Use of "Visualization Indicators" (Part 133)
Utilization of the “Visualization Indicator” (Part133)
1. Further evolve the “28 Currency Pair List Indicator” into an indicator
“8CPVisualization Indicator”to drawNZDUSD.
The “8CPVisualization Indicator” includesOceania版,London版,NewYork版,AnyCP版. This time, the Oceania version was used.
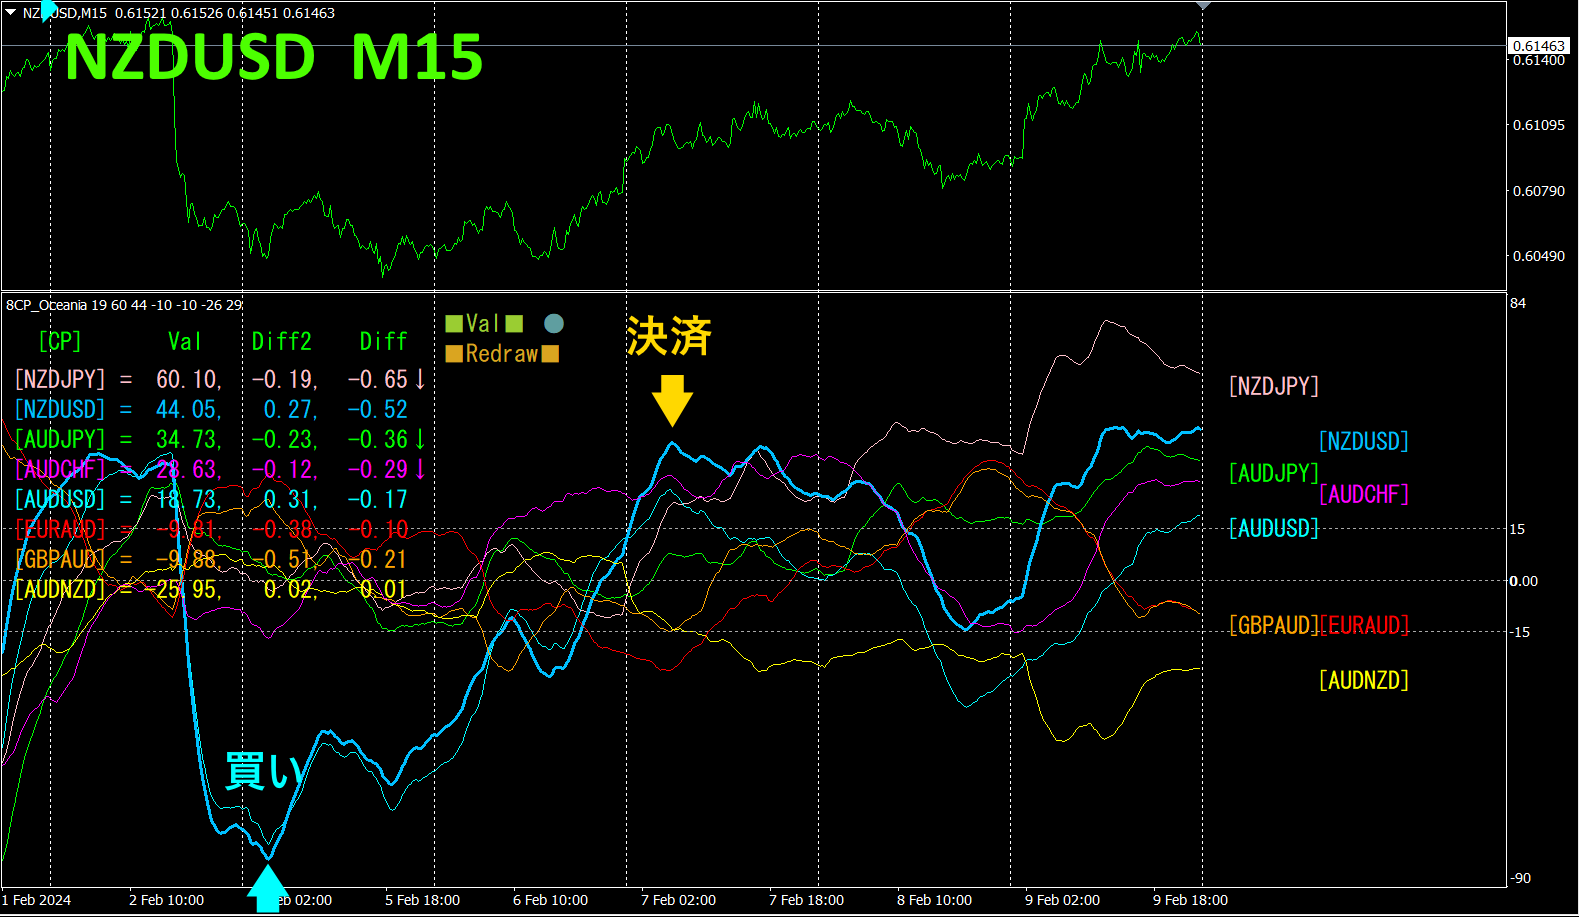
The upper half is the 15-minute chart ofNZDUSD. The lower half is from the “8CPVisualization Indicator”; the light blue thick line graph corresponds toNZDUSD.
On Monday,NZDUSD reversed from a large downward deviation and moved toward convergence, so a long entry was made. If closed on Wednesday,about60pipsprofit; if closed over the weekend,about100pipsprofitwas obtained.
With the “8CPVisualization Indicator”, by focusing only on the most active currency pair movement, you can trade efficiently.
2. Best SelectIndicator to try
The below figure is a screenshot from2024 yearFebruary916:42(JST)
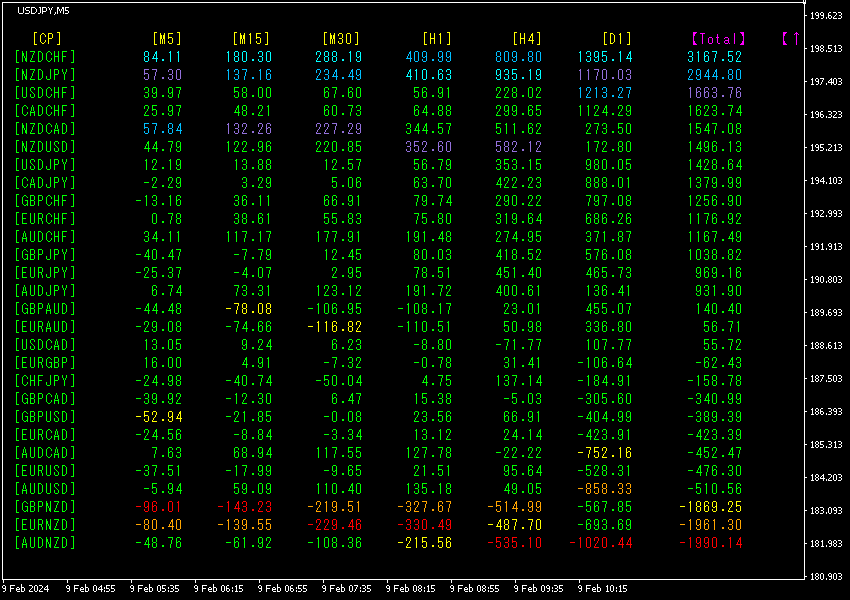
Numerical values are sorted in descending order. The top-most row,NZDCHF, shows blue-style colors across all timeframes, and the value is3167.52, a large positive figure.NZDCHF indicates an upward trend is occurring.
Now, let's look at theNZDCHF chart.
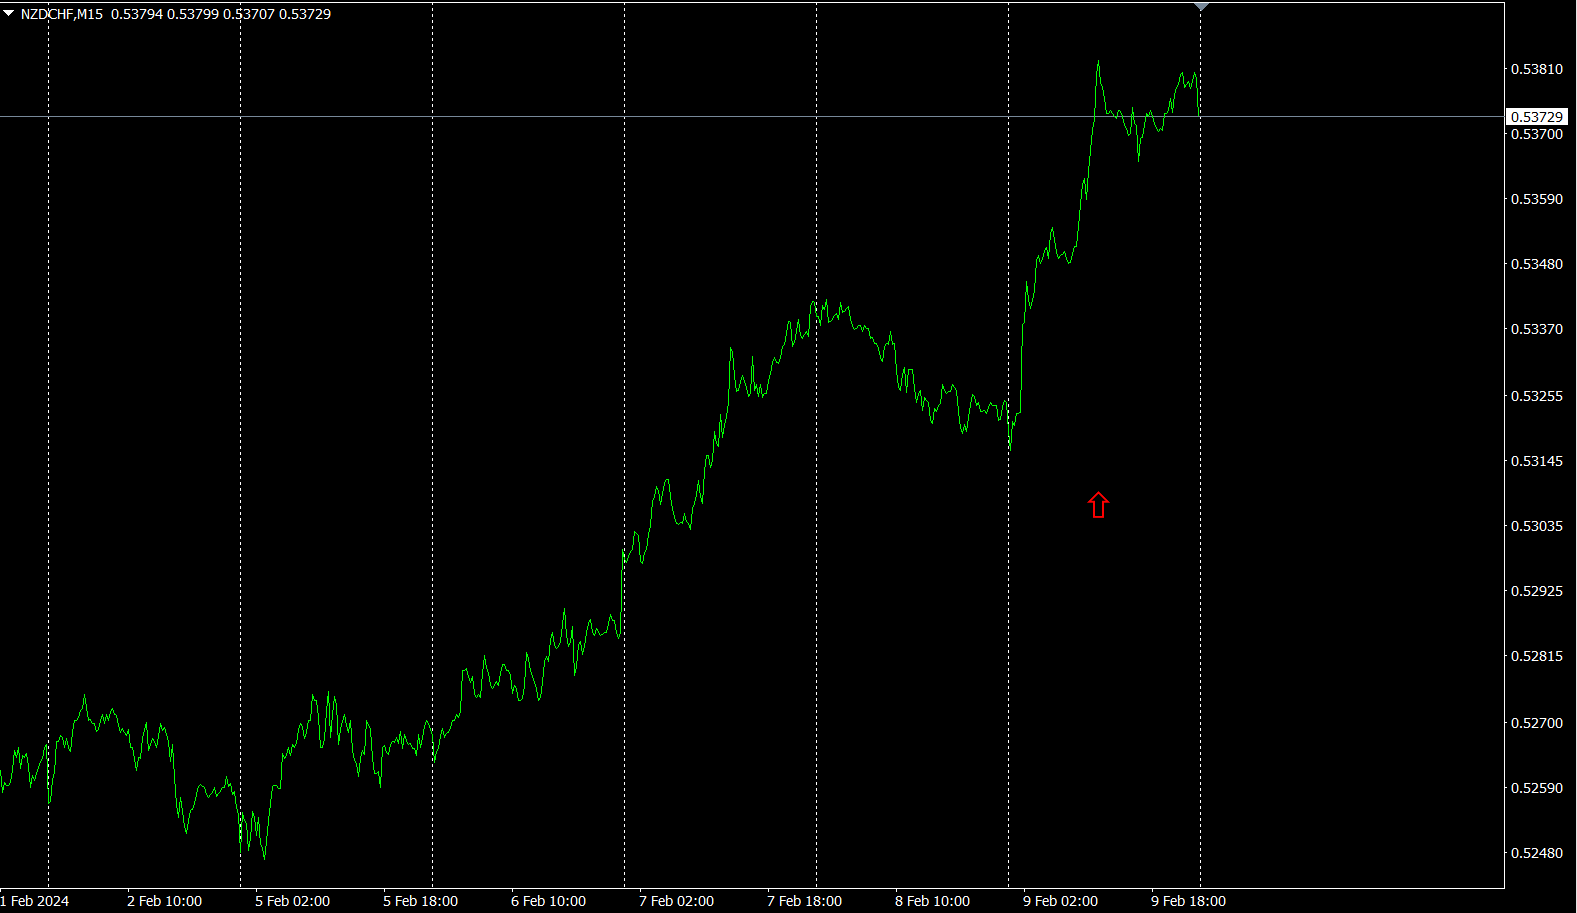
The red arrows mark where the screenshot was taken, capturing a sharp rise.
“28 currency pairsBest Select
“28 currency pairsBest Select indicator”
https://www.gogojungle.co.jp/tools/indicators/35128

3. 2021 yearMay started trackingEURJPY
2021 yearMay onward,EURJPY movements have been tracked.
To view the overall trend,30-minute chart shows roughly3 weeks of data.
Previously, I wrote the following.
Going forward,EUR appears slightly stronger in currency strength thanJPY, soEURJPY is expected to rise.
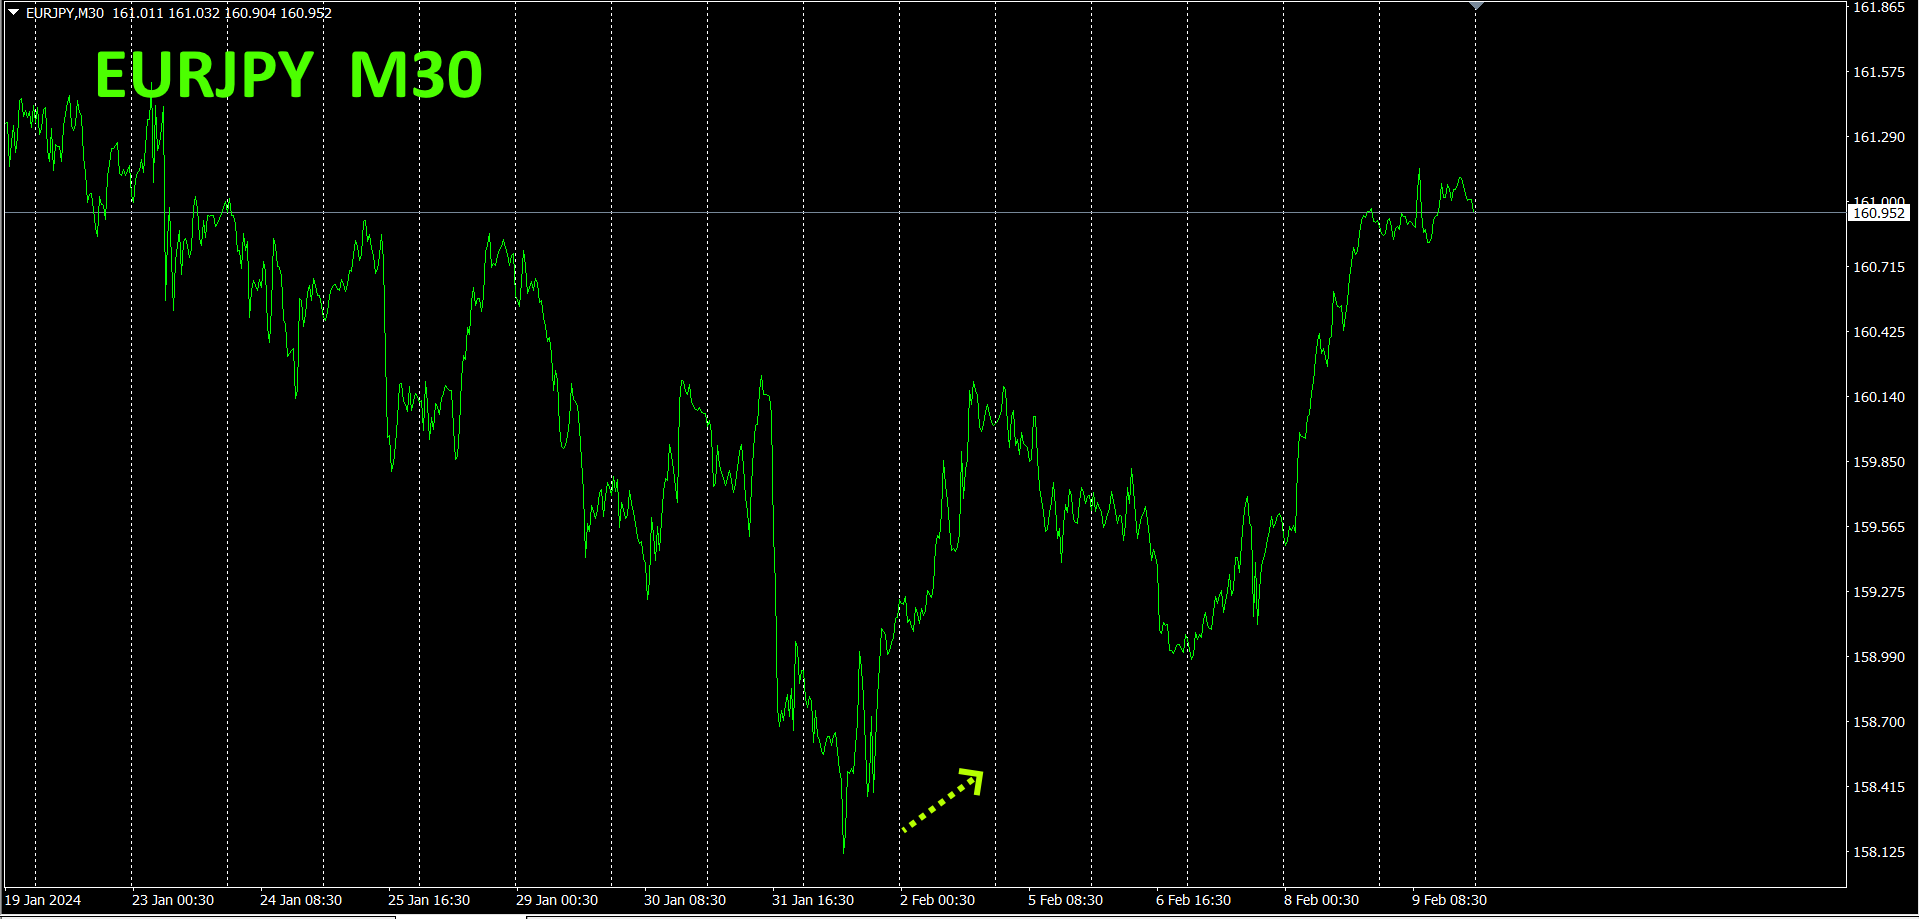
In the first half of the week it dipped slightly, but rose in the second half.
30-minute currency strength chart.
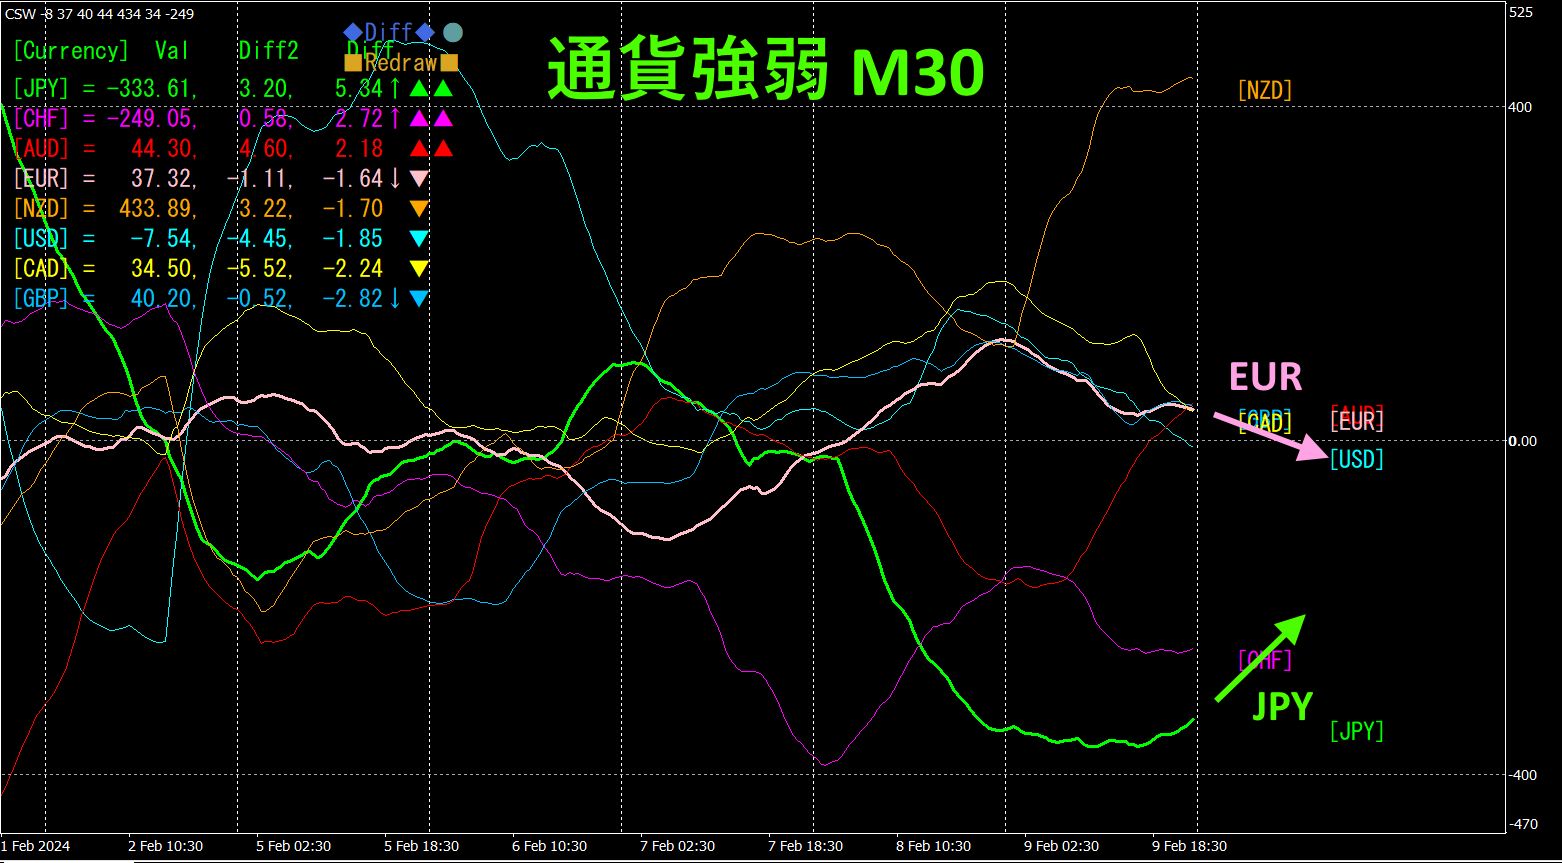
Pink isEUR, green isJPY.JPY has turned upward, whileEUR has turned downward. As a result, is expected to decline.
4. Find tops and bottoms among all currency pairs and formulate a trend strategy (target:NZDCHF)
2505“Top-Bottom SearchIndicator” was used to select the currency pair located at the bottom,NZDCHF
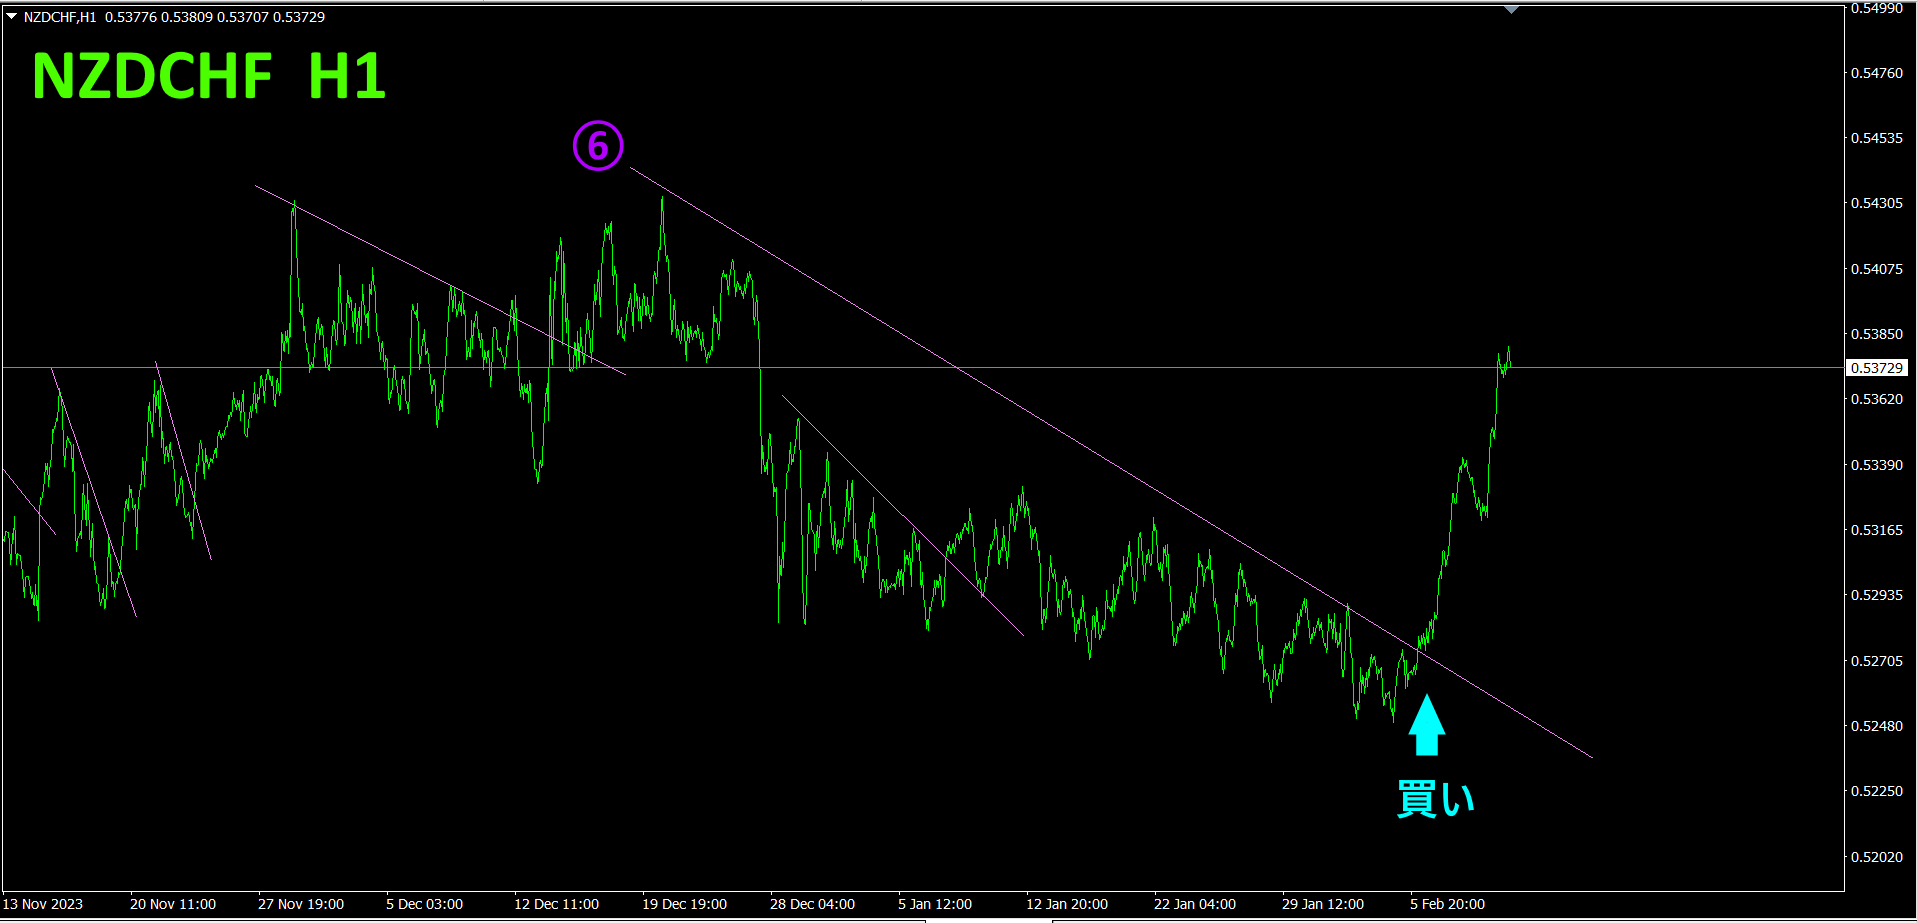
It finally started rising. Since it broke above the sixth lower-trend line, I opened a buy position. Using“Trend Line EX” allows pinpoint buying.
Refer to the 4-hour currency strength chart.
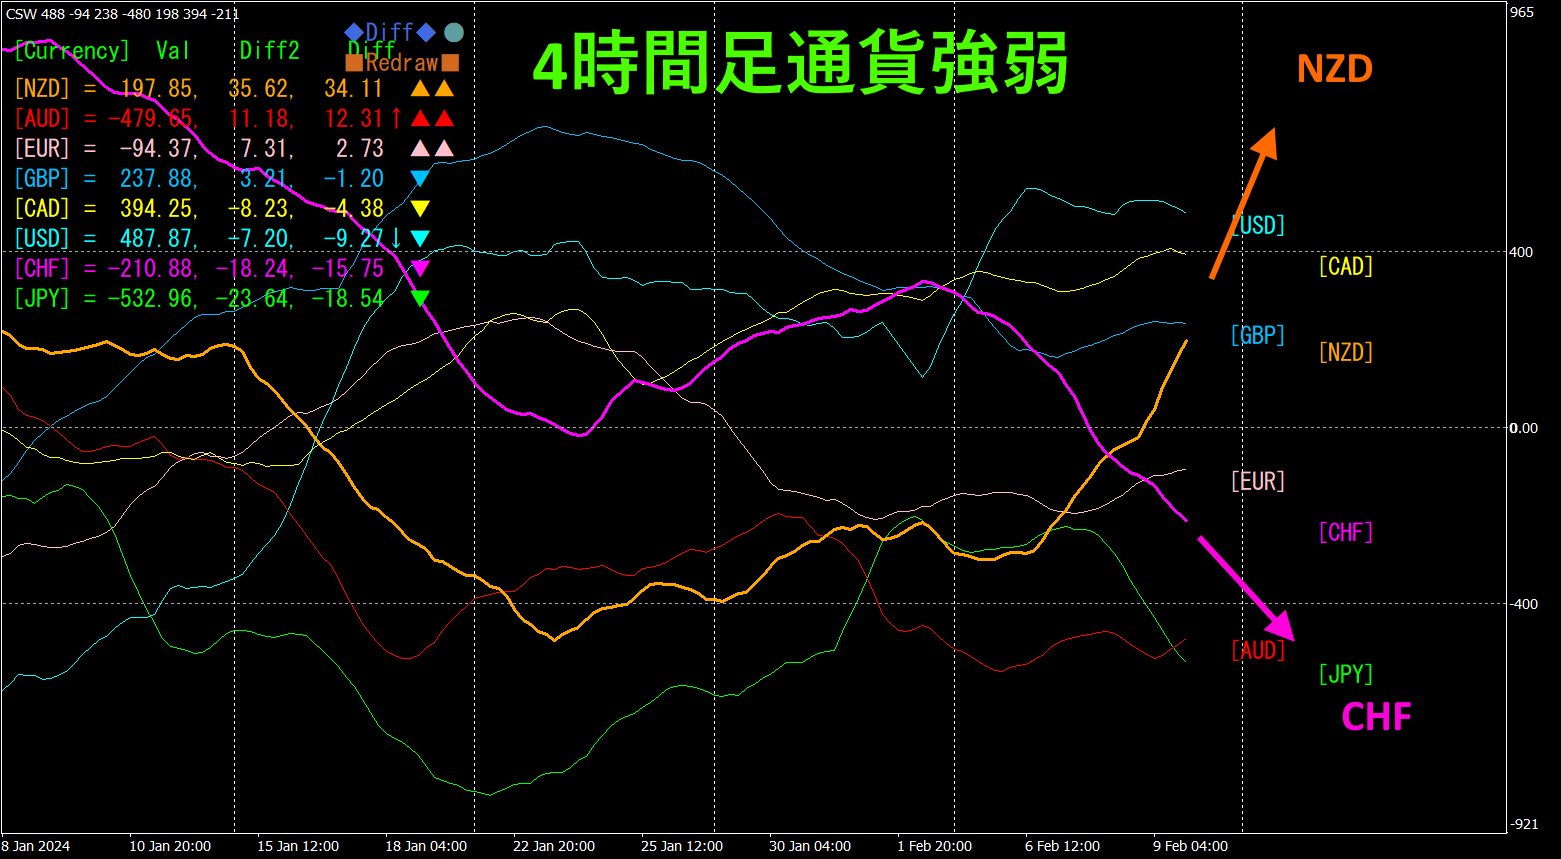
Red-violet isCHF, orange isNZD.NZD has risen sharply. MeanwhileCHF is declining, so should rise substantially.
Comparing the usual FX chart with the currency-strength chart makes the trend direction clearly visible as “visualized.”
Semi-automaticEA with the “Trend Line EX” allows you to place a slanted lower line, automatically enter buys when it breaks upward, and automatically exit when it breaks above the rising line, enabling a hands-off trading approach.
※“Trend Line EX”

https://www.gogojungle.co.jp/tools/indicators/42257
For those interested in the8C Currency Strength Visualization Indicator, please refer to the following page.
MT4 version https://www.gogojungle.co.jp/tools/indicators/39150
MT5 version https://www.gogojungle.co.jp/tools/indicators/39159
【My listed products】


