

Usage of the “Visualization Indicator” (Part 132)
Utilization of the "Visualization Indicator" (part132)
1. Further develop the "28 Currency Pairs List Indicator" into an advanced indicator
“8CPVisualization Indicator”to chart AUDJPY
The “8CPVisualization Indicator” includesOceania版,版,版,版があります。今回は、版を使いました。
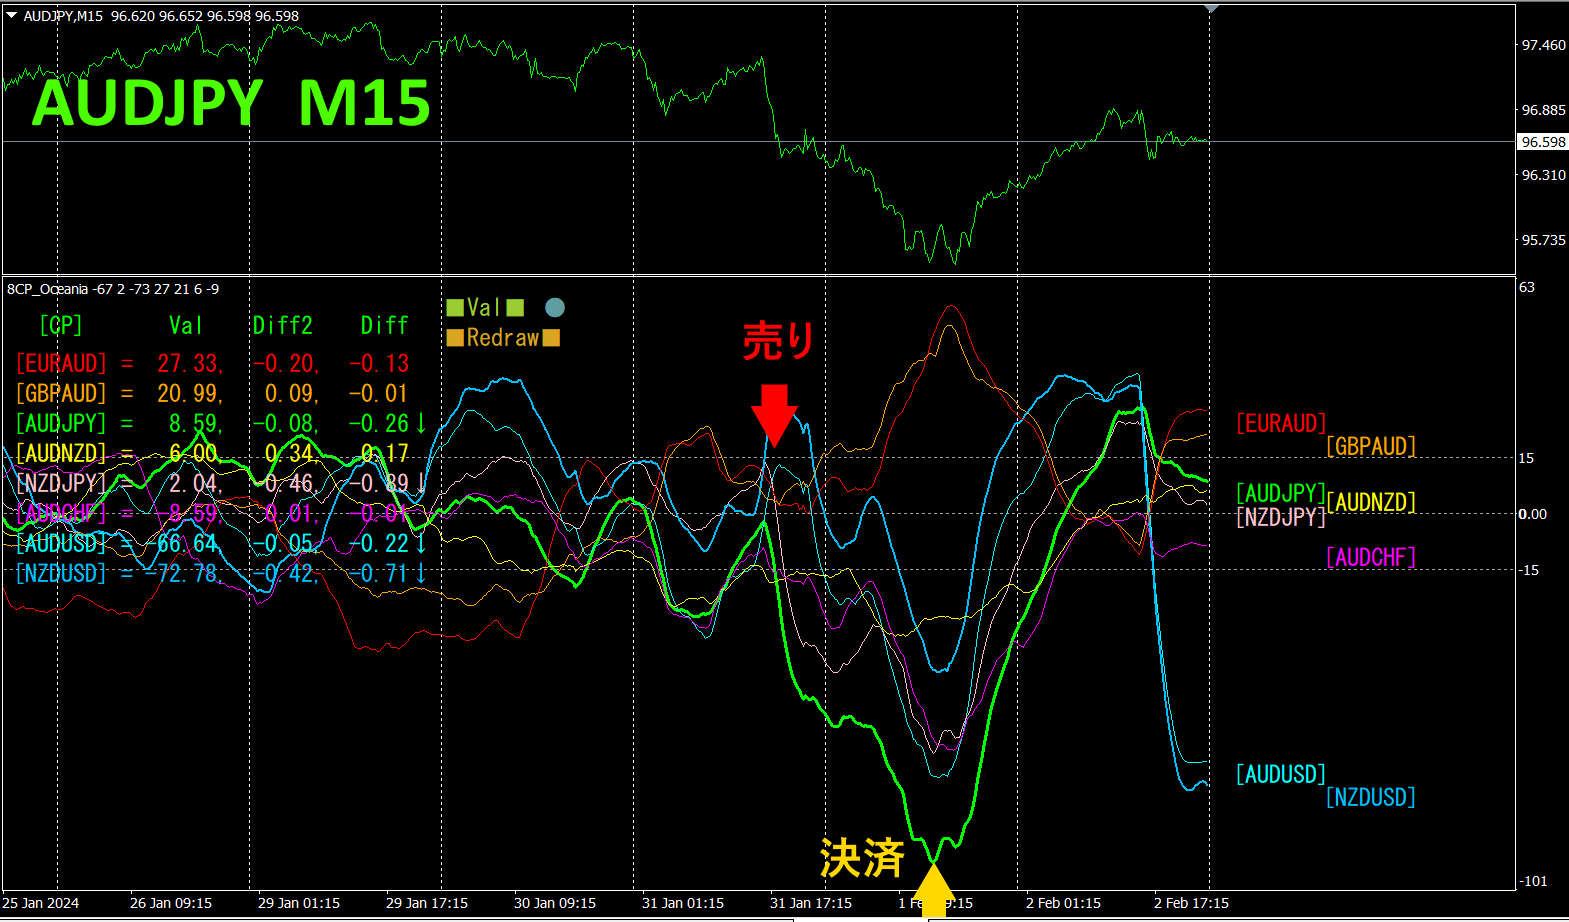
The top half is theAUDJPY 15-minute chart. The bottom half is from the “8CPVisualization Indicator”; the green bold line graph corresponds toAUDJPY.
On Wednesday, fell below the group of graphs, so we entered a sell. The next day, we closed the position at the point of reversal.About of profit was obtained.
With the “8CPVisualization Indicator”, by only watching the most volatile currency pair, you can trade efficiently.
2. Best SelectTry the Indicator
Below is a screenshot dated2024 year month day()
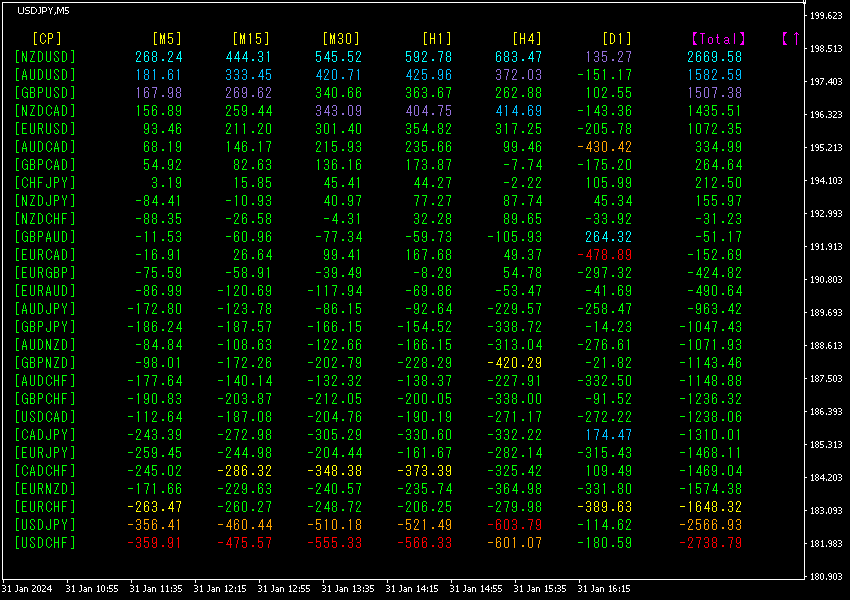
TotalNumbers are sorted in descending order. The topmost row shows, which appears blue on all timeframes, and value is, a large positive number. indicates an uptrend is present.
Now, let's look at the chart.
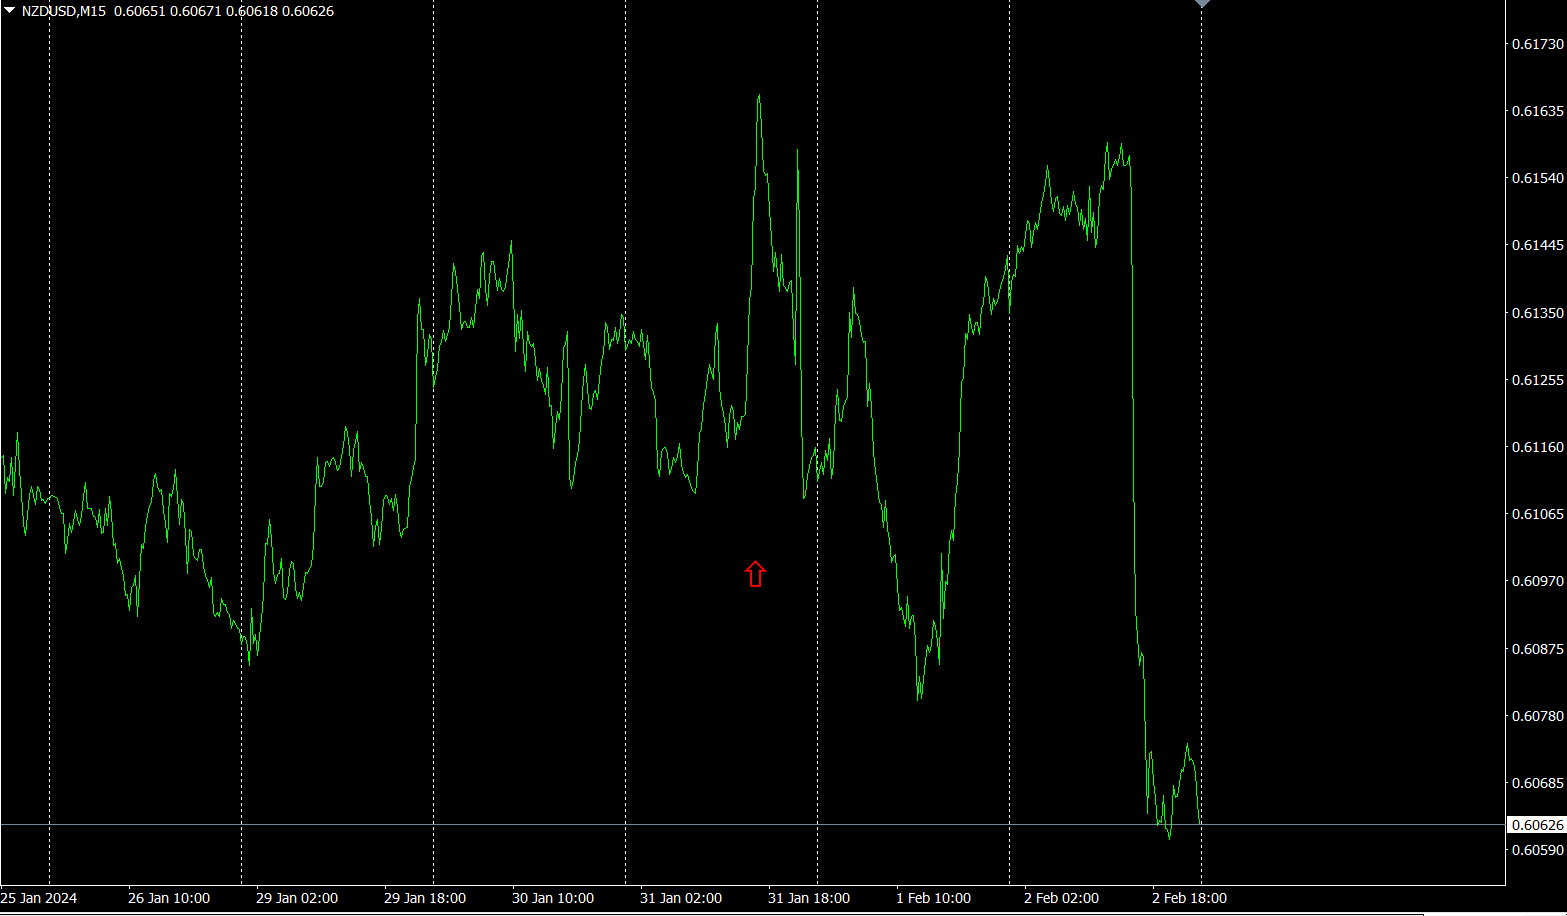
The red arrow marks where the screenshot was taken, capturing a sharp rise.
“ Currency Pairs Indicator”
“ Currency Pairs Indicator”
https://www.gogojungle.co.jp/tools/indicators/35128

3. 2021 year month?
Since2021 has been tracked.
To view the overall trend, a 30-minute chart covering about the most recent weeks is drawn.
Last time, I wrote as follows.
is downward, is somewhat upward. As a result, is expected to rise slightly.
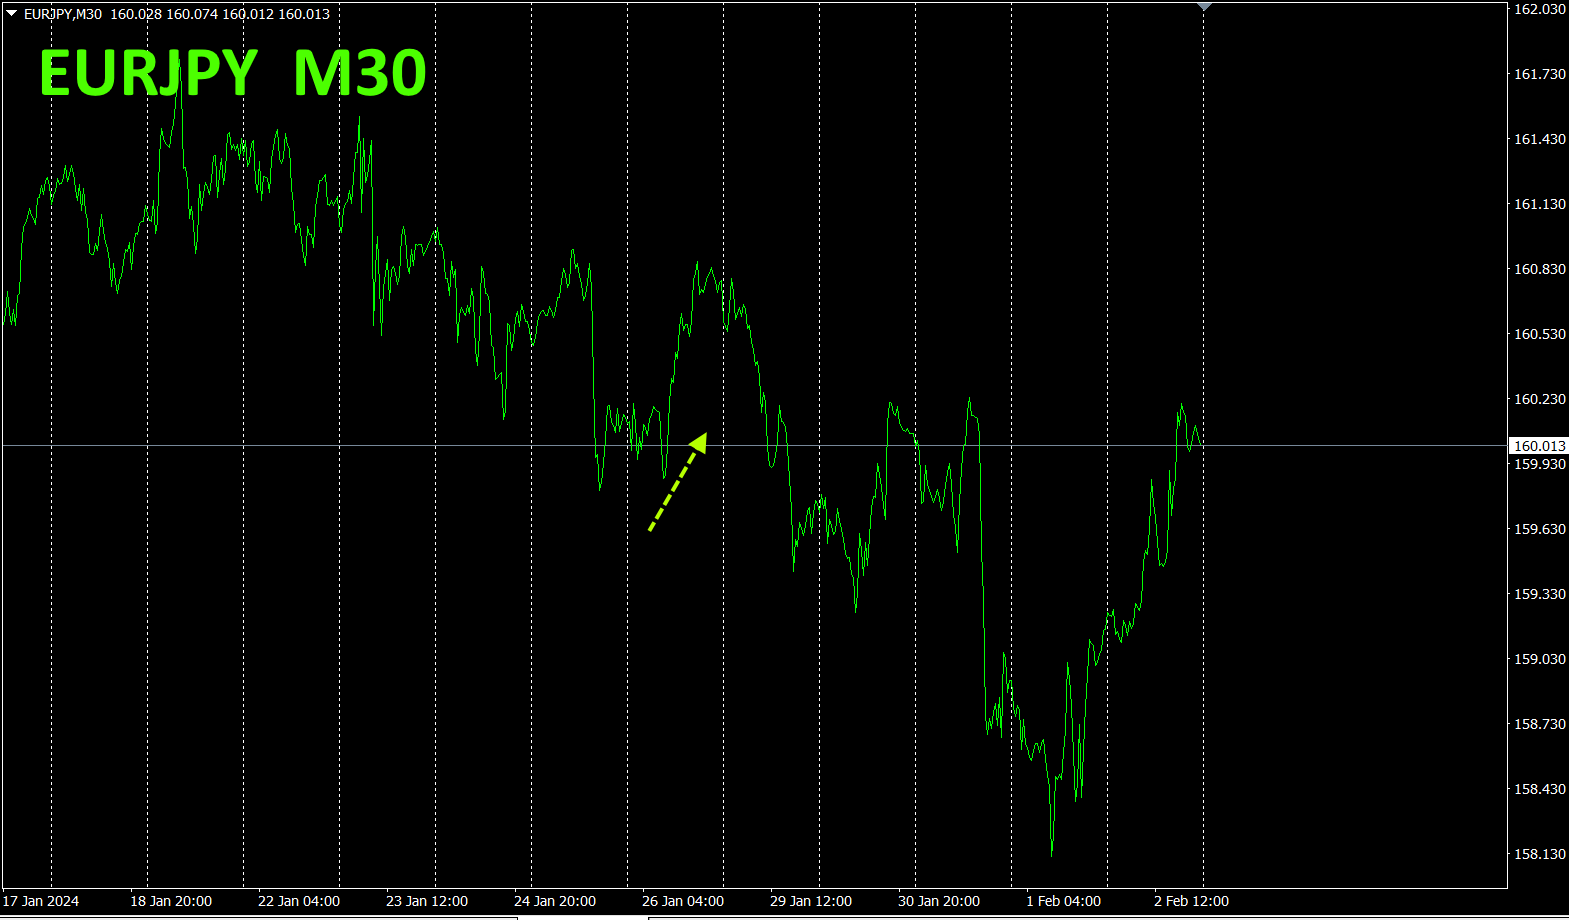
The expectation for a slight rise did not come true. After Monday, the currency became significantly stronger than the currency. As a result, fell.
minutes currency strength chart.
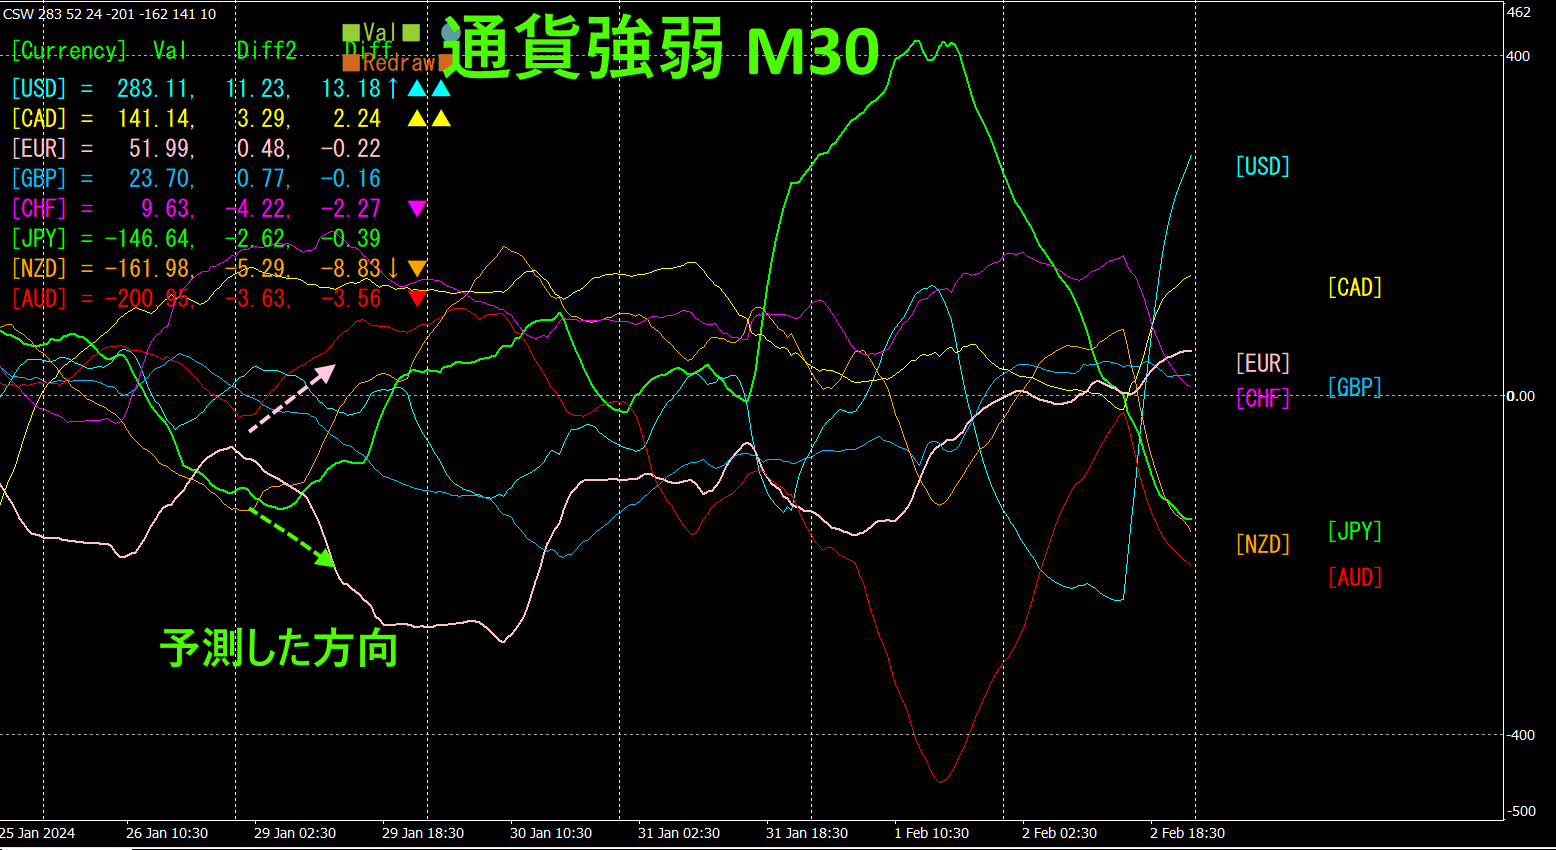
Pink is, green is. Against the predicted direction, moved upward, and traded below. As a result, declined. Going forward, since is relatively stronger than, is expected to rise.
4. Find tops and bottoms from all currency pairs and build a trend strategy (target:)
Using“Tops and Bottoms Indicator”, I selected the currency pair positioned at the bottom,. I am aiming for a rise from the bottom.
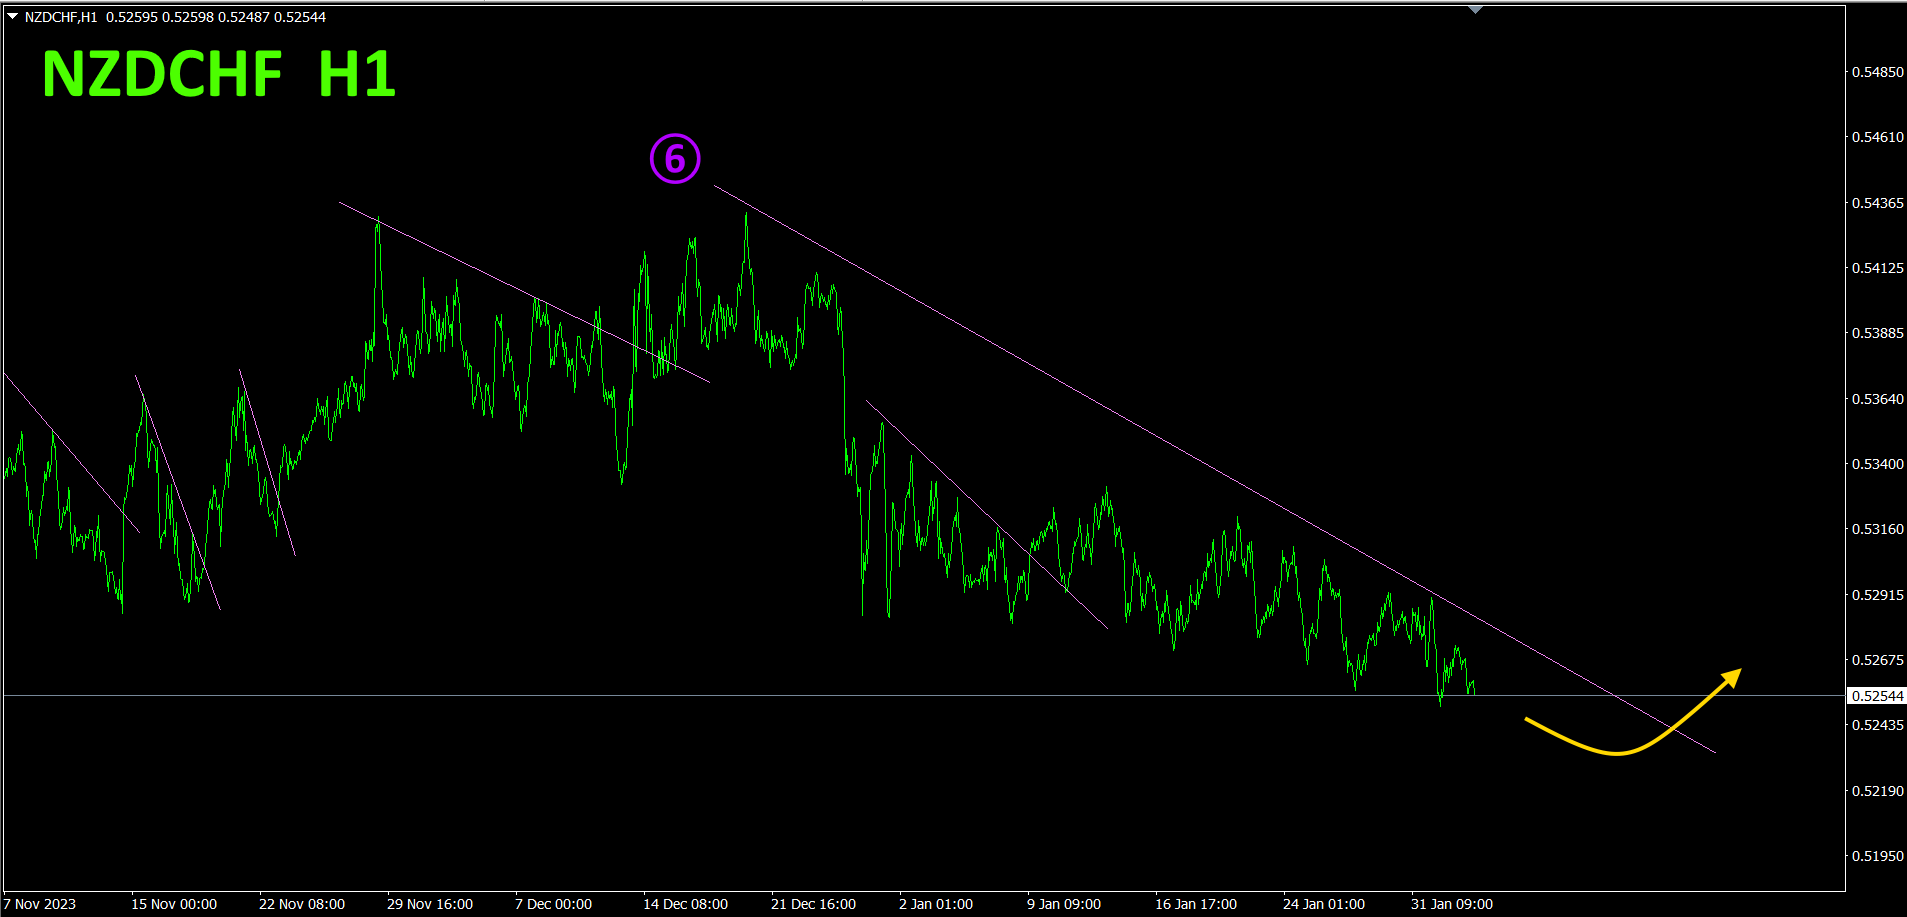
It’s not rising easily. Draw the sixth downward-sloping line, and buy when it breaks above.
Refer to the four-hour currency strength chart.
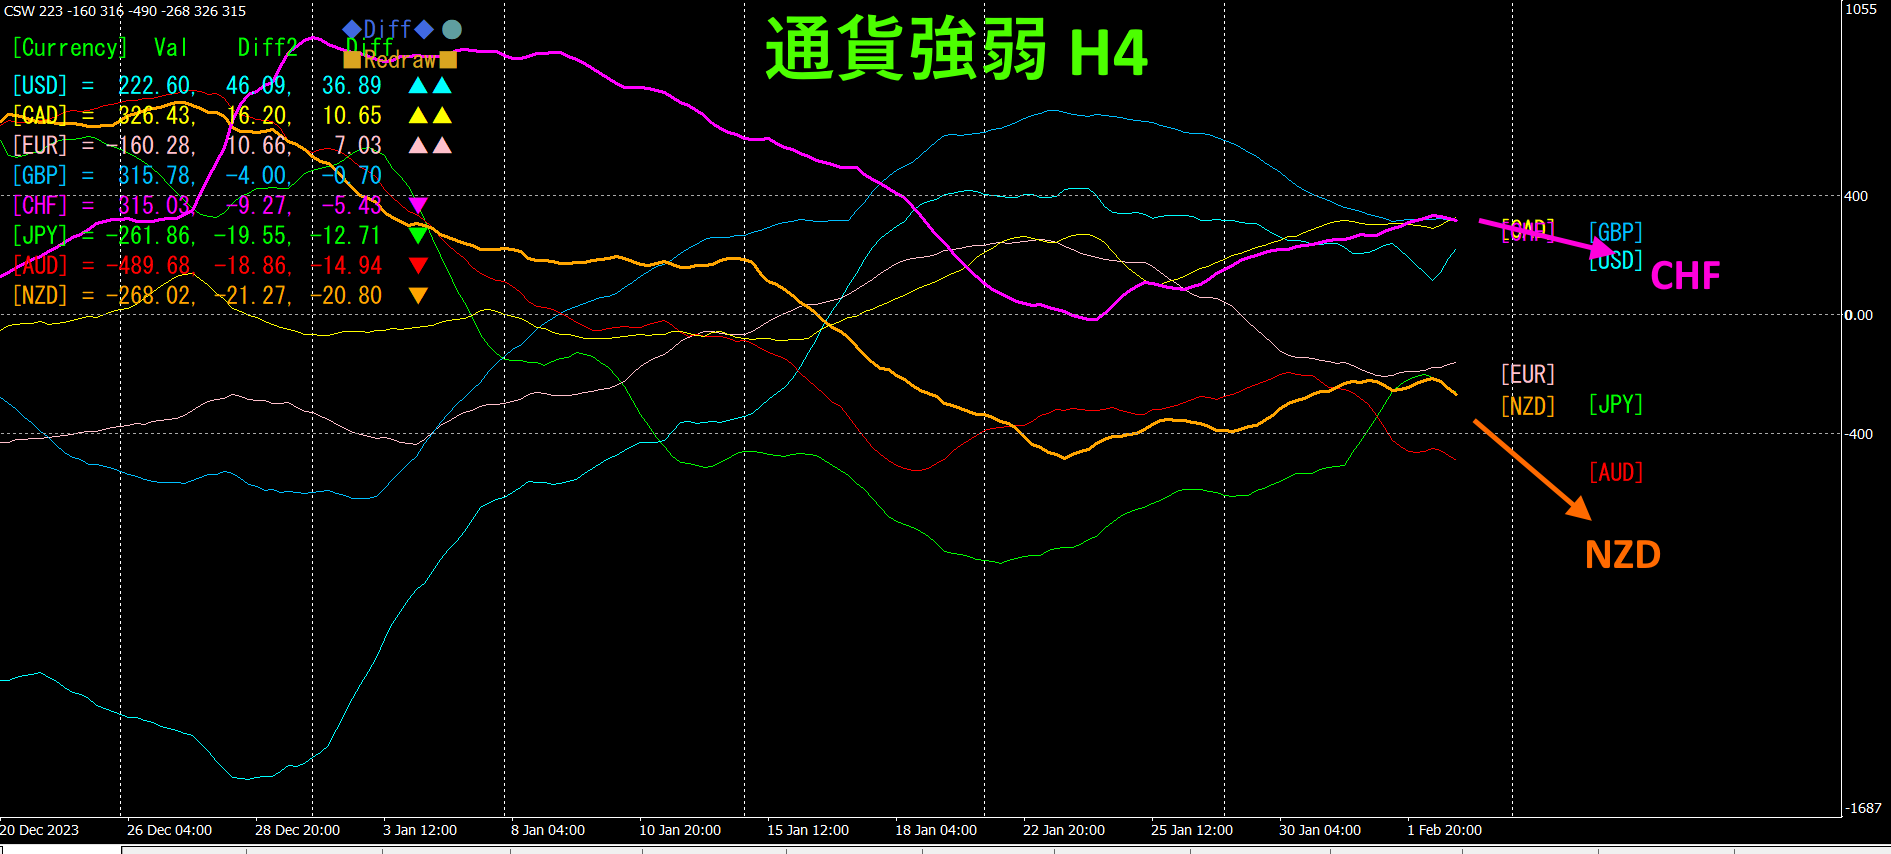
Red-purple is, orange is. CHF is downward. Therefore, will likely continue to fall for a while.
By comparing standard FX charts with currency strength charts, the trend direction becomes visible as an indicator.
With a semi-automatic, the “” enables drawing a diagonal downward line; if it breaks upward, it automatically buys, and if the upward line is broken, it automatically closes the trade, allowing for hands-off trading.
※“”

https://www.gogojungle.co.jp/tools/indicators/42257
For those interested in the “8Ccurrency strength visualization indicator
MT4 version https://www.gogojungle.co.jp/tools/indicators/39150
version https://www.gogojungle.co.jp/tools/indicators/39159
【My items for sale】


