
2/24 ゴゴジャンの「リアル口座 EA稼働率」について Translation: 2/24 About Gogojan's "Real Account EA Uptime/Utilization"
EA developer Reiwa no Double-IE here.
GogoJungle's system trade,
On the EA page there are graphs like the following.
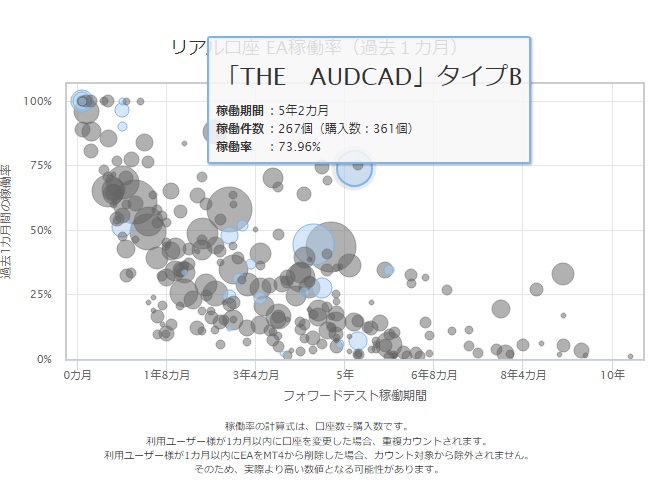
“Real account EA operation rate (past 1 month)”This is the graph.
This graph shows, against the number of purchasers,
the proportion of people actually running it.
In the “THE AUDCAD” Type B, it is 73.96%.
On the graph, compared to the forward test running period over five years,
the result is that more people are actively running it.
However,
the profit/loss graph on the sales page shows a rising trend,
and it wouldn’t be strange if nearly 100% were using it, but it’s in the 70% range.
Also,
as the forward test period progresses,
the overall number of running instances is gradually decreasing.
In 3–5 years, almost no one will be using it.
This is because,
even if an EA shows a rising trend,
the way of entering and exiting may not have been familiar to users,
some users may have been forced to exit due to portfolio choices with other EAs,
some may have FIRE'd after 3–5 years,
some found better investment products,
and various other reasons can be inferred.
Nevertheless,
As Reiwa no Double-IE, this is “unwelcome.”
This is because we are releasing an EA that we want users to enjoy for a long time.
There is still a gap with users, and we must reflect and improve.
Overall, the graphs suggest this, so
we should take this seriously as a whole and address what we can.
However,
this serialized piece is meant to speak frankly to Gogojungle without sugarcoating,
and I intend to present a harsh critique.
Despitethe “Real account EA operation rate (past 1 month)” graph being created so well,
it feels like it ends at merely “created and finished.”That cannot be denied.
If it’s visualized this much,
it should be easier to take some measures.
Specifically,
the years are long and forward tests are good, so why isn’t it being used?
And if sales volume isn’t significant, why isn’t it selling more?
With the graph visible this clearly, it should be easy to take countermeasures,
but there seems to be little action.
Isn’t that visible in the graph?
Please take some countermeasures.
Well then!
━━━━━━━━━━━━━━━
【Reiwa no Double-IE EA Listing】
https://www.gogojungle.co.jp/users/112481/products
【Reiwa no Double-IE's serialized articles】
■EA Beginner Course
https://www.gogojungle.co.jp/finance/navi/series/1700
■No Sugarcoating! Gogojungle Issue
https://www.gogojungle.co.jp/finance/navi/series/1701
■Double-IE FX Ramblings
https://www.gogojungle.co.jp/finance/navi/series/610
━━━━━━━━━━━━━━━
【Reiwa no Double-IE's Beliefs】
Develop EAs in a principled way,
and earn the love of more people,
maintain a long-lasting WIN-WIN relationship,
and aim to revitalize the EA market and improve literacy.
━━━━━━━━━━━━━━━