

Usage of the “Visualization Indicator” (Part 131)
Usage of "Visualizing Indicator" (Part131)
1. Further develop the "28 Currency Pairs List Indicator" into an indicator
"8CPVisualizing Indicator"to draw NZDUSD.
There are versions of the "8CPVisualizing Indicator" for Oceania, London, New York, and AnyCP. This time, I used the Oceania version.Oceania edition,London edition,NewYork edition,AnyCP edition. This time, I used the Oceania edition.
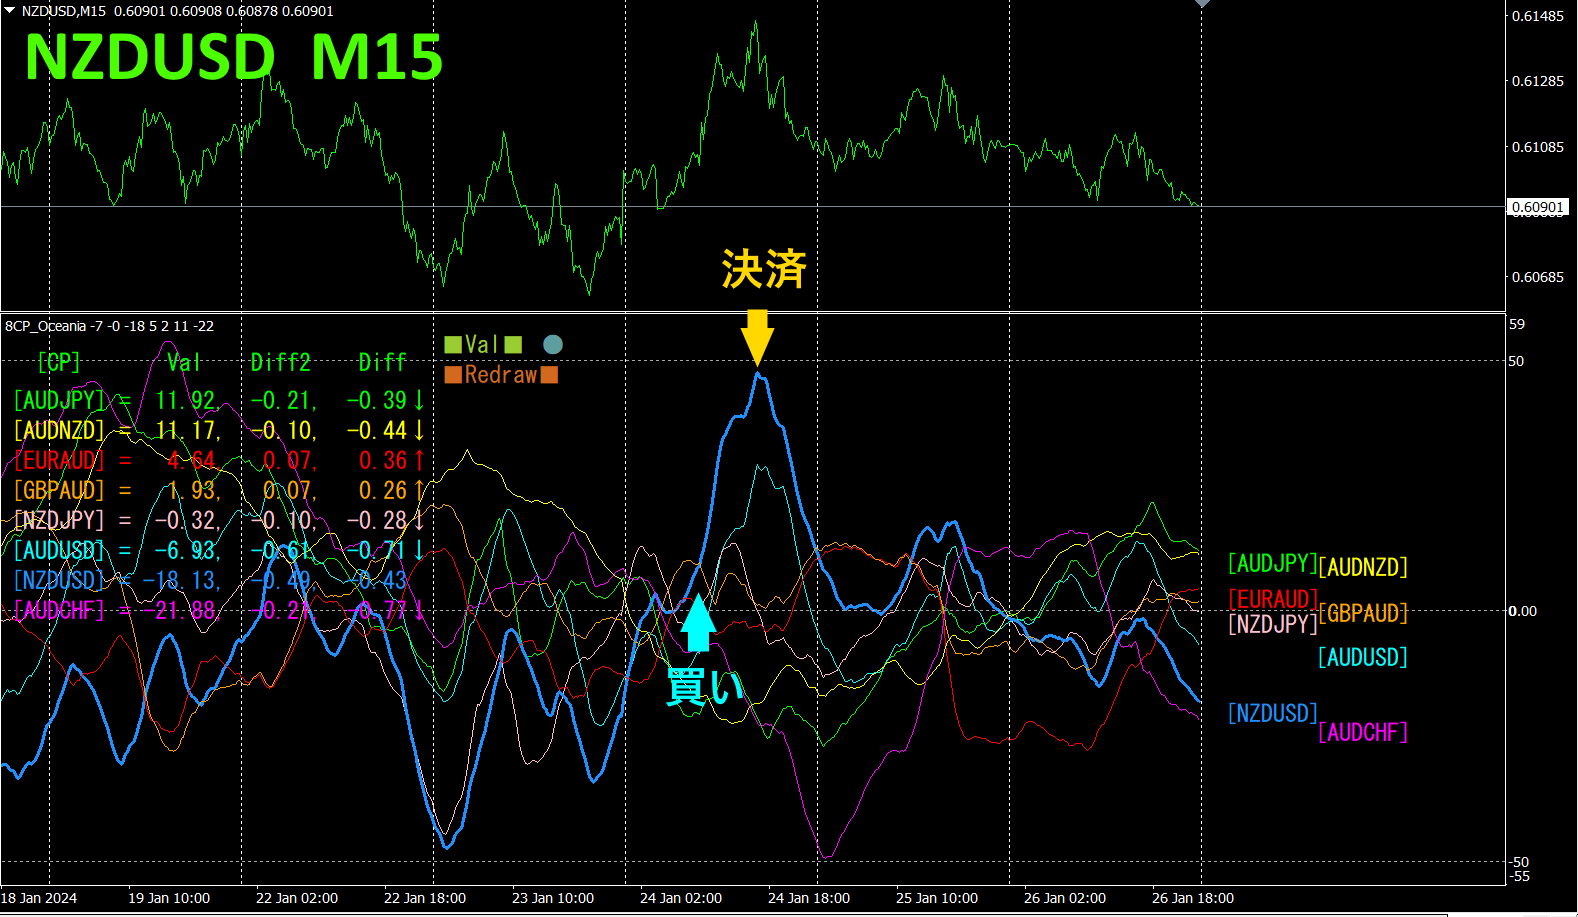
The top half is the 15-minute chart ofNZDUSD. The bottom half is from the “8CPVisualizing Indicator”; the blue thick line graph corresponds toNZDUSD.
On Wednesday,NZDUSD broke above the group of charts, so I entered a buy. I closed when it reversed about five hours later.About46 pips of profitwas earned.
With the "8CPVisualizing Indicator", you can focus on the most active currency pair to trade efficiently.
2. Indicator to try
The diagram below is a screenshot from2024 yearJanuary 23 23:41 () .
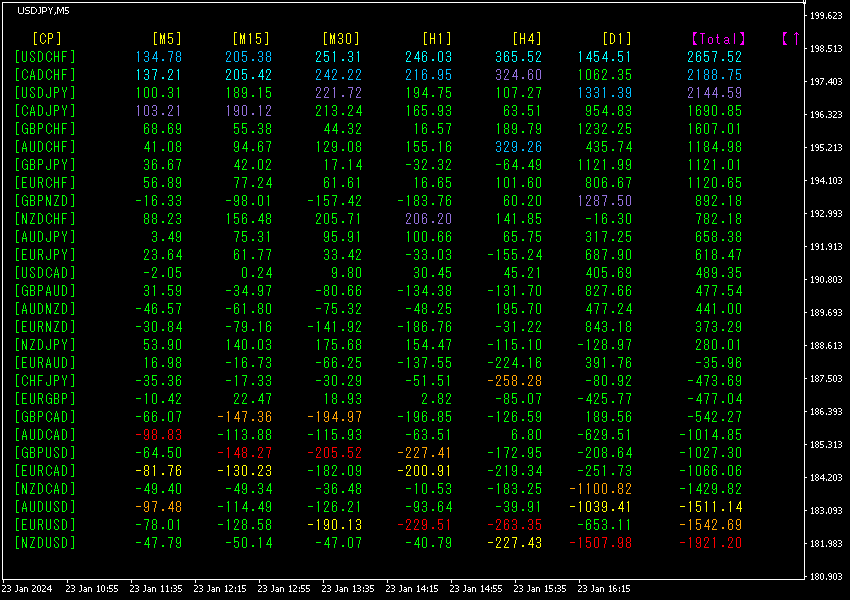
The numbers are arranged in descending order. The top row’sUSDCHF is blue on all timeframes, and theTotal value is2657.52, a large positive figure. indicates an upward trend has formed.
Now, let’s look at theUSDCHF chart.
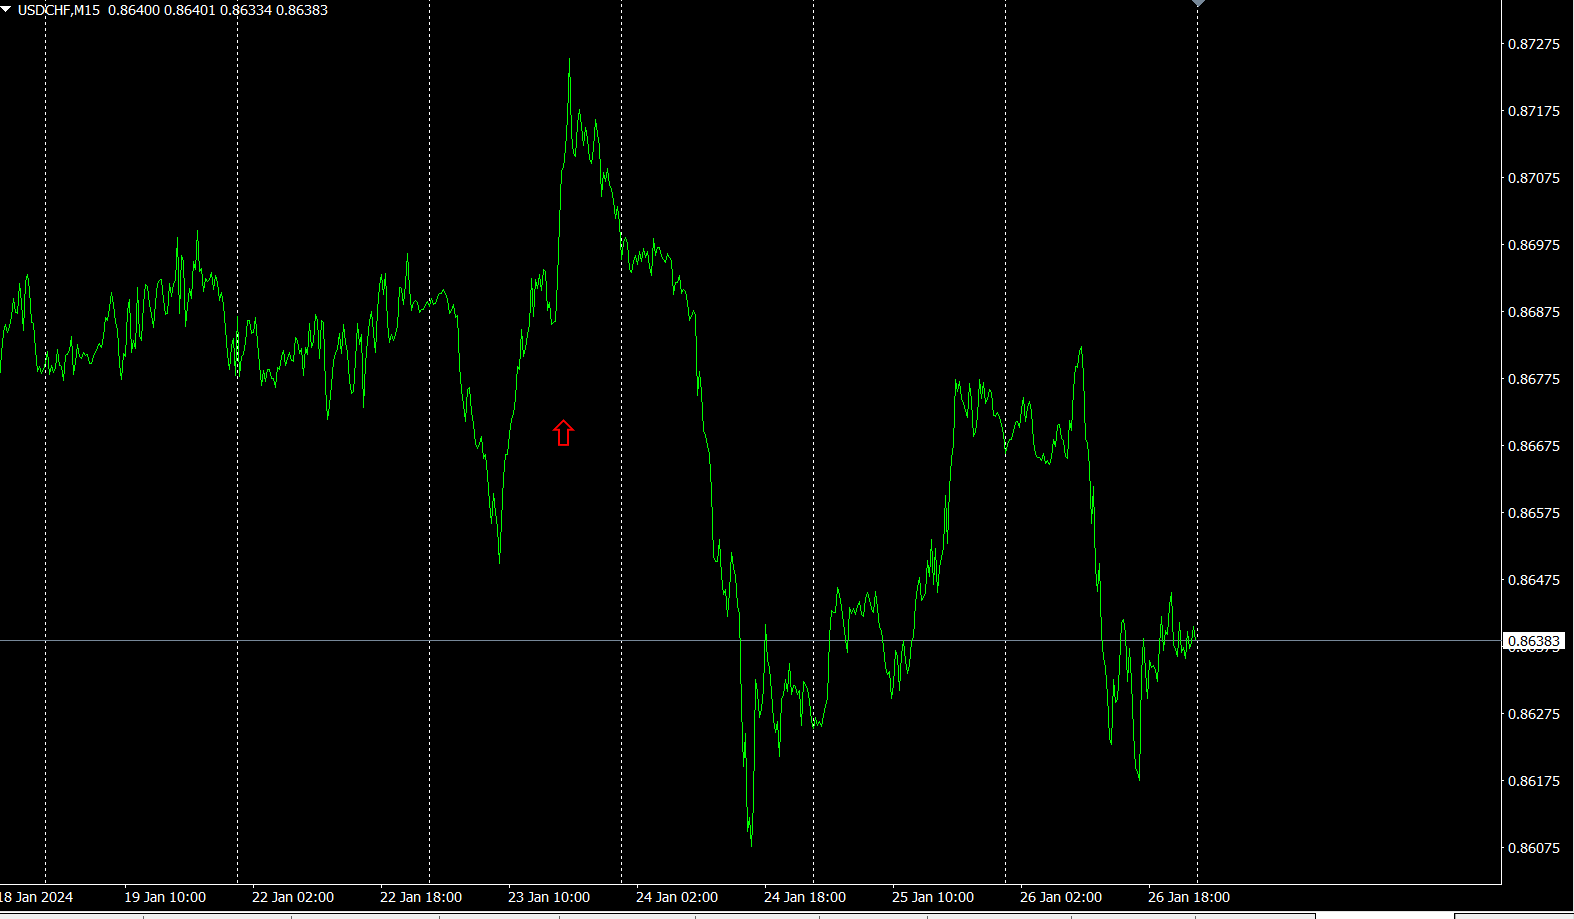
The red arrows mark the capture point of the screenshot. It captures the sharp rise.
"28 currency pairsBest Select Indicator"
"28 currency pairsBest Select Indicator"
https://www.gogojungle.co.jp/tools/indicators/35128

3. 2021Year5 month onward trackingEURJPY
2021 year5 month onward, movement has been tracked.
To view the overall trend, we draw about the last30 minutes over the last3 weeks on a 30-minute chart.
Last time, I wrote as follows.
JPY andEUR are both downwards, butJPY has a steeper slope, so as a result is expected to rise slightly.
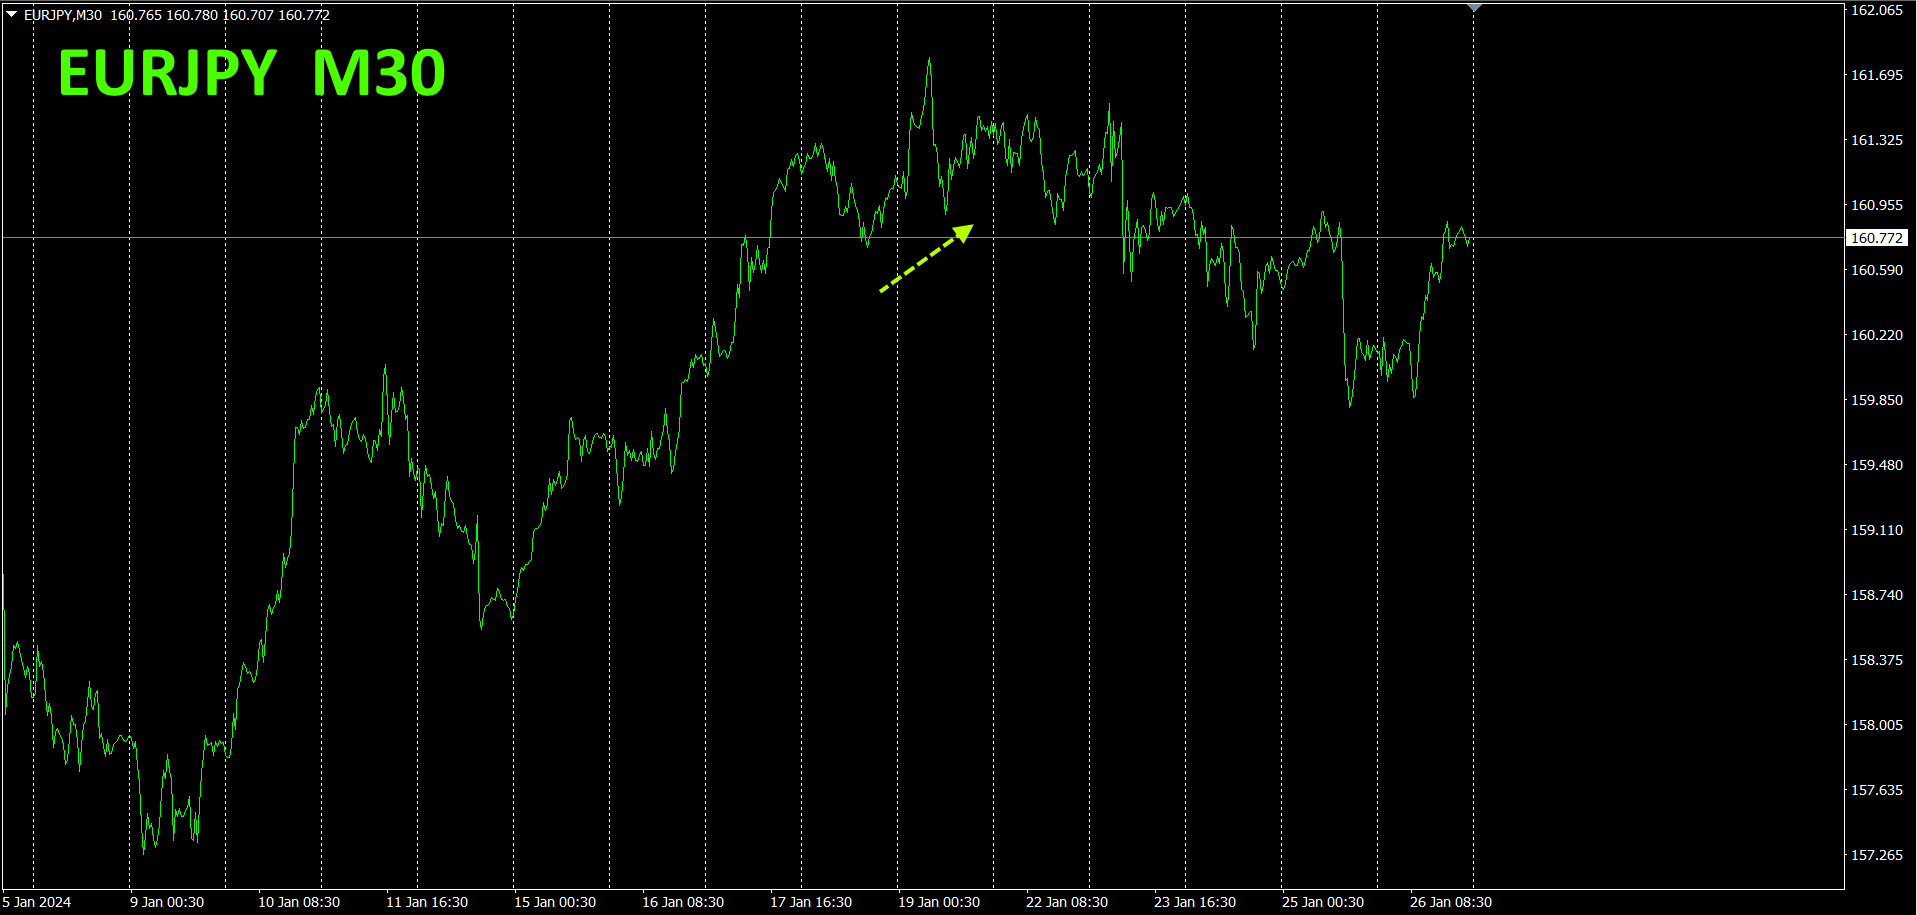
The forecast of a slight rise was incorrect. Since Monday, the currency has become somewhat stronger than the currencyEUR is moving downward.
30-minute currency strength chart.
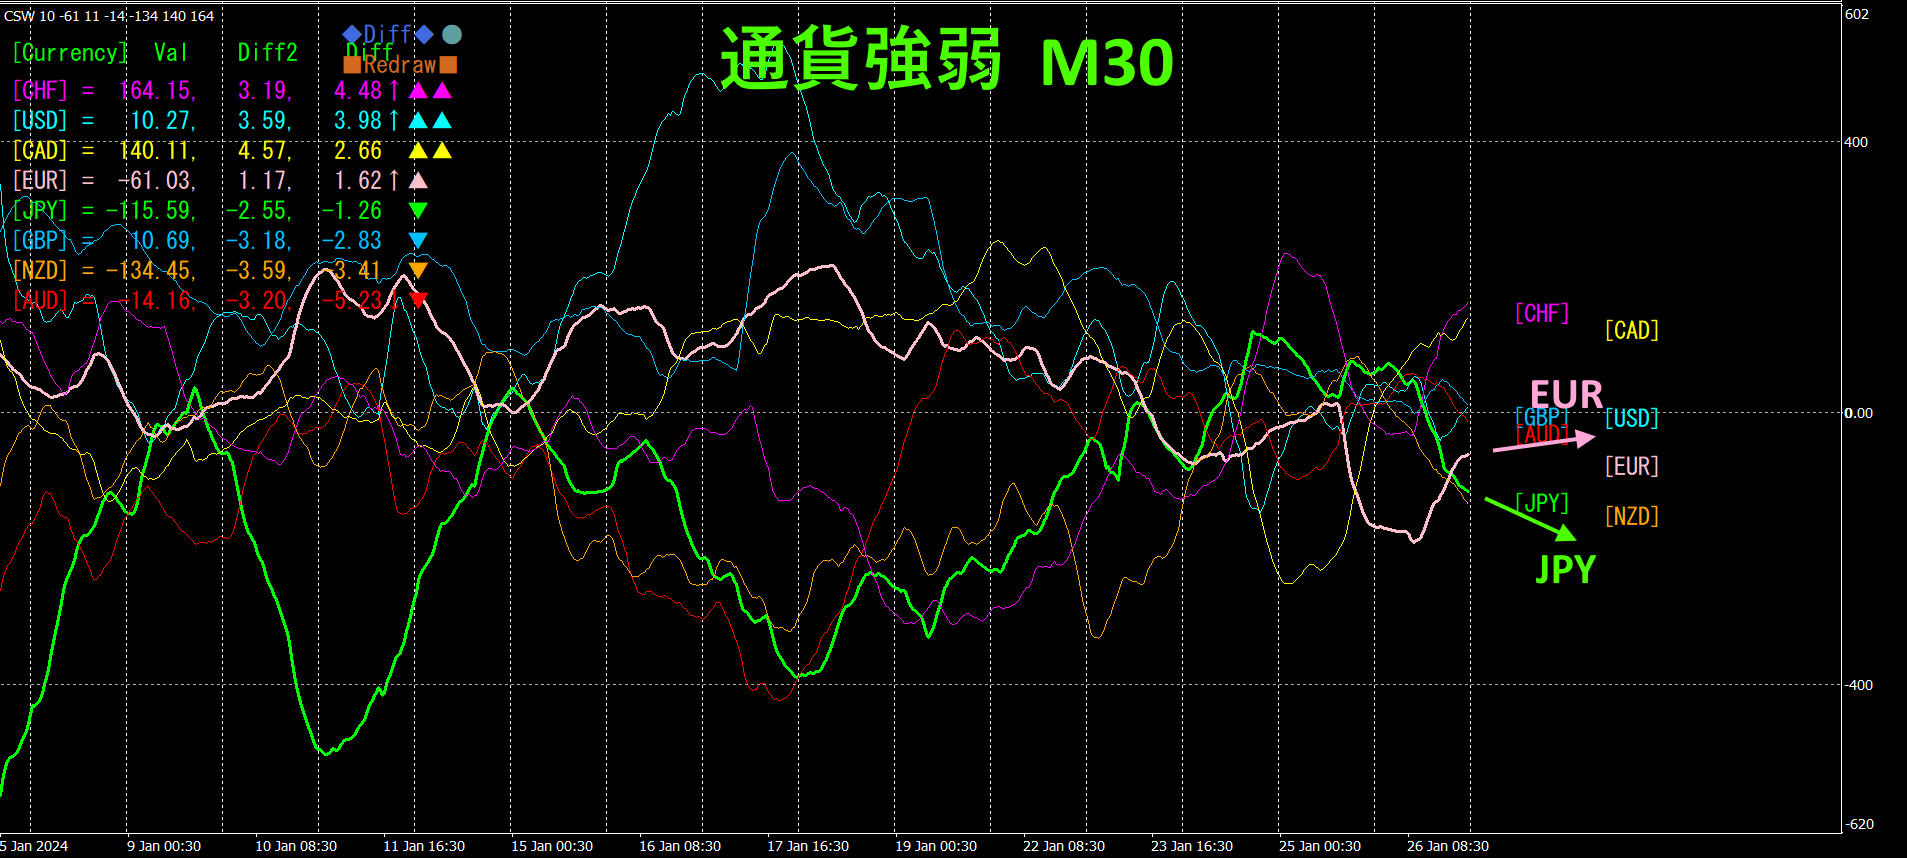
Pink is, green is. is downward, is slightly upward. As a result, is expected to rise slightly.
4. Find the high and low across all currency pairs and build a trend strategy (target isNZDCHF).
2505“Tops and Bottoms Search Indicator” is used to select the currency pair positioned at the bottom asNZDCHF. We are aiming for a rebound from the bottom.
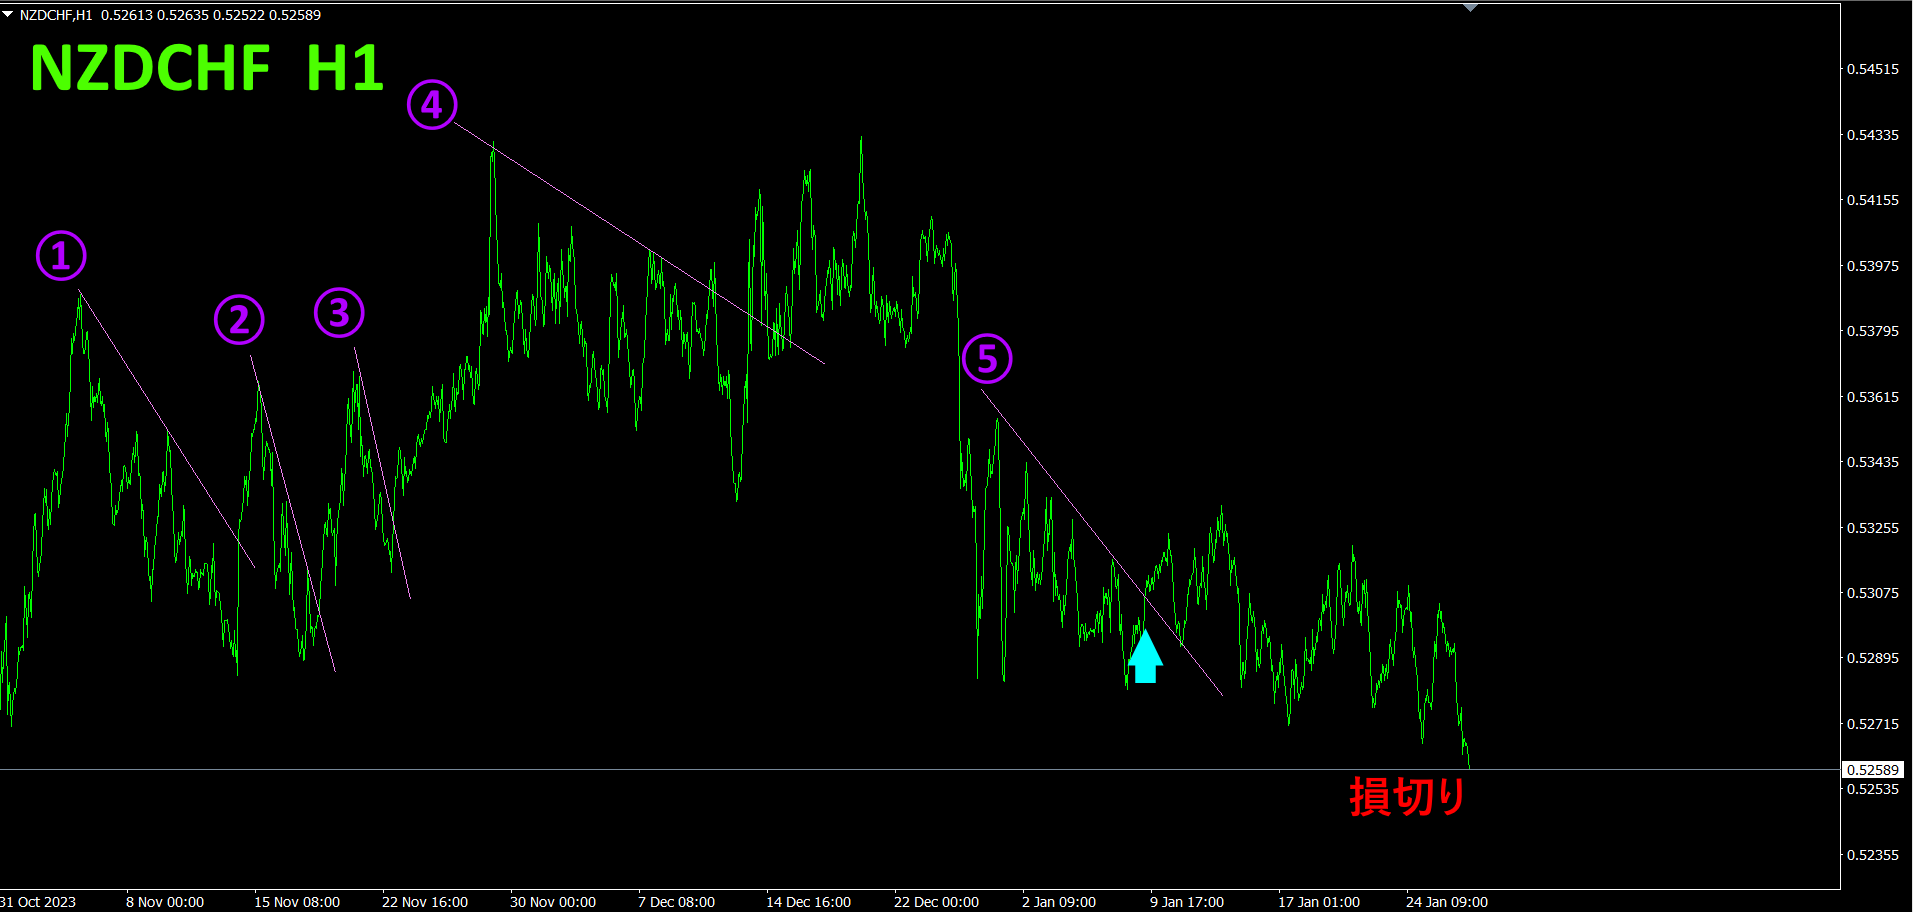
When cuts ①, ②, ③, ④ lines are broken upward, we buy, and when the rising trend line is broken downward, we close. We did this repeatedly: ① for, ② for, ③ for, totaling in profit. Since ④ declined, we closed at the built-in price.
⑤ broke above the cut-down line, so I entered a buy at the position of the light blue arrow, but it continued to fall, so I stopped out.
Refer to the 4-hour currency strength chart.
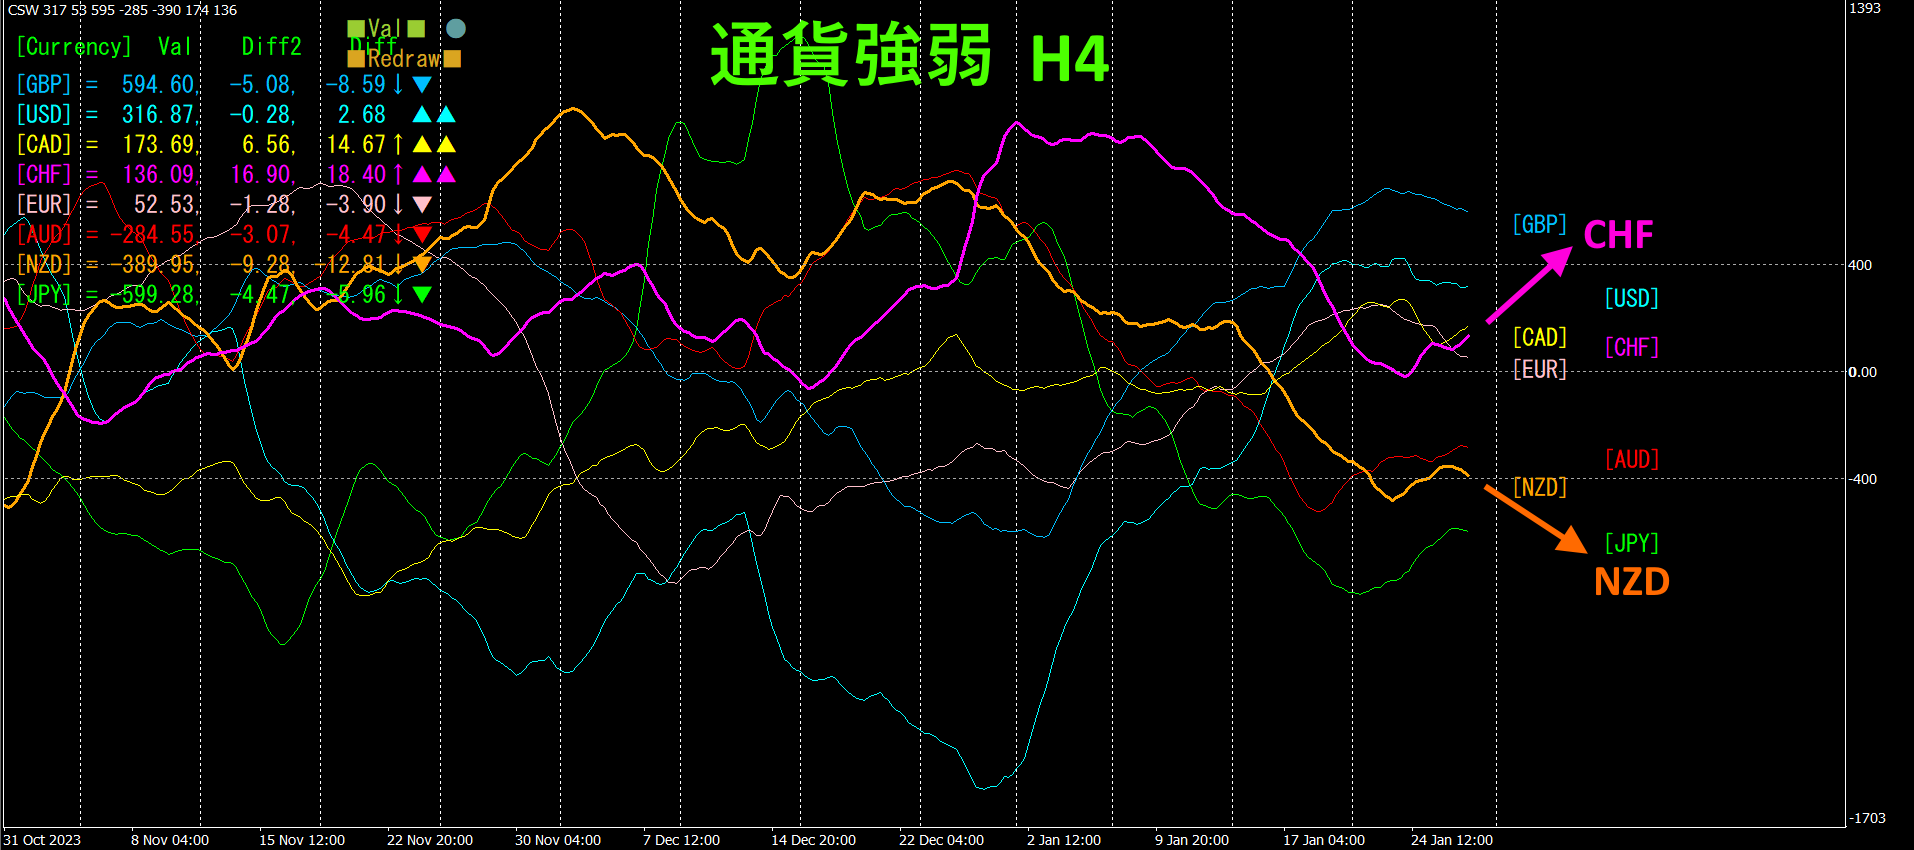
Red-purple represents, orange represents. is upward, is downward. Therefore,
By comparing a normal chart with a currency strength chart simultaneously, the direction of the trend becomes “visible.”
With a semi-automatic, the “” allows you to draw a diagonal downward line, and if it breaks upward you automatically buy, and if the rising line is broken you automatically close—hands-off trading.
※“”

https://www.gogojungle.co.jp/tools/indicators/42257
“8CCurrency Strength Visualization Indicator
MT4 version https://www.gogojungle.co.jp/tools/indicators/39150
MT5 version https://www.gogojungle.co.jp/tools/indicators/39159
【Items I have for sale】


