
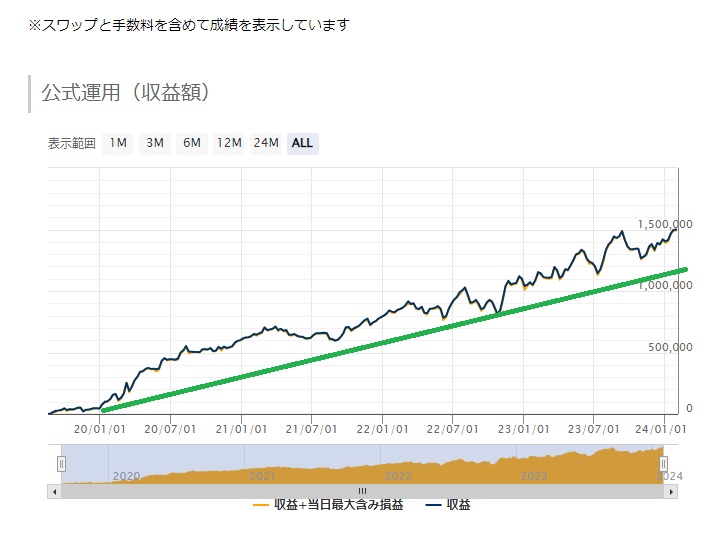
4/9 (Tue) I drew a trend line on the profit and loss chart
This is EA developer Reiwa's Double-Eye.
Today
“Drawing a line on the profit and loss chart”
is the topic.
(Utility Playerfrom the measurement forward)
For example, you can do it like this,
and draw what is commonly called a “trend line.”
Then,
when the P/L approaches this line,
you begin to operate as if “picking up dips,”
and the result may be that you tend to win more easily.
Also,
if you move too far away from the trend line, deviating from it,
it tends to converge back to the original trend line,
in other words, it tends to converge to the original EA performance,
so you might consider not operating in those areas.
Please treat this as one idea to参考.
Let’s go!
━━━━━━━━━━━━━━━
【Reiwa's Double-Eye EA Listing】
https://www.gogojungle.co.jp/users/112481/products
━━━━━━━━━━━━━━━
【Reiwa's Double-Eye Series Articles】
■EA Beginner Course
https://www.gogojungle.co.jp/finance/navi/series/1700
About “How to calculate EA risk management,”
https://www.gogojungle.co.jp/finance/navi/articles/64703
https://www.gogojungle.co.jp/finance/navi/articles/64738
■No Bias! GoGoJungle Issue!
https://www.gogojungle.co.jp/finance/navi/series/1701
https://www.gogojungle.co.jp/finance/navi/articles/64723
■Double-Eye FX Talks
https://www.gogojungle.co.jp/finance/navi/series/610
【Reiwa's Double-Eye Belief】
Develop EA with a straightforward method,
gain the trust of more people,
and maintain a long-term WIN-WIN relationship,
with the aim of revitalizing the EA market and improving literacy.
━━━━━━━━━━━━━━━