
Methods of arbitrage in tools
Today USD/JPY is in a range on the long-term chart, showing a wait-and-see development.
In that context, when the Tokyo market opened, a selling signal appeared fairly early on the 5-minute chart, and about 15–20 pips had already moved.
Personally, 20 pips per day is sufficient, so from here I plan to enter only at points I am confident about.
Now, today’s article content is about a reversal-taking method using this tool.
This method is not described in the tool’s manual.
The reason is that this tool is fundamentally a trend-following method, and reversal-taking is closer to a counter-trend approach, so I decided not to include it for beginners to first master trend-following and then, after achieving stable profitability, try it.
Anyway, what is reversal-taking? In short, it means taking the rebound.
In FX terms, when there is a one-sided rise (or fall), take the rebound, i.e., take the opposing move (fall or rise).
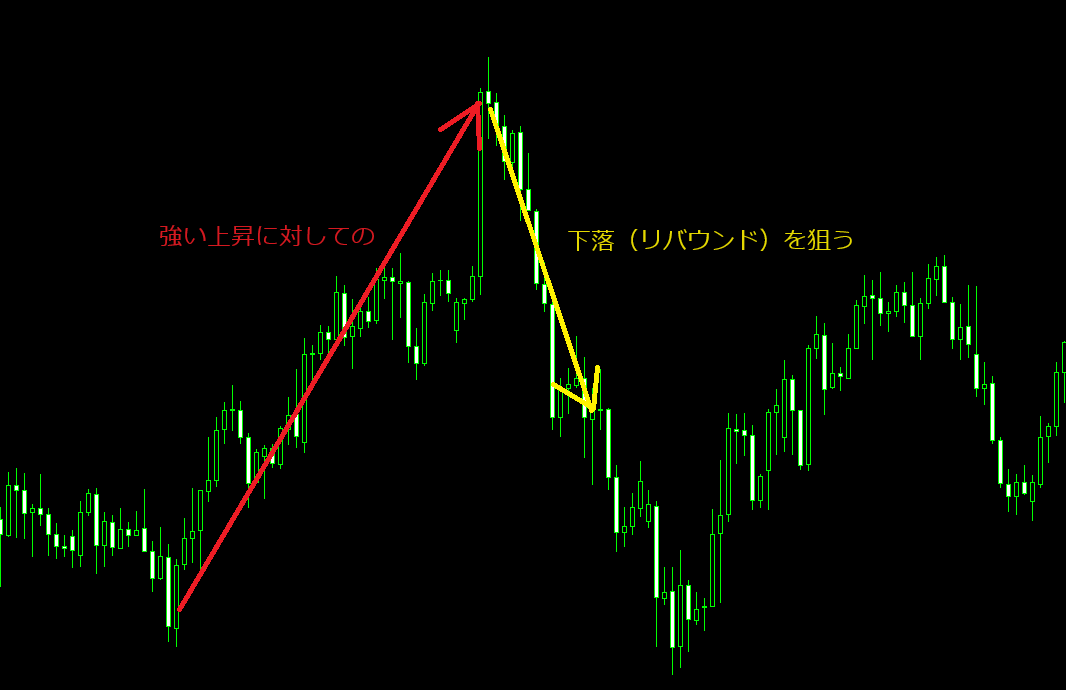
The visual is something like this.
And in the tool,
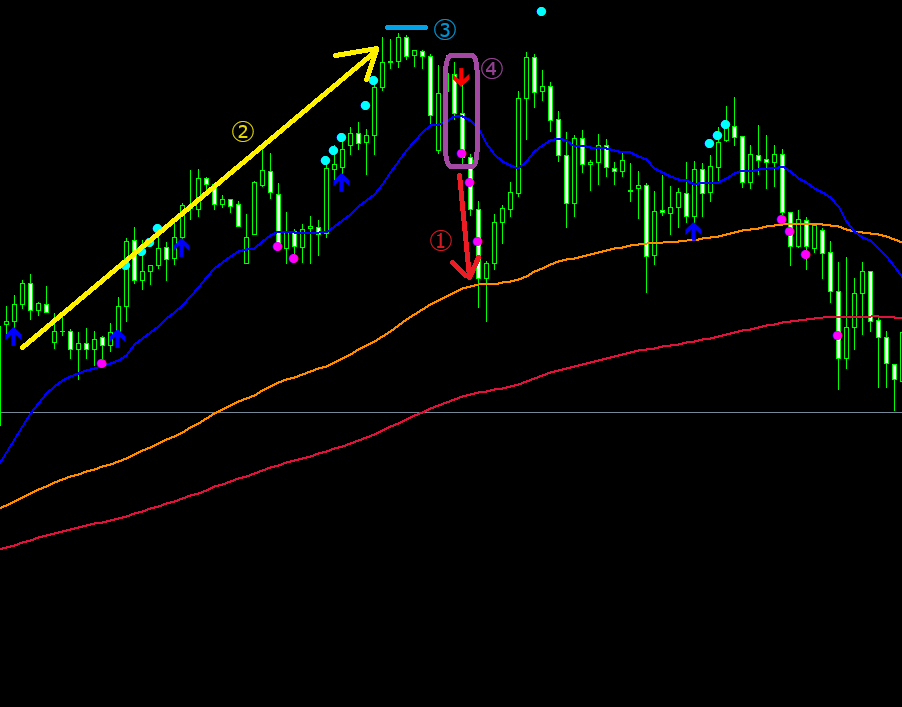
the candlestick is confirmed and a short entry is made when surrounded by a purple square.
Specifically, we try to capture the range between EMA20 (blue) and EMA100 (orange).
When aiming for reversal-taking with the tool, several conditions are set.
Please look at the parts labeled with numbers in the diagram.
① There is a meaningful price range from the close of the foot where the condition is confirmed (purple □) to the EMA.
In other words, we look at the gap between the EMA100 and the rate.
If this gap is narrow (close to EMA100), the risk-reward becomes poor, so we skip it.
② When aiming for reversal-taking, the recent move should be strong up (or down).
③ The initial stop loss at entry is here.
This must be considered alongside ①, but since this stop is predetermined,
if the gap to EMA100 makes the risk/reward extremely poor,
it is wiser to skip the entry.
④ When aiming for a short, the red arrow and pink ● (long is the blue arrow and light blue ●) should occur on the same foot.
And most importantly, the close must be clearly below EMA20 for a short (or above for a long).
⑤ Do not stretch the profits too much.
Since this trade goes against the big-picture view, it may move quickly in the favorable direction.
⑥ Move the stop to cost price where possible to avoid losing trades.
Although not written in the chart, points ⑤ and ⑥ are part of the guidance.
Now, let’s actually look at a long example.
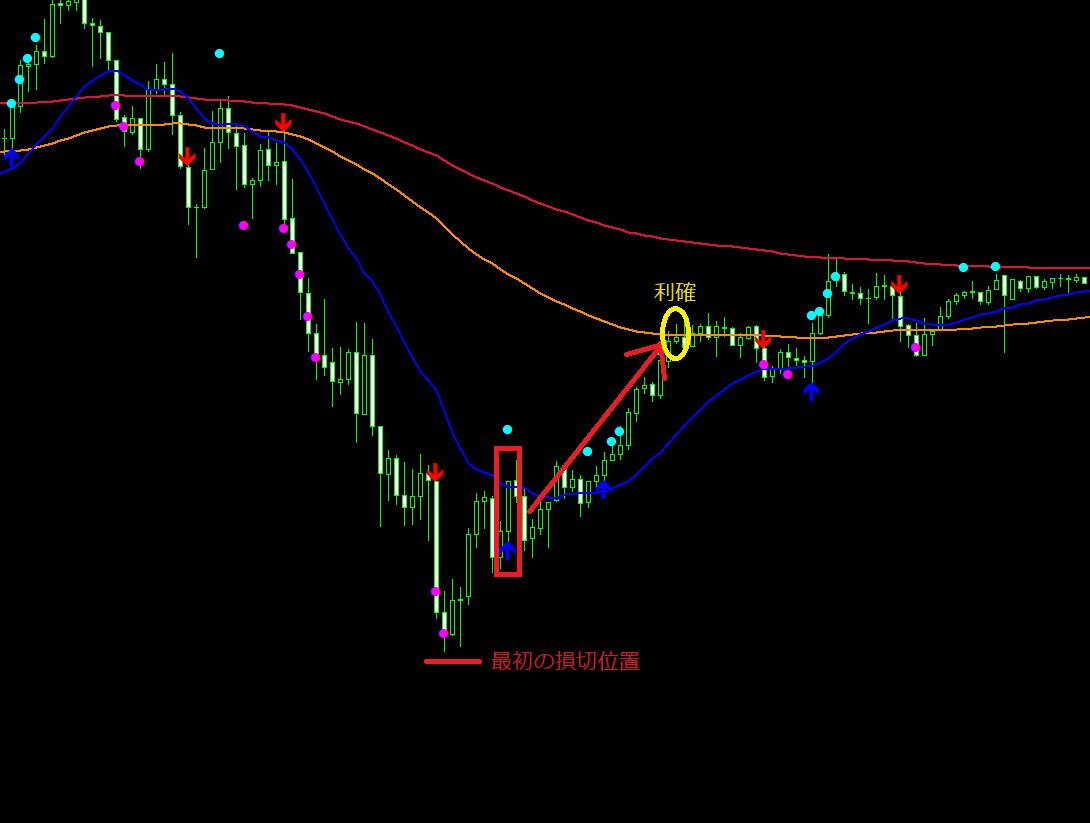
Take a rebound (long) against a strong decline.
The blue arrow and light blue ● indicate the confirmed foot that closes above EMA20.
The range up to EMA100 is sufficient
The initial stop is at the low, and the take-profit is up to EMA100
If appropriate, move the stop to cost price to continue avoiding losing trades
Next is the short.
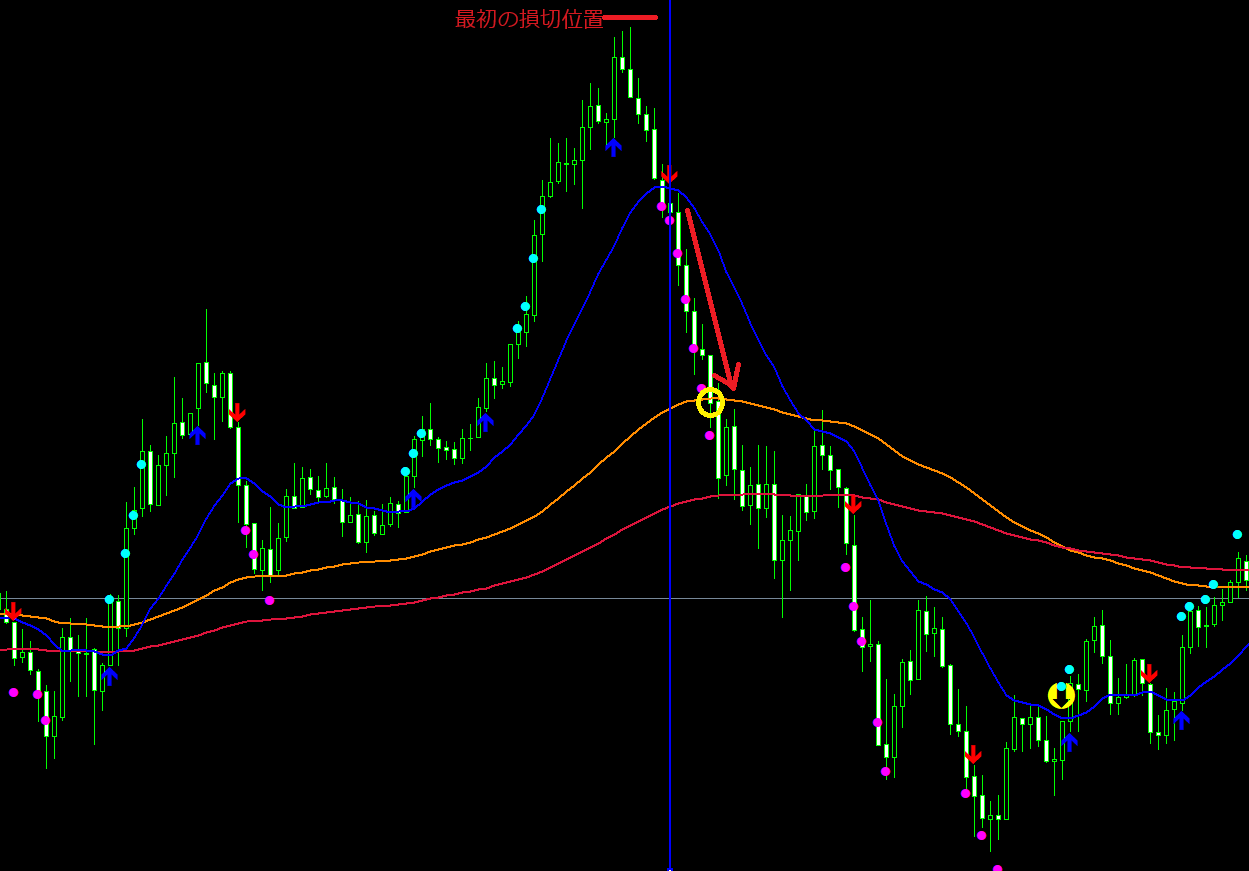
We aim for a decline against a strong rise.
The foot where the red arrow and pink ● occur simultaneously closes below EMA20.
The range up to EMA100 is sufficient
The initial stop is at the high, the take-profit is up to EMA100
If appropriate, move the stop to cost price to continue avoiding losing trades
Next, a method similar to reversal-taking is also introduced.
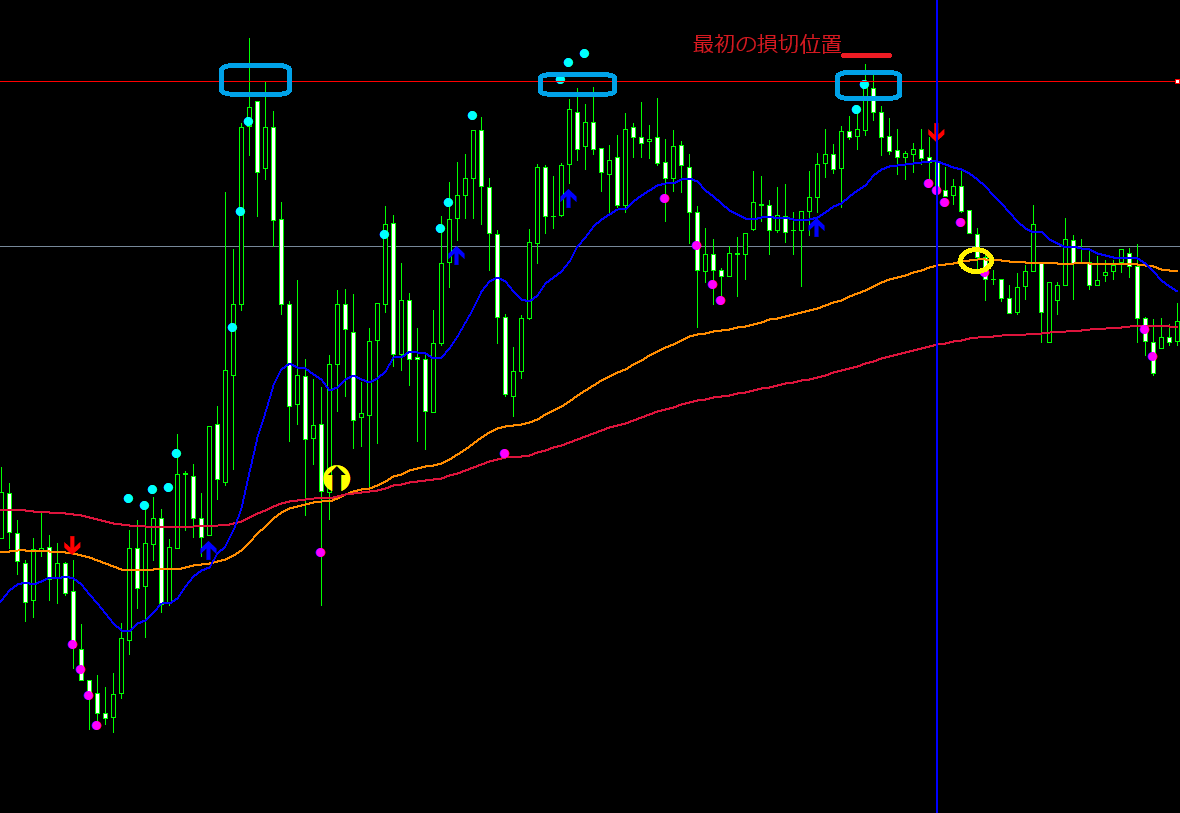
The chart isn’t a strong uptrend, but
the horizontal red line serves as a resistance line.
In the area circled with blue squares, it has been pressed down three times in the past.
In such a case, when the red arrow and pink ● occur under similar conditions as reversal-taking, and the price closes below EMA20 (blue line), as with the foot of the blue vertical line,
even in a ranging market, depending on volatility, a price range can be captured.
[Note Point ①]
The take-profit is until EMA100, but if after entry the price does not move as expected or becomes choppy and the moving average flattens or the candles approach,
the range becomes narrower than the initial take-profit.
If profits are not significant or you are already in a drawdown when EMA100 is reached, a clean stop is better.
[Note Point ②]
Win rate: because this is a counter-trend rather than a trend-following method, it is naturally worse than the trend-following approach.
Manage capital properly by reducing position sizes as needed.
Yes, and now we’ll introduce NG points as well.
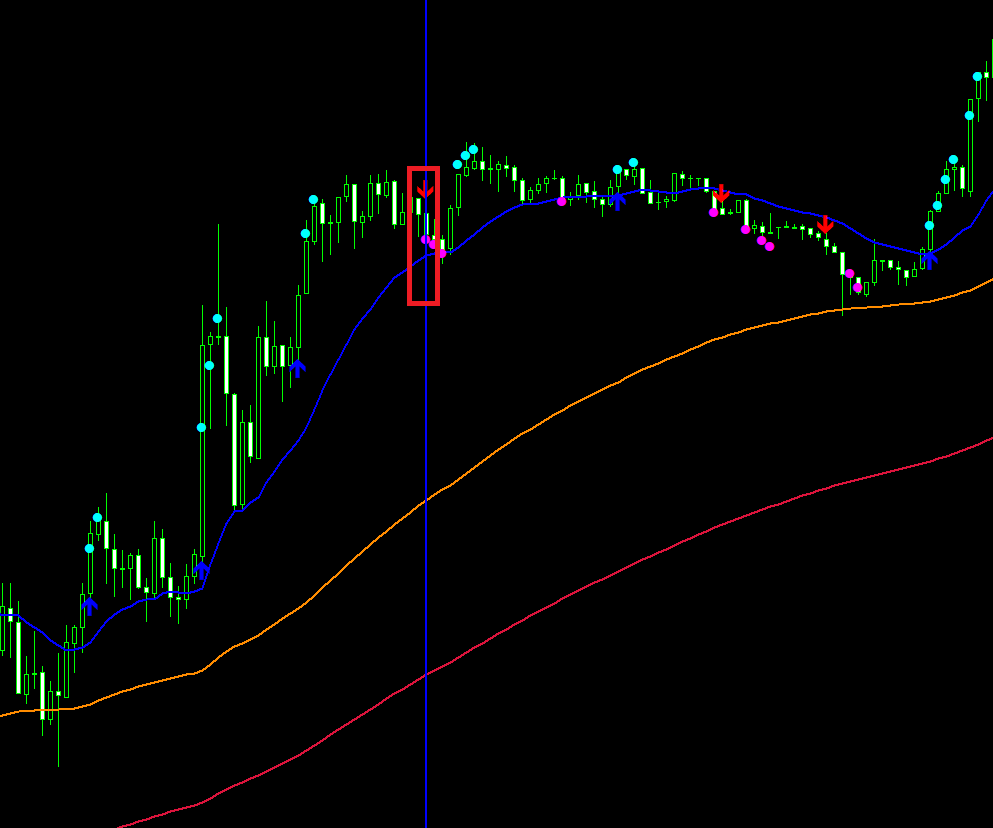
This is NG because EMA20 is not closed below,
unless it truly breaks down, EMA20 may rebound, indicating a simple pullback formation.
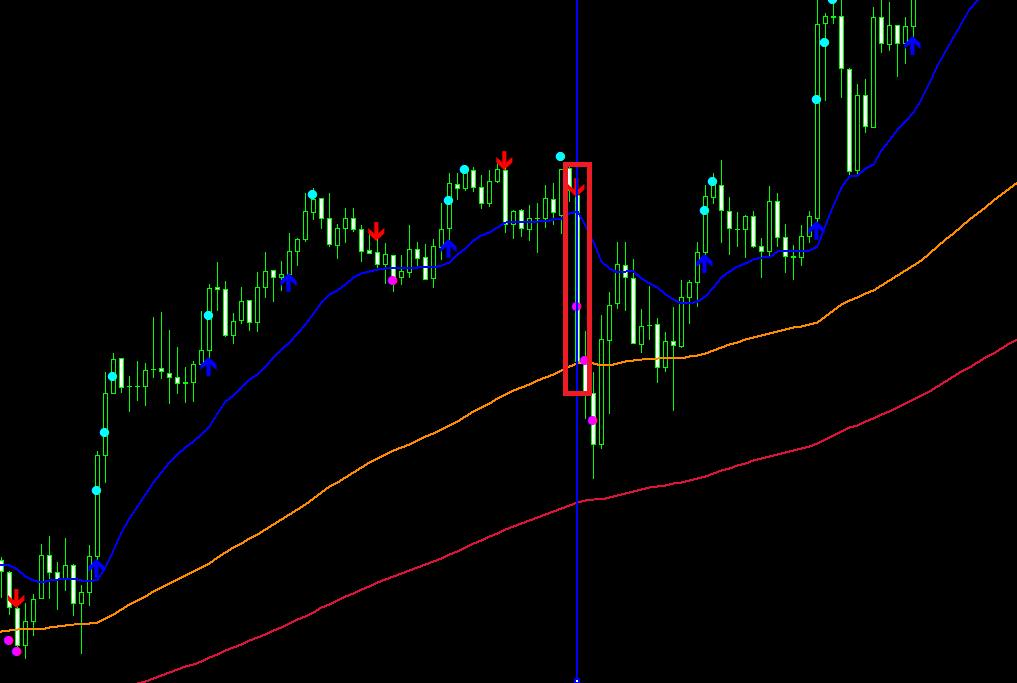
Next?
EMA20 is below, but EMA100 has already been reached.
It’s not a matter of range width; of course it’s NG.
Trying to write too much here would make this quite long...
I hope to continue delivering useful information and methods to everyone.
Thank you for your continued support.