

Utilization of the "Visualization Indicator" (Part 130)
Utilization of the "Visualization Indicator" (part130)
1. Further evolve the "28 Currency Pair List Indicator" into an indicator
“8CPVisualization Indicator”to drawUSDJPY.
The “8CPVisualization Indicator” includesOceania version,London version,NewYork version,AnyCP version. This time, theLondon version was used.
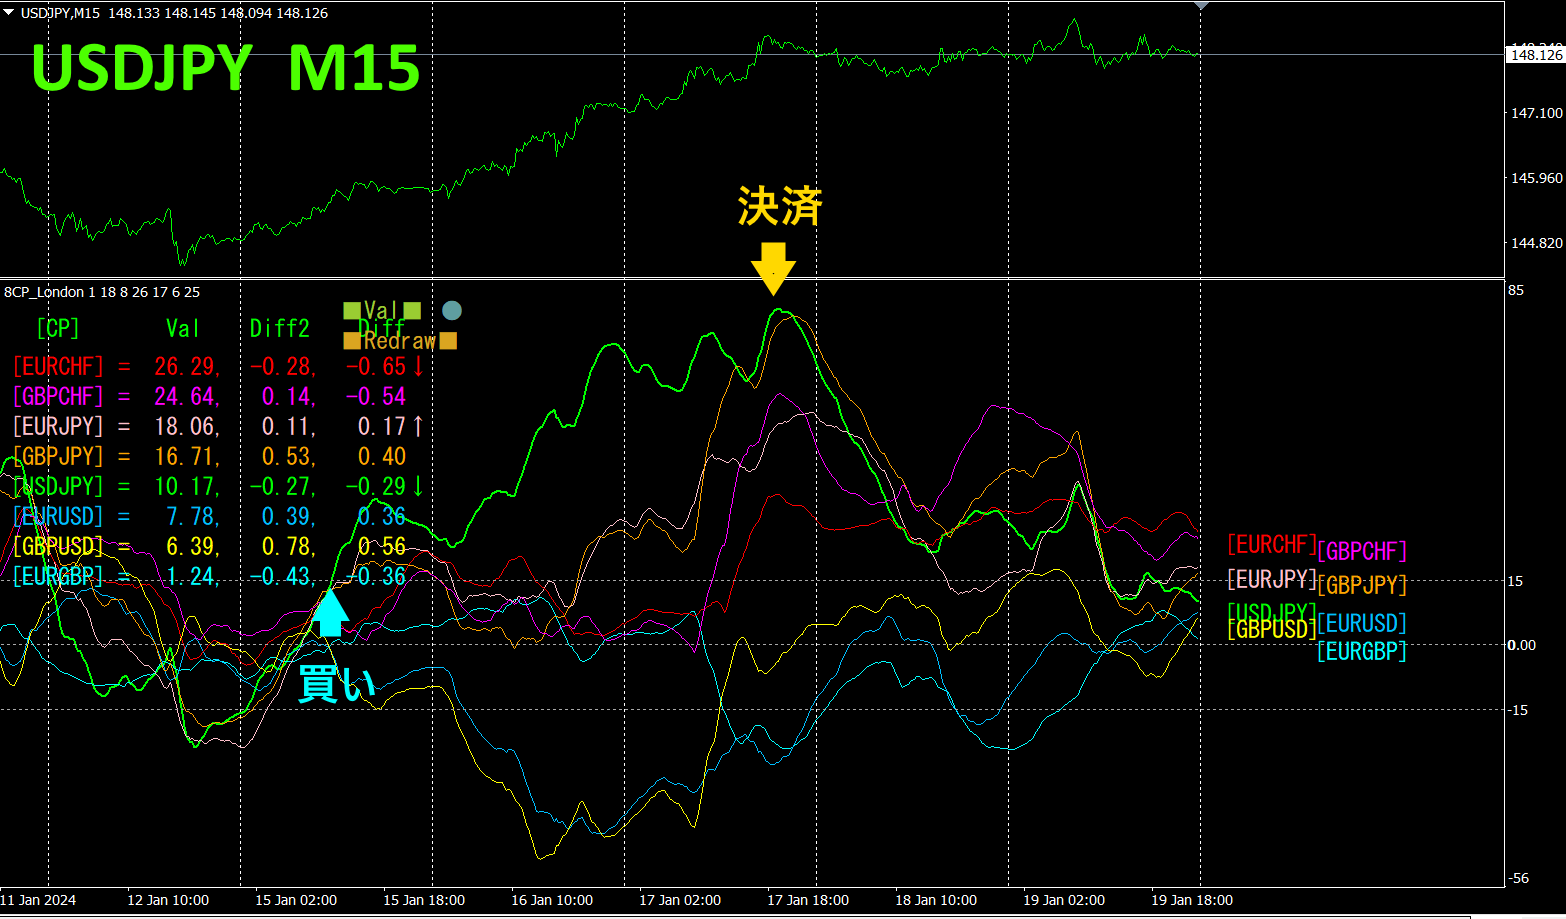
The upper half is a 15-minute chart forUSDJPY. The lower half shows the results from the “8CPVisualization Indicator”; the green thick-line graph corresponds toUSDJPY.
On Monday,USDJPY broke upward through the cluster of graphs, so I entered a buy. I closed the position when it reversed on Wednesday.Profit of about290 pipswas obtained.
GBPJPYandEURJPY show similar behavior. This is because the currencyJPY was relatively weaker than the others. A currency strength chart is shown below.
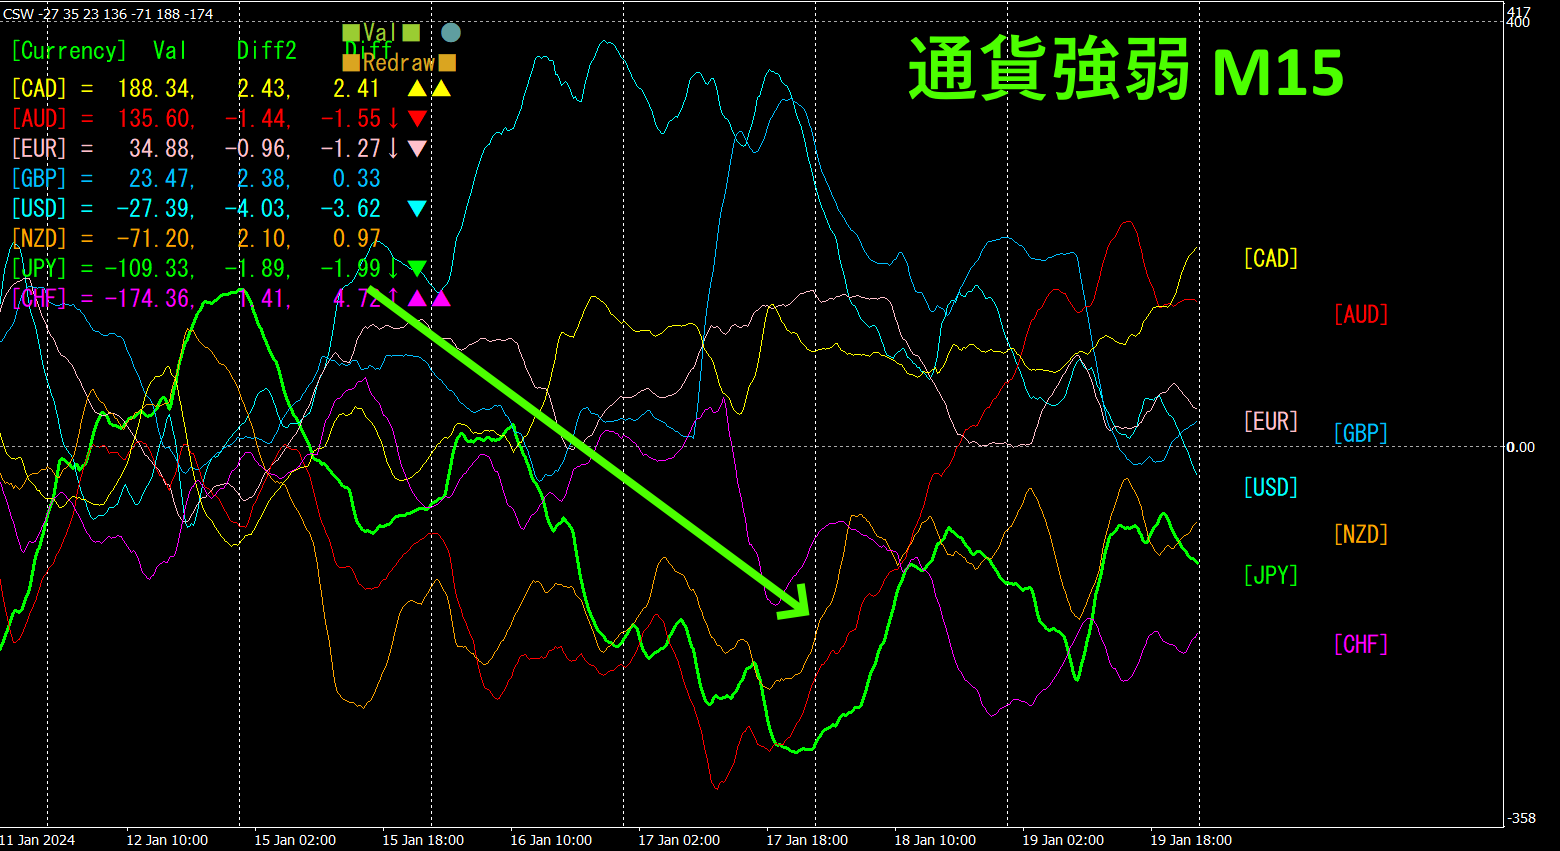
From Monday to Wednesday, the currenciesJPY were weakening.
By using the “8CPVisualization Indicator,” you can focus on the most volatile currency pair, enabling efficient trading. The currency strength chart also reveals the most active currency pair combinations at a glance.
2. Best SelectTry the indicator
The following figure is a screenshot fromJanuary,16,2024,12:41JST).
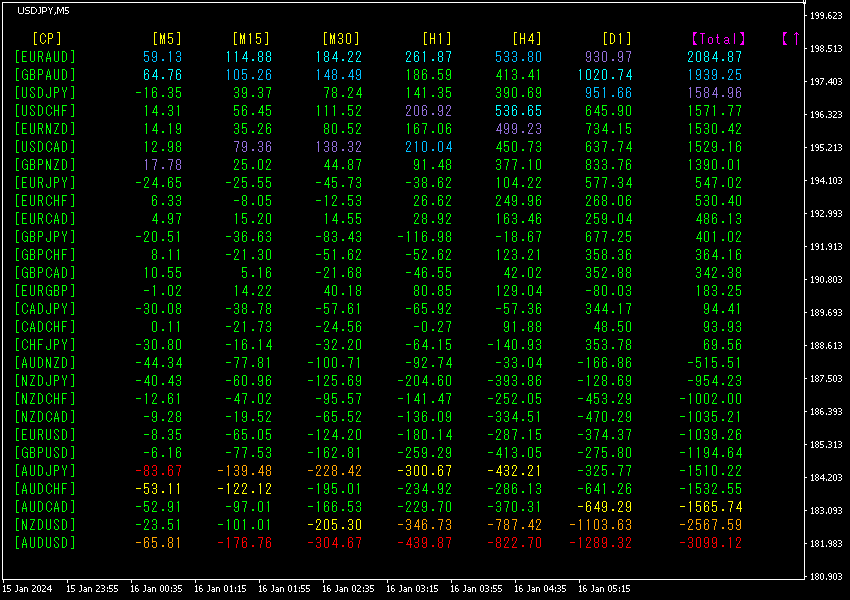
values are sorted in descending order. At the bottommost row,AUDUSD shows red in all timeframes, and theTotal value is-3009.12, a large negative figure. indicates a downtrend is occurring.
Now, let’s look at the AUDUSD chart.
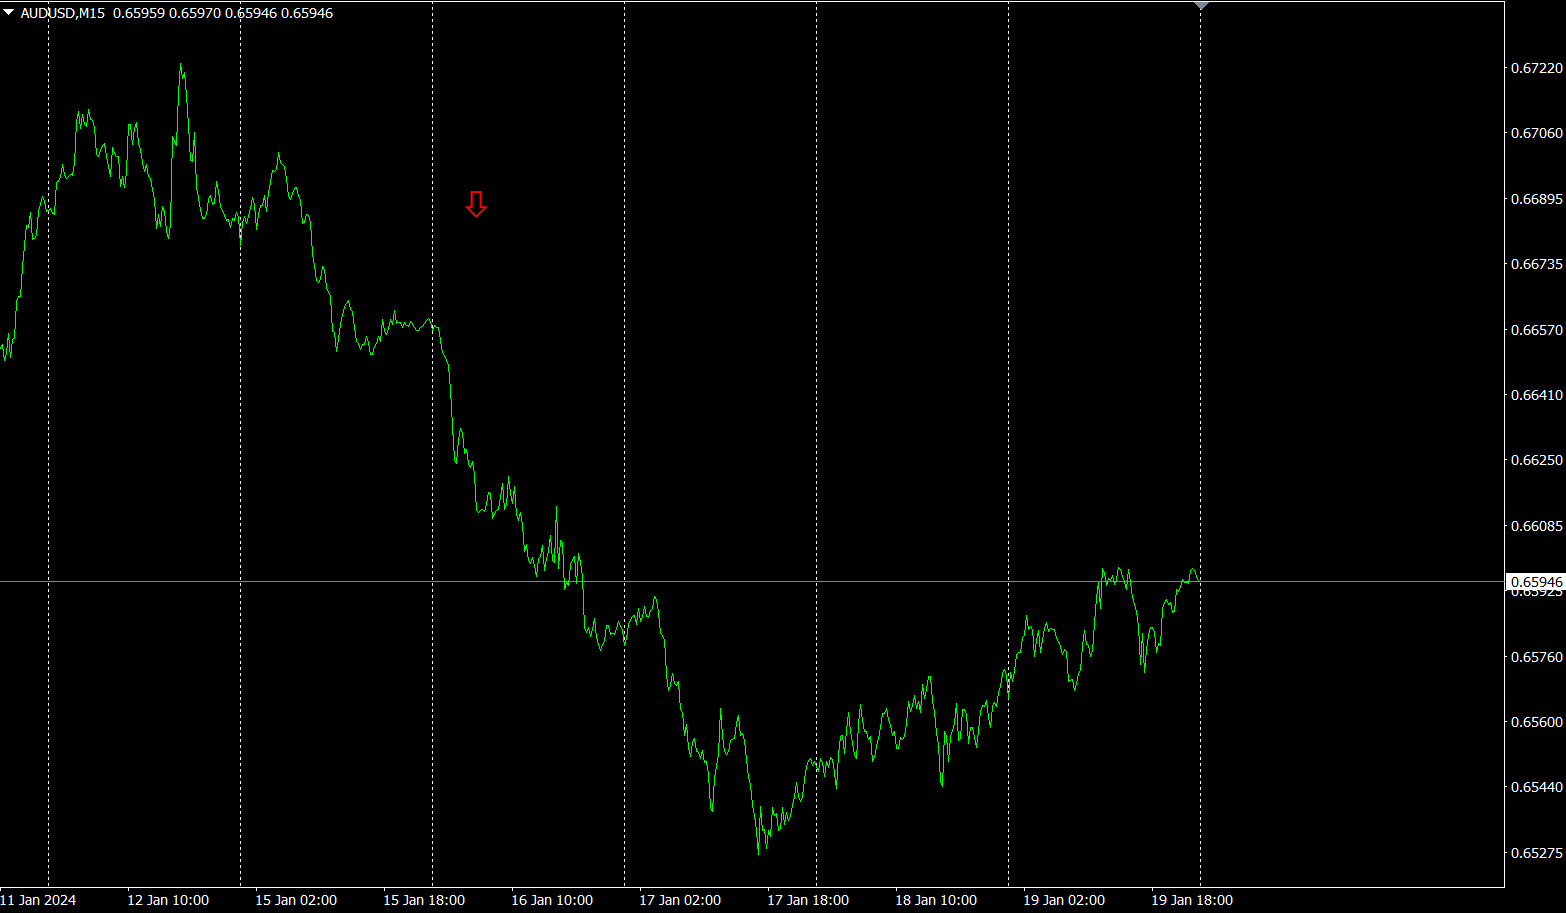
The red arrows mark the captured screenshot. It catches a sharp drop.
“28 currency pairs Best Select can easily identify which currency has the strongest trend among the 28 pairs. It also tells you, with numbers and colors, whether you should trade now. It offers a quick, overall view of all currency pairs.
“28 currency pairs Best Select indicator”
https://www.gogojungle.co.jp/tools/indicators/35128

3. 2021 year5 month to presentEURJPY movement
2021 year5 month onwardEURJPY movement.
To view the overall trend, I have drawn about the last30 minutes for the past3 weeks.
Previously I wrote as follows.
JPY rising,EUR is expected to decline slightly.
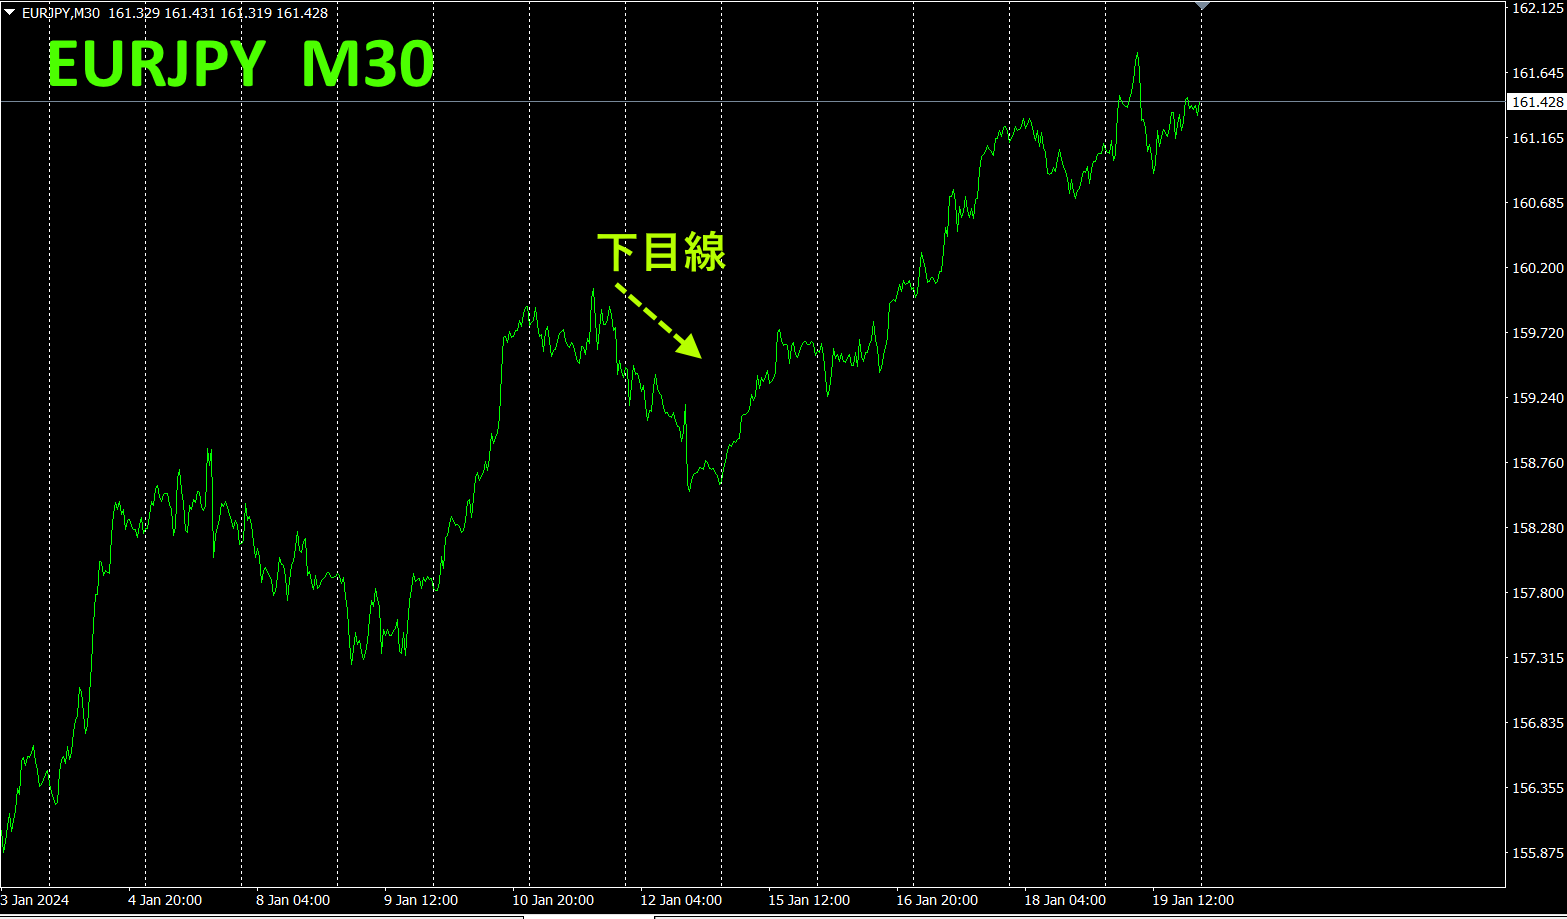
The forecast of a slight decline did not materialize. Because the currency weakened, rose. Overall, it is in an upward trend with a right-shoulder upward slope; in the short term it may dip, but long-term it is rising.
minutes, currency strength chart.
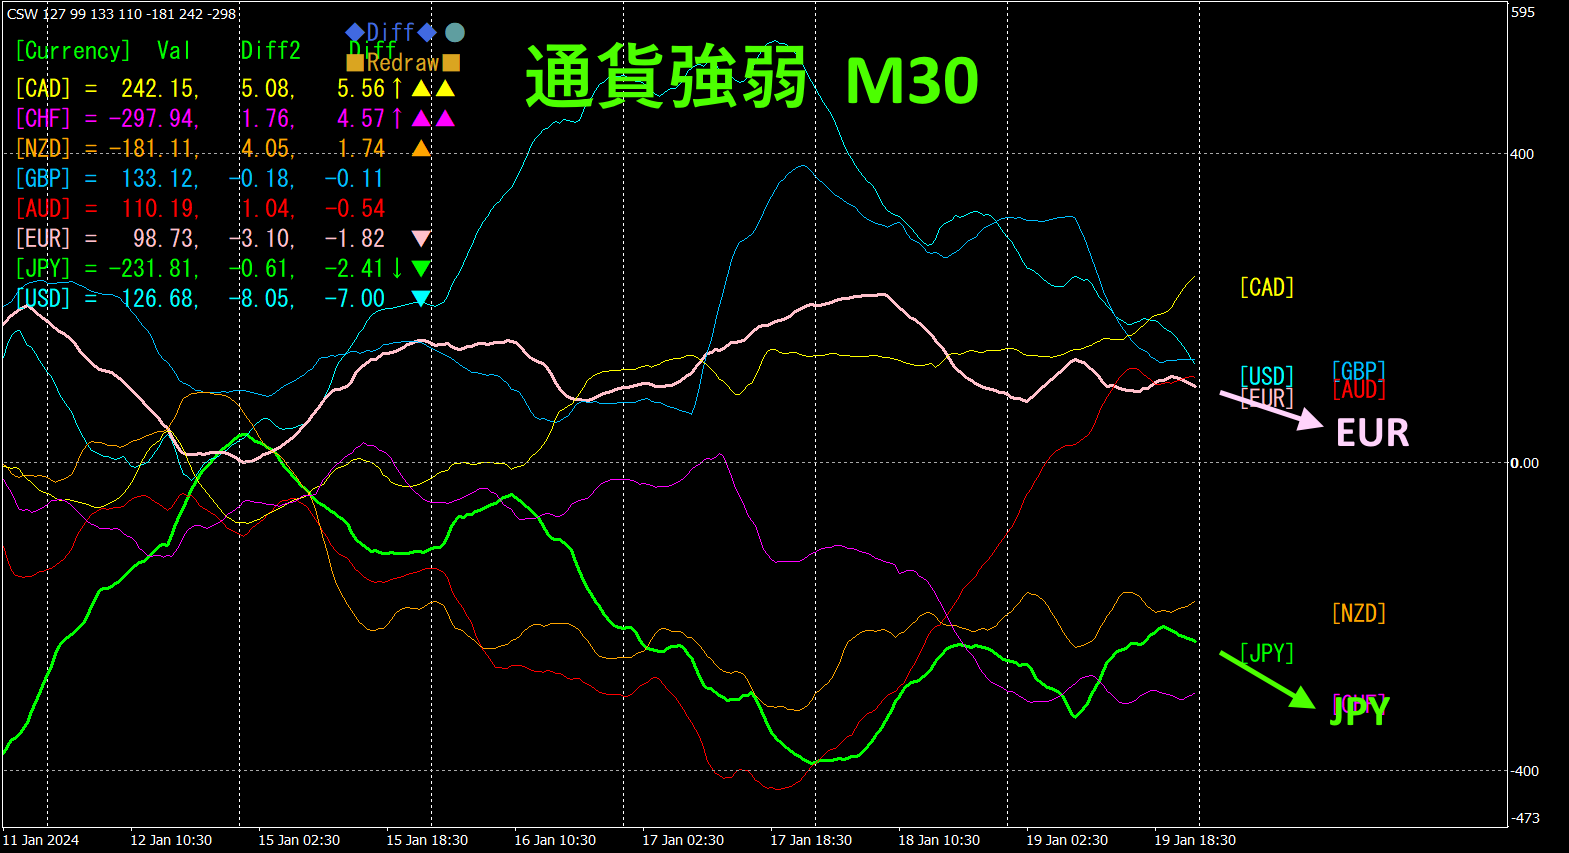
Pink is, green is. and are both downward, but since the slope ofJPYEURJPY tends to rise slightly.
4. Search for tops and bottoms among all currency pairs and build a trend strategy (target:).
2505“Top and Bottom Search indicator”, I selected the currency pair at the bottom asNZDCHF. I am aiming for a rise from the bottom.
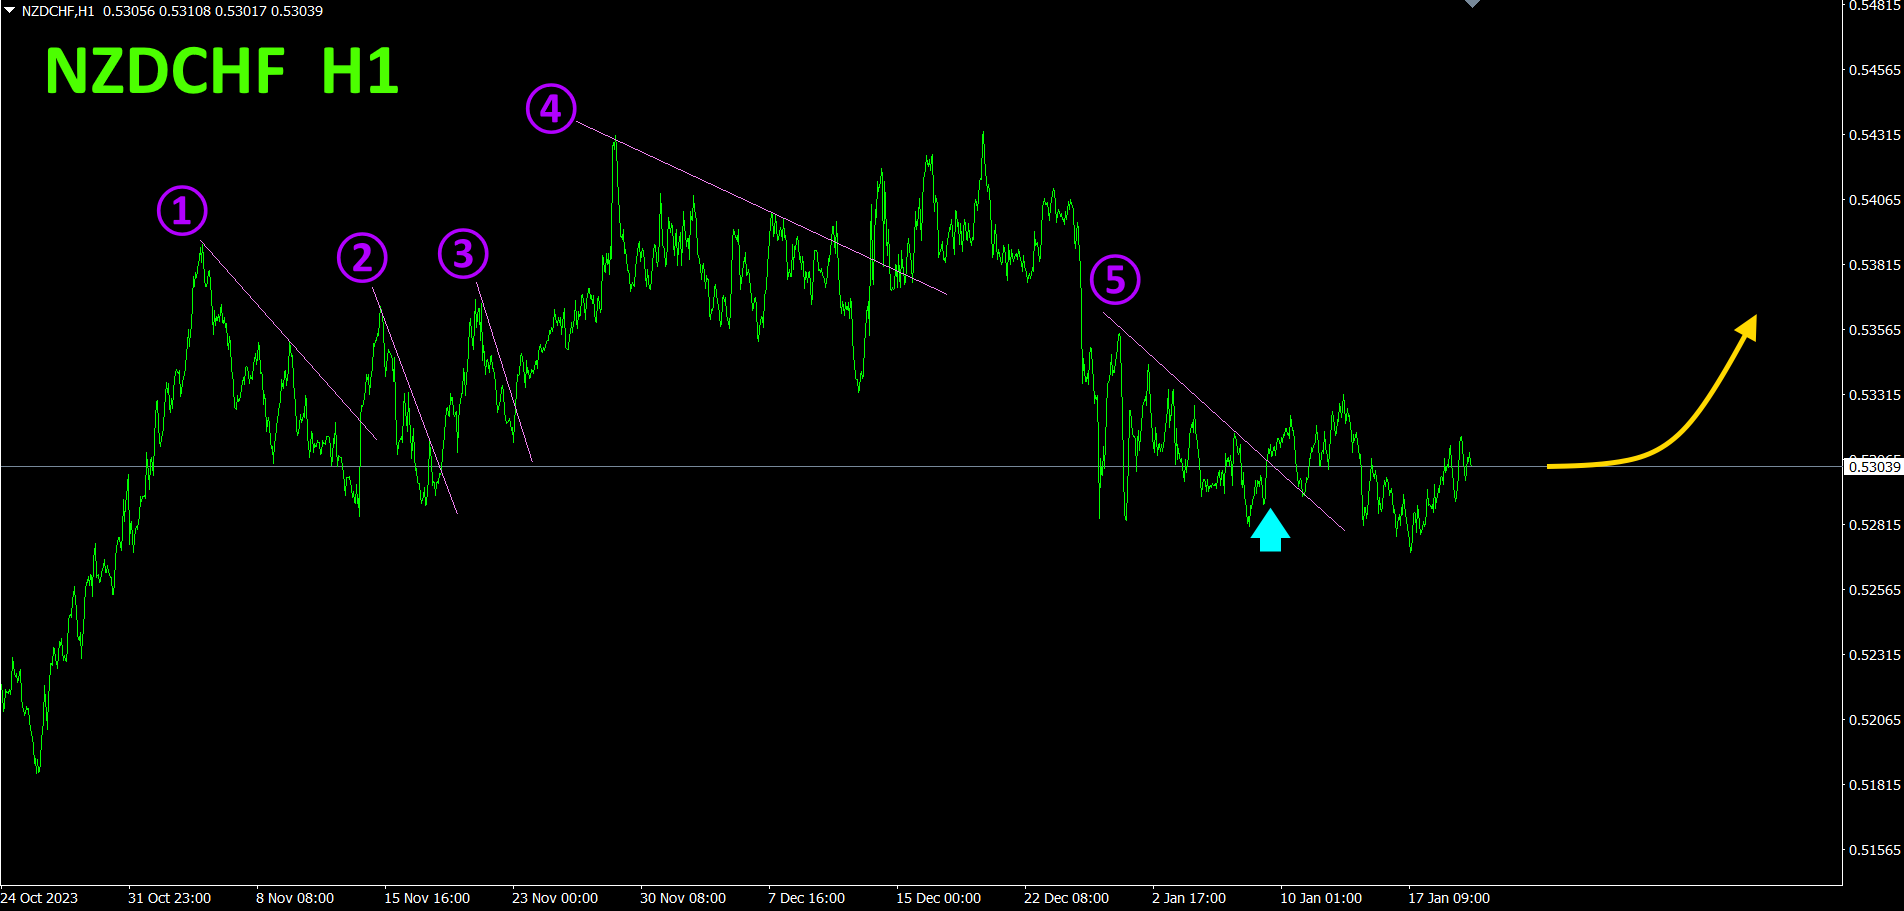
I bought when lines ①, ②, ③, ④ were broken upward, and closed when the rising trend line was broken downward. ① yielded, ② yielded, ③ yielded, for a total of profit. Position ④ declined, so I closed at entry price.
⑤ was drawn as a downsloping line, but when it broke above this line, I entered a buy.
The situation is not much different from last week. Currently, is relatively stronger than, so it is slow to rise, but I am waiting for it to move up as shown by the yellow arrow.
Refer to the 4-hour currency strength chart.
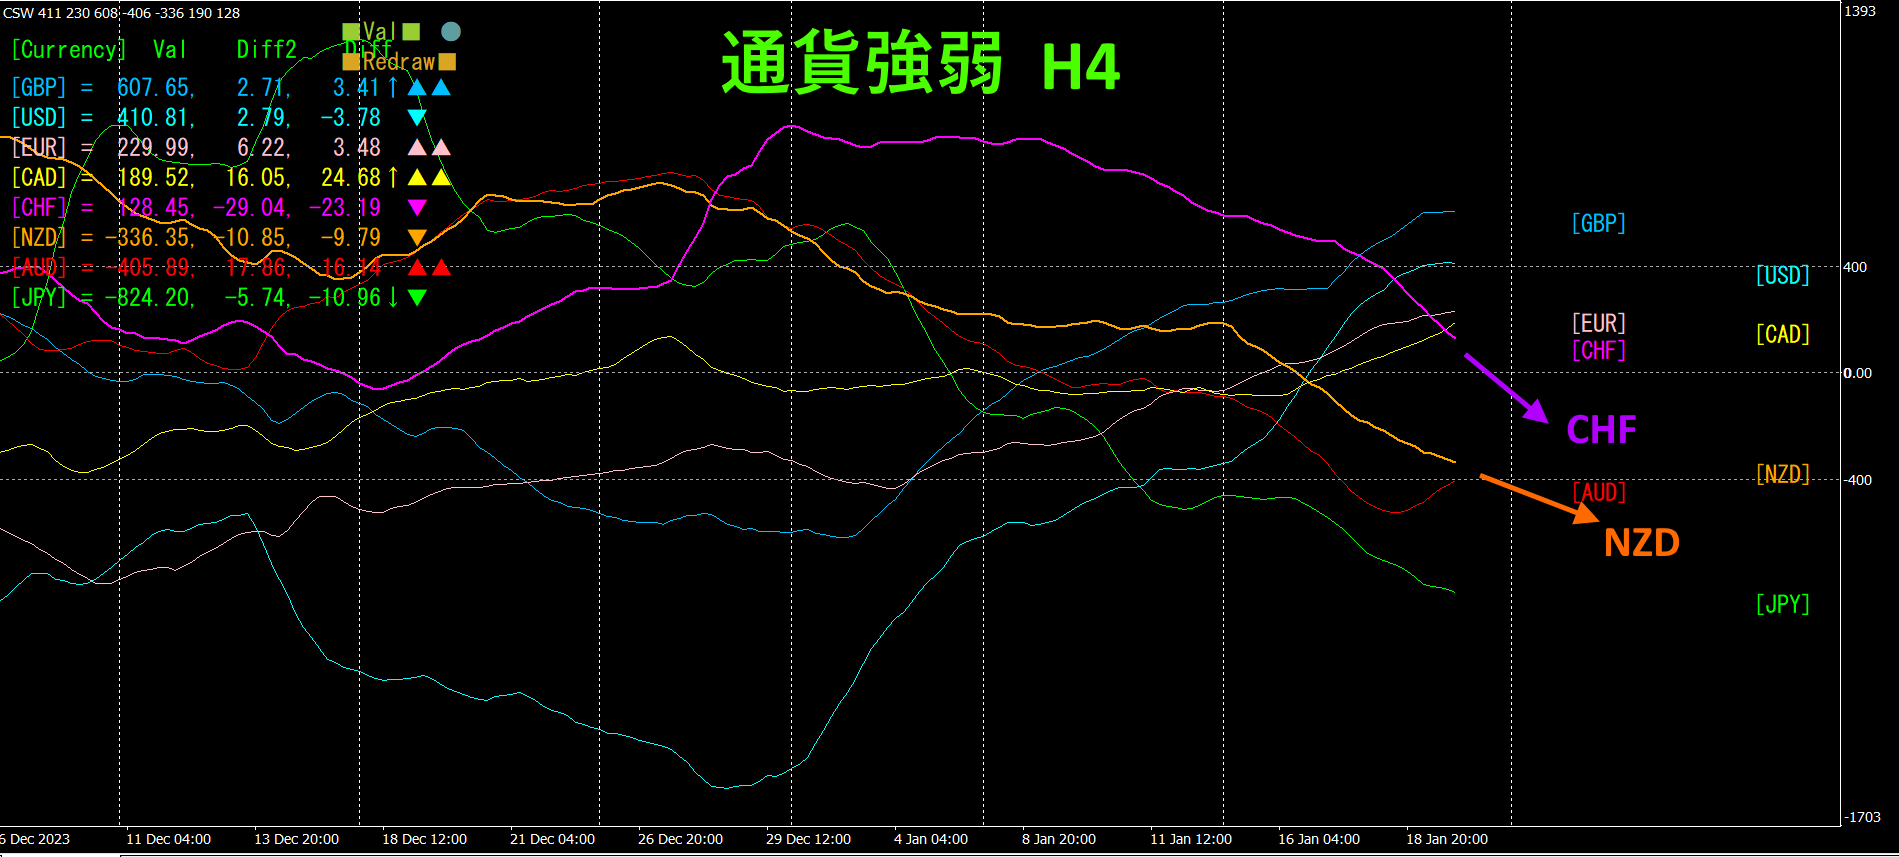
Red-purple is, orange is. and are both downward, but the angle indicates that is pointing down more steeply than. For now remains below, but if reverses, will rise.
By comparing the usual FX chart with the currency strength chart simultaneously, the trend direction becomes clearly "visualized," allowing confident trading.
Semi-automatic with “” enables drawing angled downtrend lines; when broken upward, it automatically buys, and when rising lines are broken, it automatically closes—a set-and-forget style of trading.
“”

https://www.gogojungle.co.jp/tools/indicators/42257
If you are interested in the “8C Currency Strength Visualization Indicator,” please refer to the following pages.
MT4 version https://www.gogojungle.co.jp/tools/indicators/39150
MT5 version https://www.gogojungle.co.jp/tools/indicators/39159
【My current listings】


