

A naive question about the gap in total profit and loss across different brokers, even with the same robot = EA
I would like to write about the topic in the title.
The reason is that while the real account results and backtest results on the broker I use are 100% consistent, the test results from other brokers differ so much!?
I had this question, so I wrote this article.
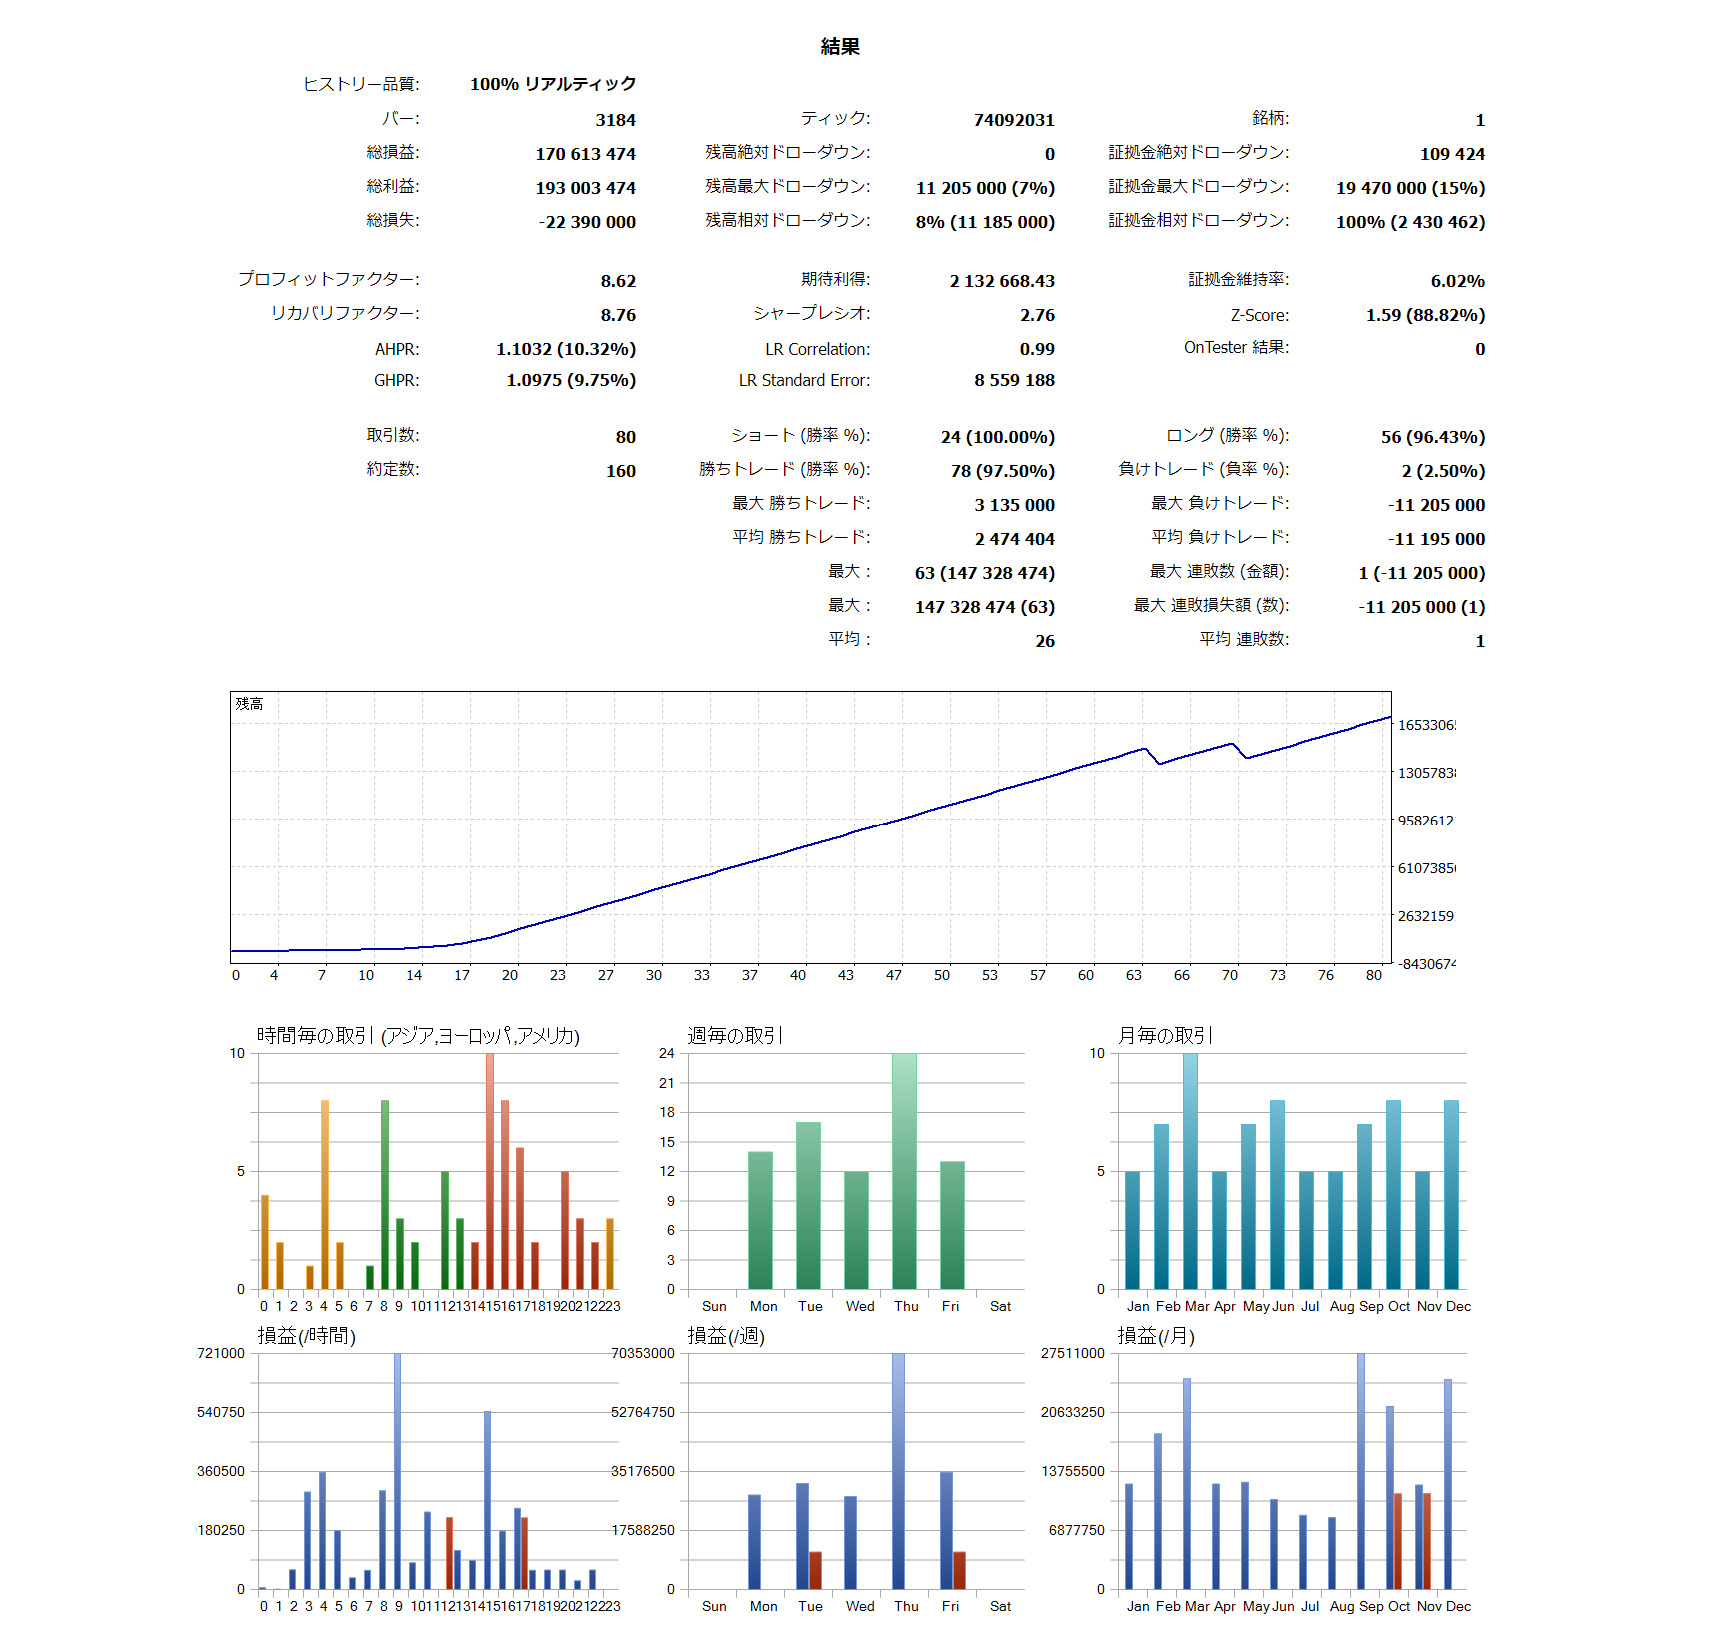
The figure below shows backtest results based on real trading with MT5 from January 1, 2022, to today, January 18, 2024.
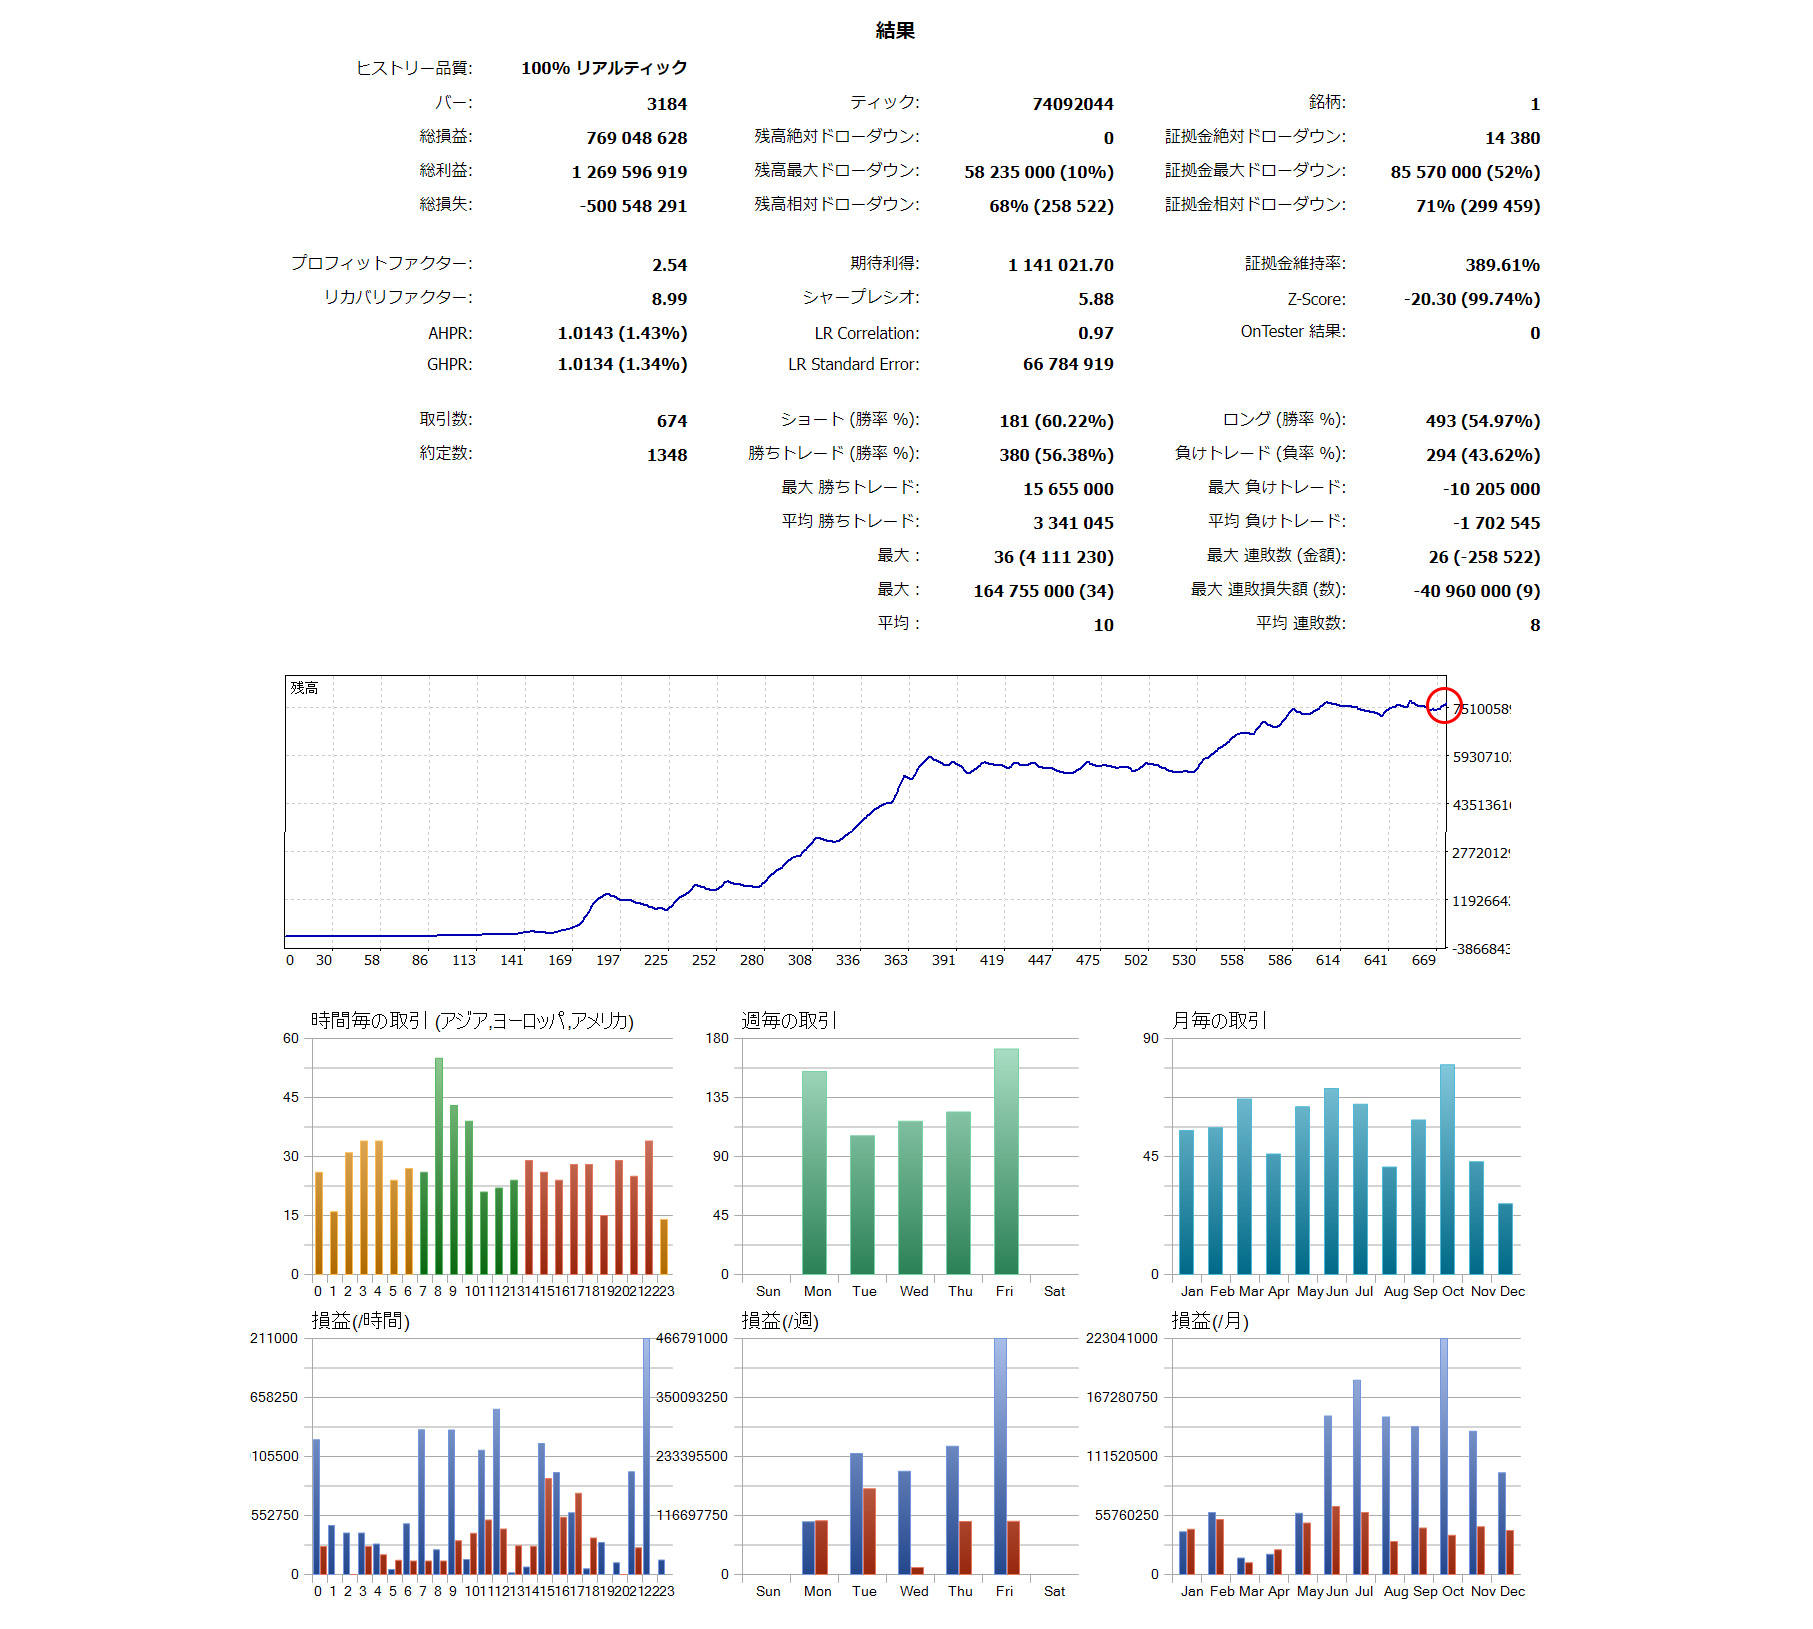
The figure above shows the backtest results from a certain broker, but please note the red circle on the far right.
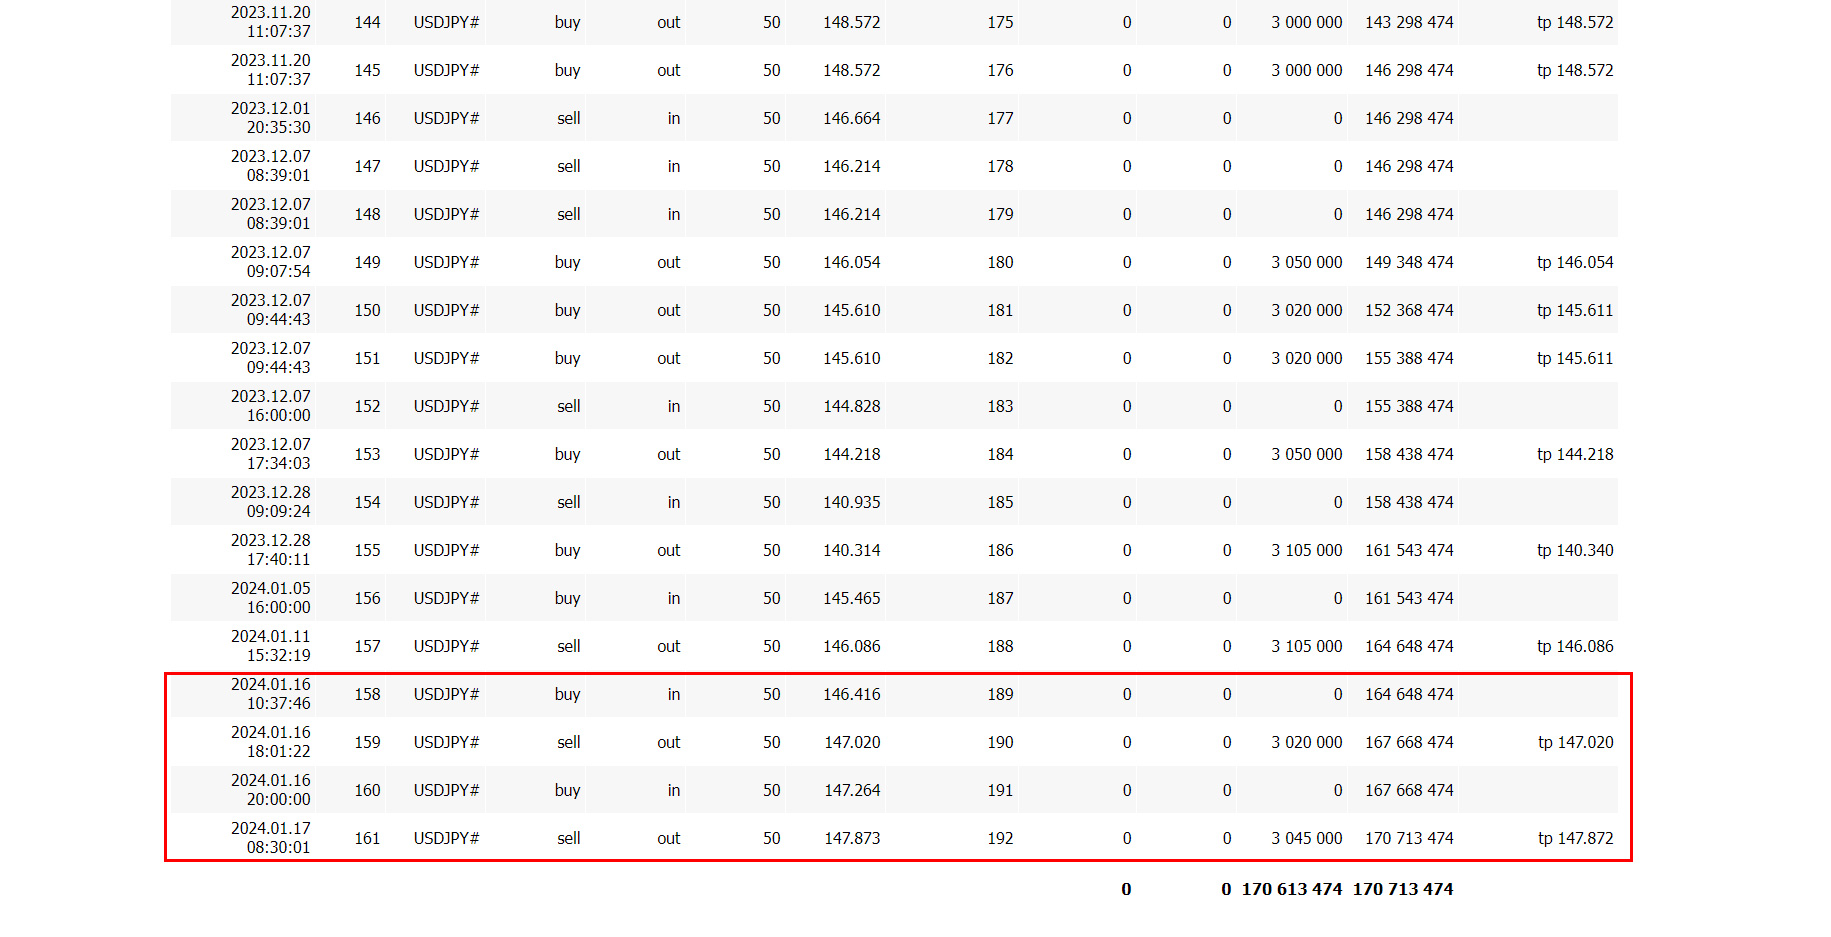
Here is the trade history at the red circle.
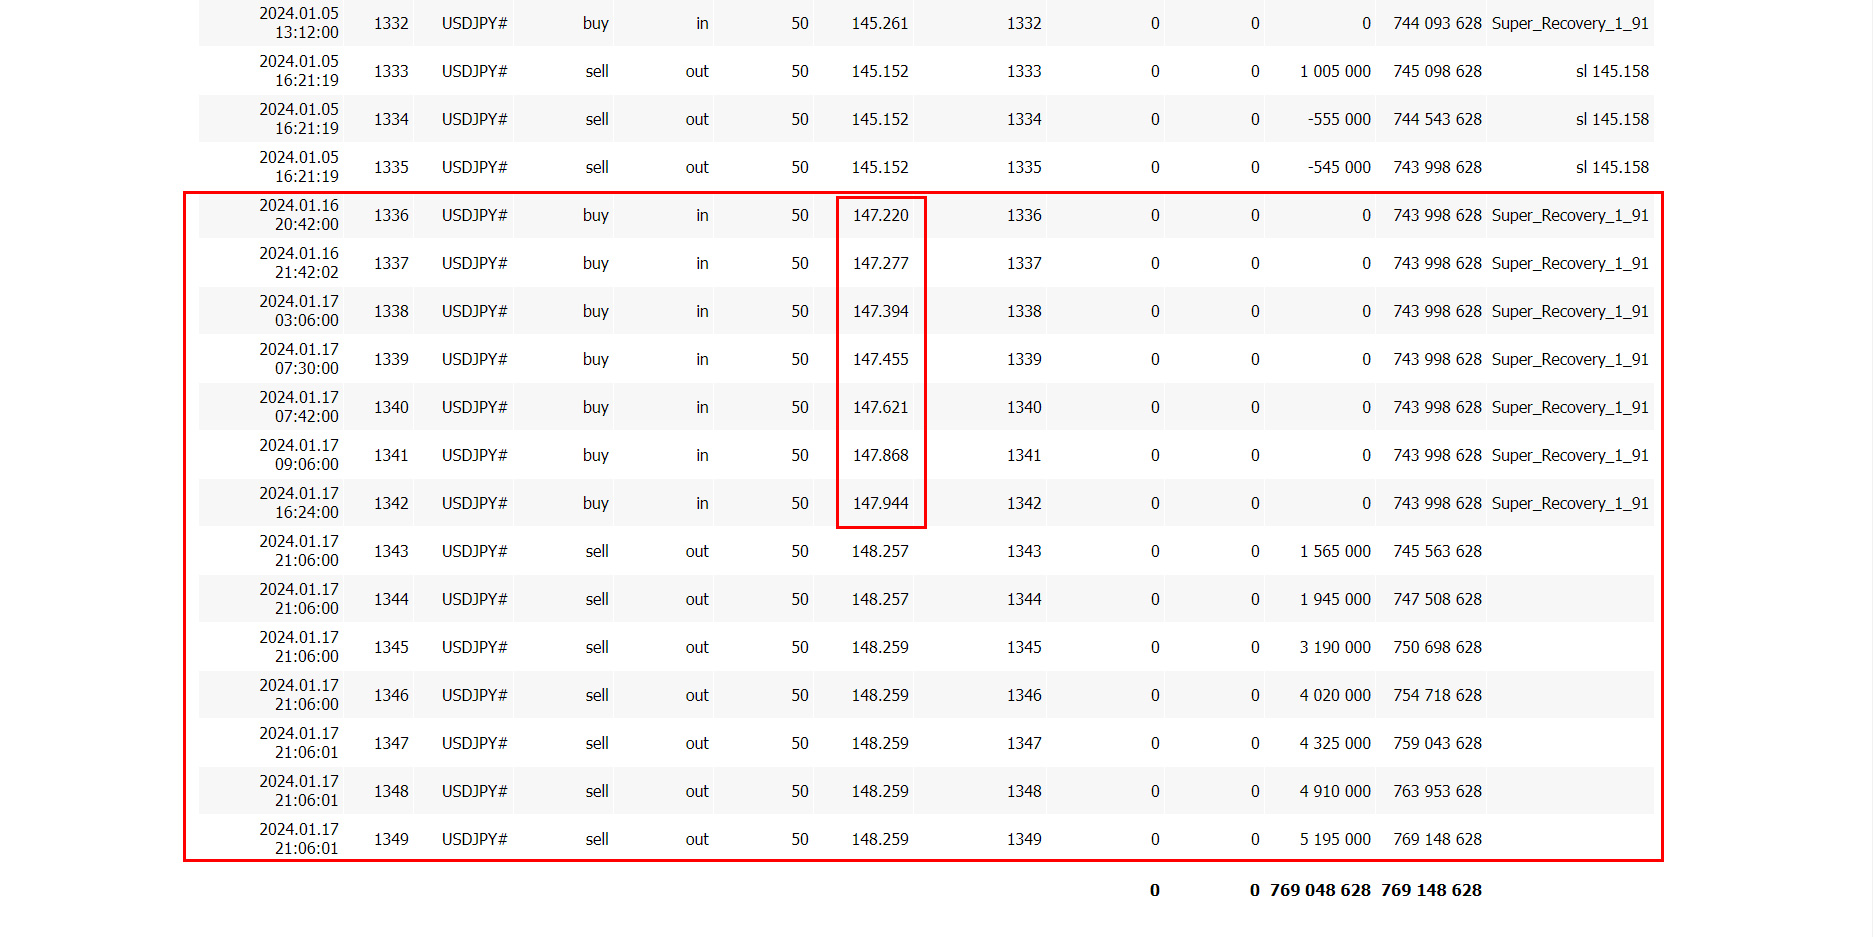
The large red box in the above figure is the trading history, and the small red boxes inside are the entry price history.
The first entry on January 16, 2024 is at the top of the small red box, taking the first position at 147.220 yen.
From the timeline, since the next positions rise in price, you can see that seven positions were pyramided.
My real account shows the same, so if the broker and account type are the same, it is reasonable to assume that the overall net profit/loss results would be quite close.
Since there is no “end of test” text on the right column bottom inside the large red box, it means that the positions were settled normally.
If, at the end of a backtest, positions are still held but the test ends forcibly, it shows end of test.
So, from January 16 of this year, all positions acquired up to the 17th were settled with positive P/L.
Of course, my real account results also match in entry price, number of positions, and Pips gained.
Looking at the backtest trading history on the chart, it looks like this.
First, the 4-hour chart.
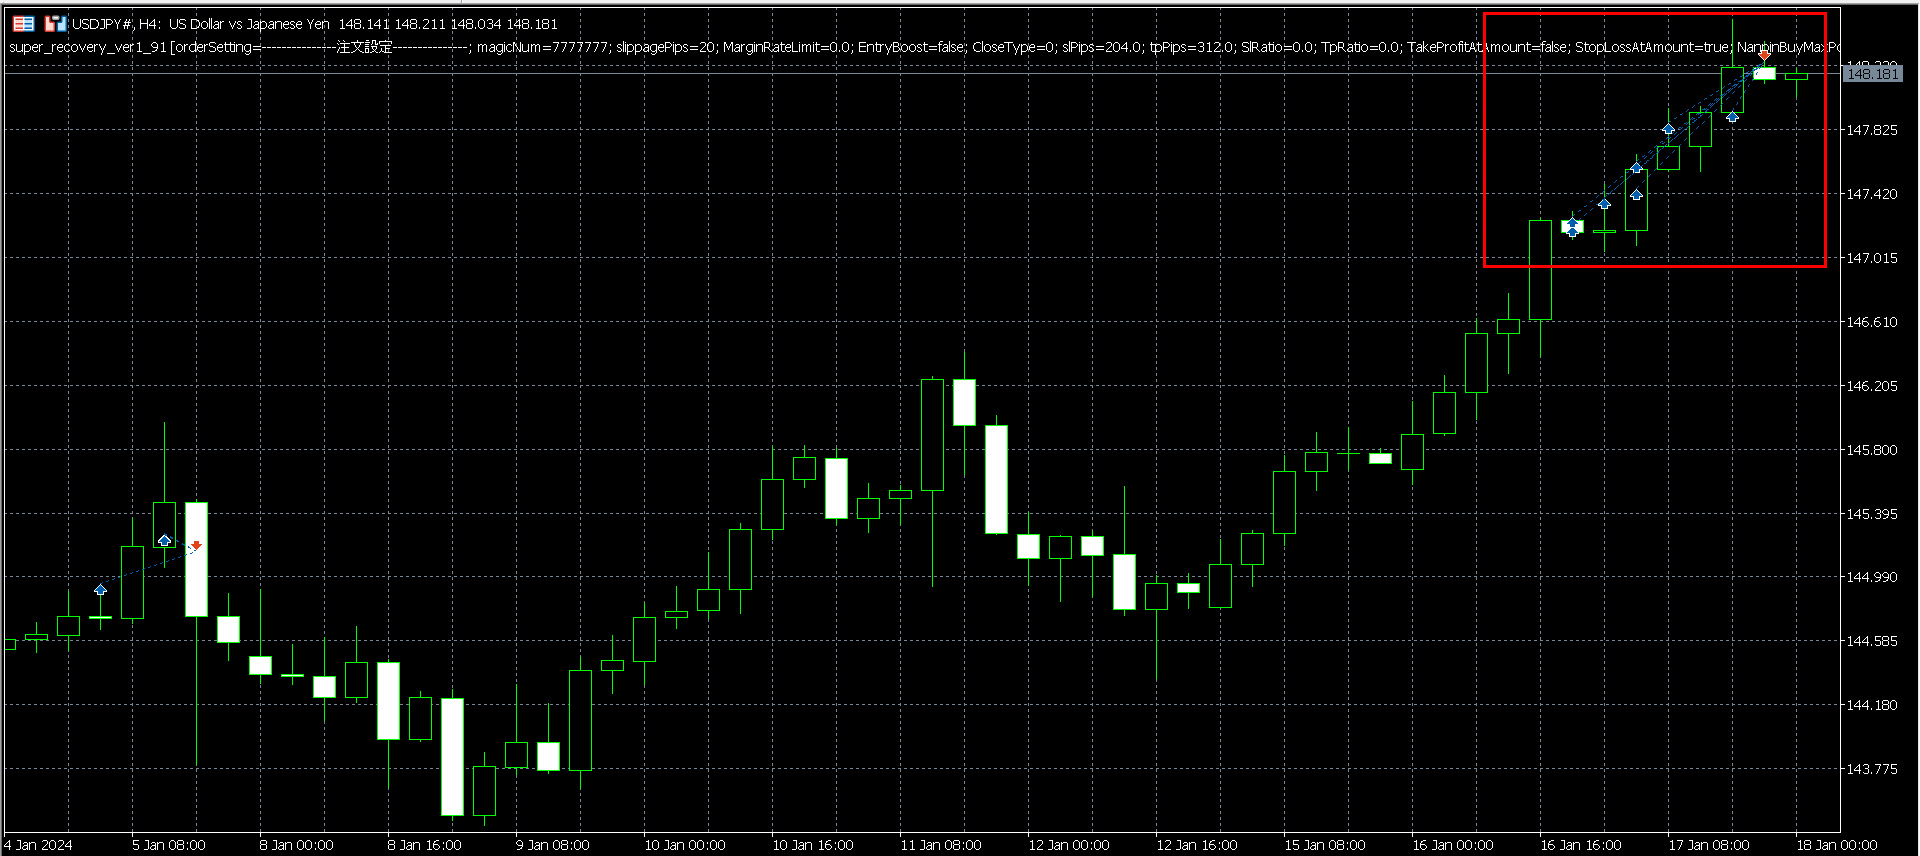
It's a bit hard to see, so I'll enlarge it.
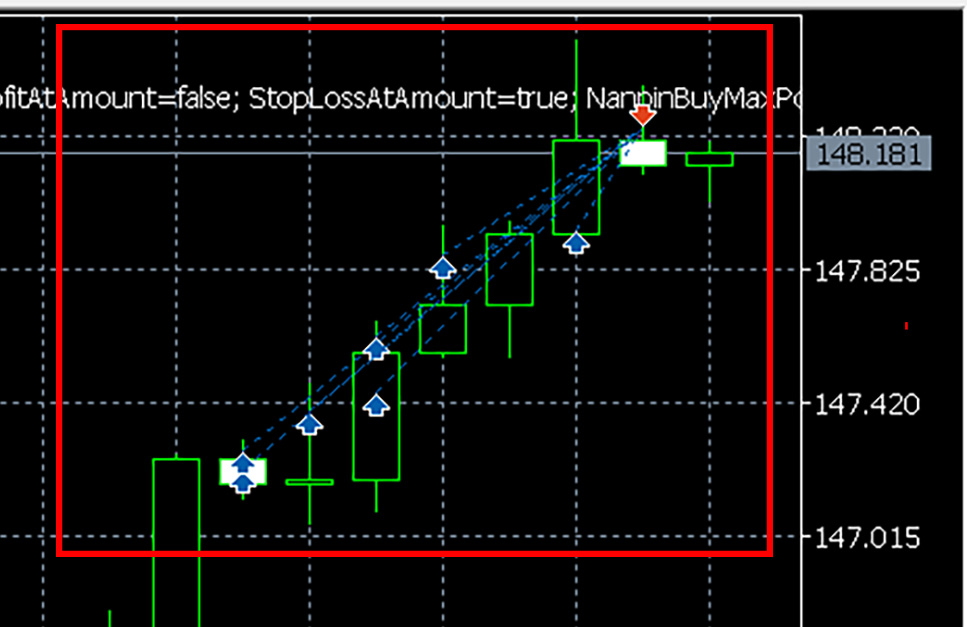
As shown above, after a long signal on the USD/JPY 4-hour chart, positions are pyramidally accumulated one by one from the 16th to the 17th.
This is a completely discretionary-free automated trading result.
In Super Recovery, a long signal on the higher time frame (4 hours) triggers entries on the lower 6-minute chart.
On the same day, the USD/JPY 6-minute chart shows such entry and exit history.
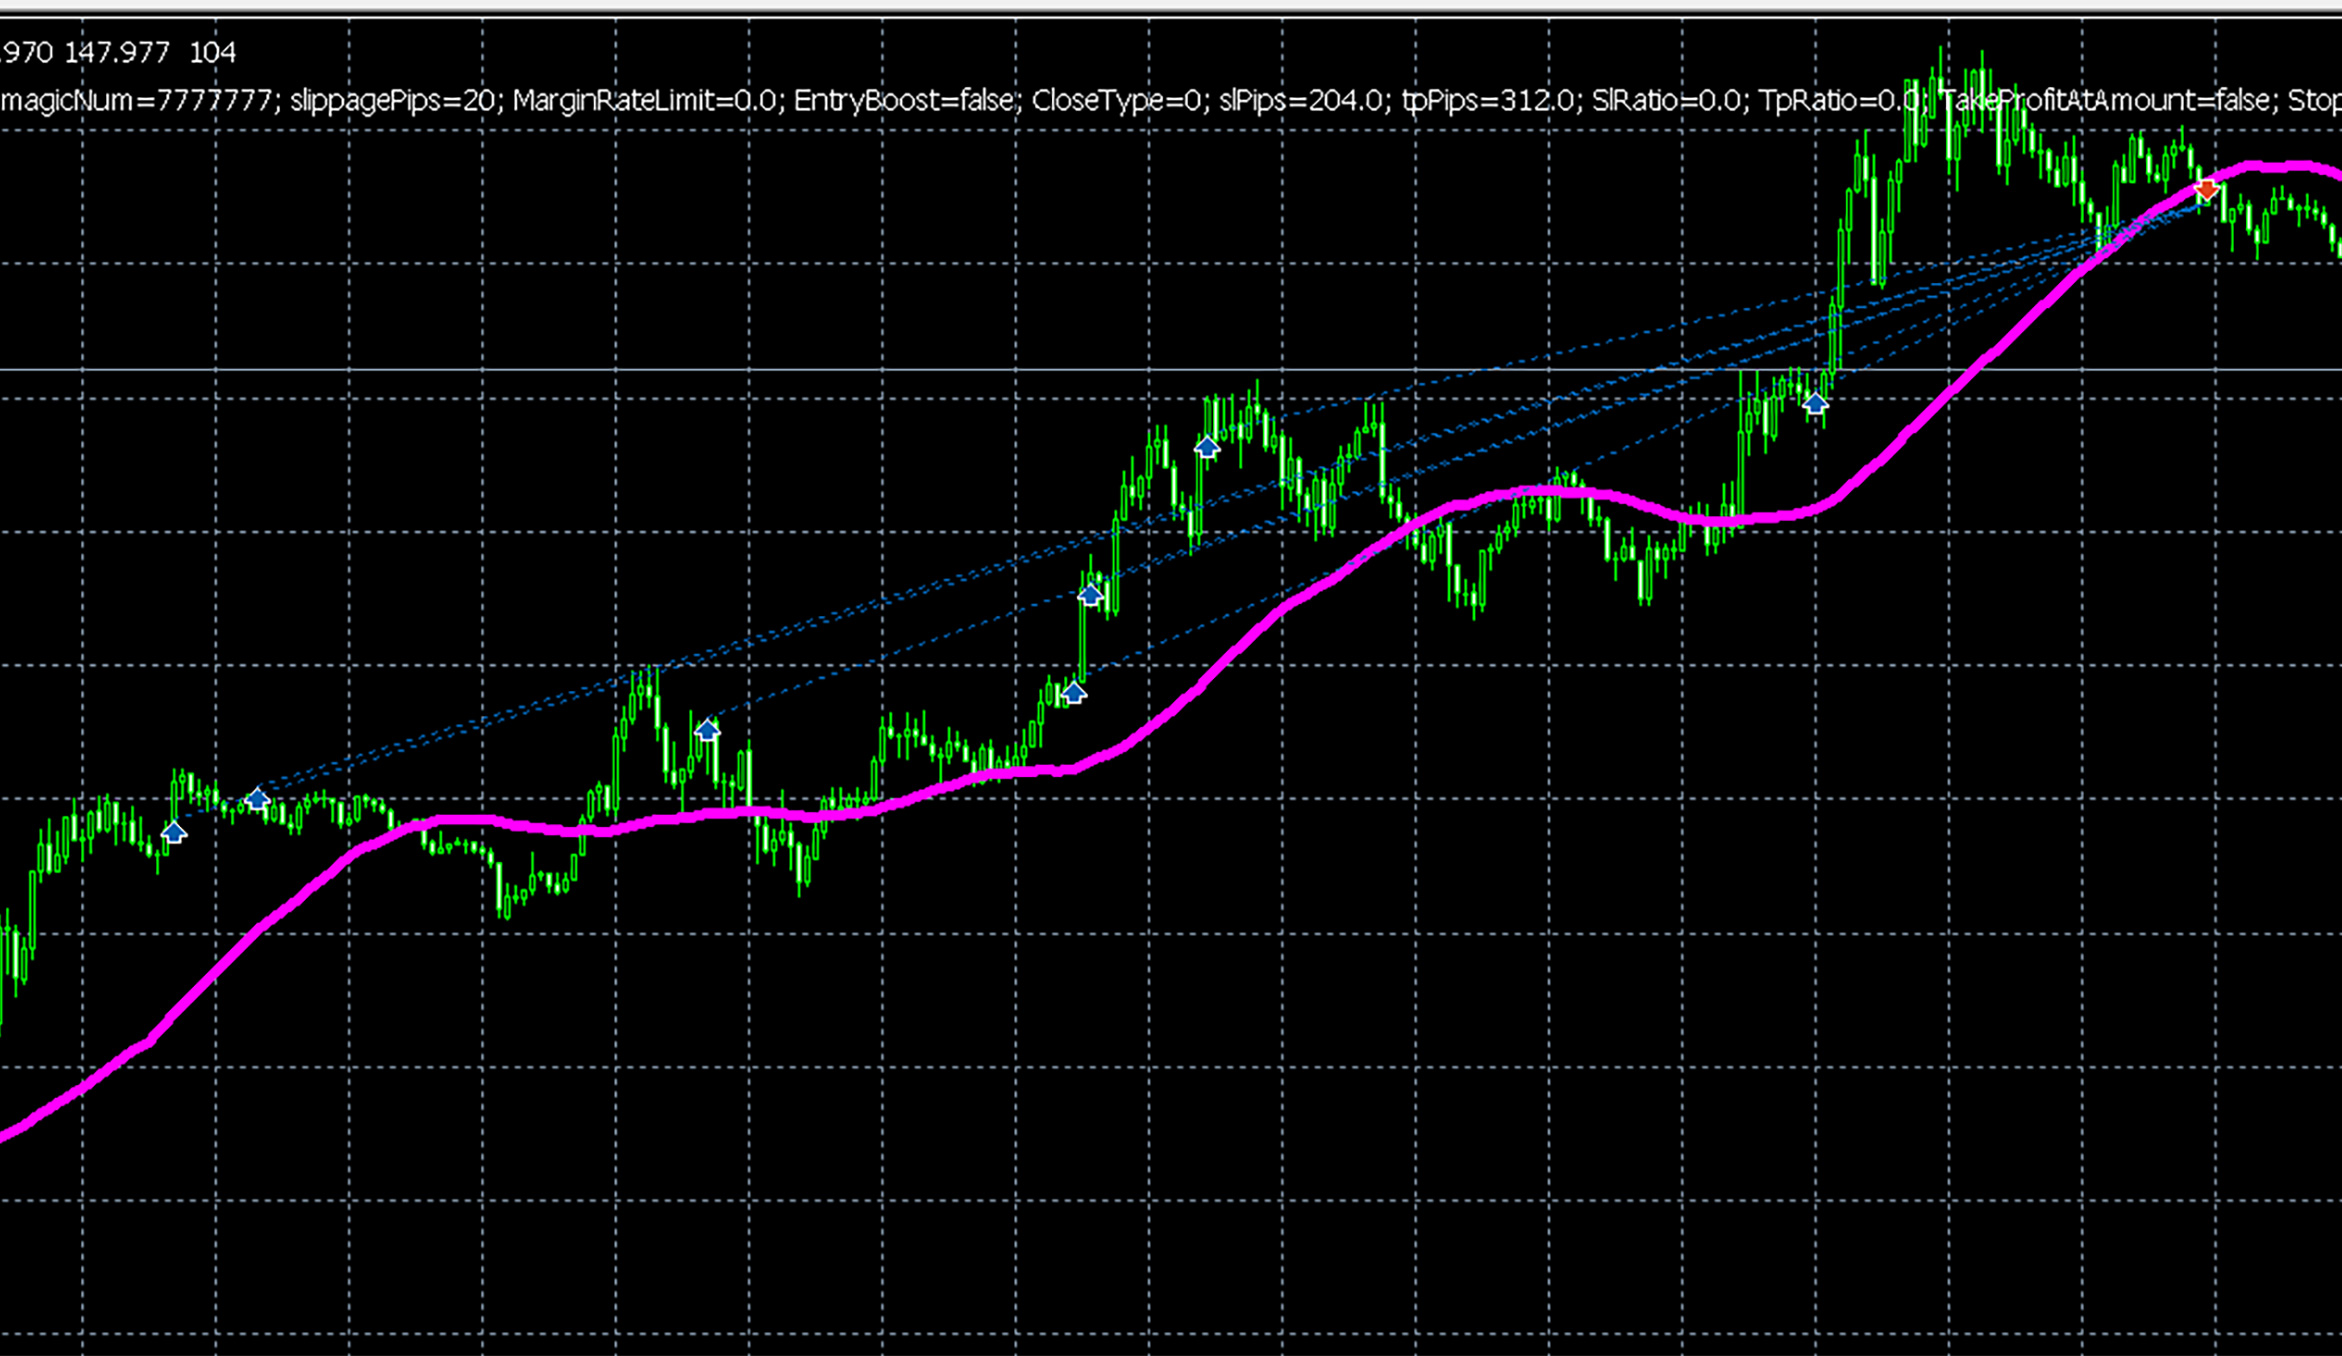
The above image shows the automated trading results of Super Recovery displaying the USD/JPY 6-minute chart.
After a long-trend verdict on the higher 4-hour chart, the lower-timeframe entry was executed on the 6-minute chart.
The blue upward arrows indicate long entries.
Over seven instances, you can see the positions pyramiding while still showing unrealized gains in chronological order.
The pink MA is 50 periods, and in the latest version, when the MA50 on the USD/JPY 6-minute chart is touched and the candle closes with certain unrealized gains, a rule instructs to settle at this point.
“Certain unrealized gains” means that if the profit exceeds 69 pips, as specified by the parameters, MA settlement will occur.
Therefore, it is settled at the downward arrow at the far right.
It was about 100 pips of profit from the first position.
Now, a little digression: the reason I created this EA lies here.
There was a long-standing struggle that I couldn’t add positions at the best timing with discretionary trading.
In other words, continuing to add positions in the middle of a rising market like this was mentally and time-wise difficult.
Whenever a little profit appeared while watching the chart, I would take profits.
There were many experiences where positions gained unrealized profit before sleep turned into unrealized loss by morning, or were stopped out, so in discretionary trading I couldn't pyramid additional positions.
That’s when an EA might easily do it?
With that thought, I created the first pyramid EA, GuppyEA.
The first pyramid EA I created, GuppyEA, was born in May 2022 and unexpectedly achieved high profitability and high win rate by coincidence.

From there, I created SuperRecovery, capable of achieving even larger net profits.
GuppyEA is no longer sold but is freely distributed through IB accounts.
Because Gogojungle prohibits free distribution of EAs and IB accounts, SuperRecovery, an evolved version, is sold commercially here.
While on the subject, I’ll also show GuppyEA’s performance over the past two years.
And the trading history is here.
Two positions were taken on January 16.
The initial acquisition was at 146.416, suggesting positions were taken at a more favorable level than with SuperRecovery.
This one takes fewer positions, averaging one to two positions.
When GuppyEA was first created, the trend judgment on the USD/JPY 4-hour chart showed 100% for both short and long, so I left the trend judgment to GuppyEA and imagined that actual entries could use the lower-timeframe chart with pyramiding and martingale to further increase profits. This gave birth to SuperRecovery, but in practice Super Recovery reduced win rate and caused large profits and losses proportional to the number of positions, resulting in a volatile EA style.
In the same two years, GuppyEA would have turned 100,000 yen into 17 million yen, but SuperRecovery under the same conditions exceeds 700 million yen.
The difference in total net profit is huge, but in terms of swings in and out, the stable GuppyEA cannot be beat.
The reason GuppyEA cannot be sold on Gogojungle is that, based on the broker account type I use, the high-win-rate total profit results described earlier do not appear, so selling GuppyEA on Gogojungle would yield completely different results for users with various brokers, which led me to abandon selling GuppyEA on Gogojungle.
This leads to the topic in the title.
In other words, no matter how excellent the backtest results are, forward results can differ greatly depending on the broker.
Spread also plays a large role, and there are substantial differences between DD, NDD, and ECN models.
There is a hearsay that most Japanese brokers use the DD model (dealing desk).
There are rumors that stops are hunted due to extremely long upper or lower wicks, unlike other brokers.
The truth is uncertain, so be careful not to take it as fact.
In particular, spreads widen during major news and in the early morning, which also has a big impact.
Yes, in a negative sense.
First, the Super Recovery Discount.
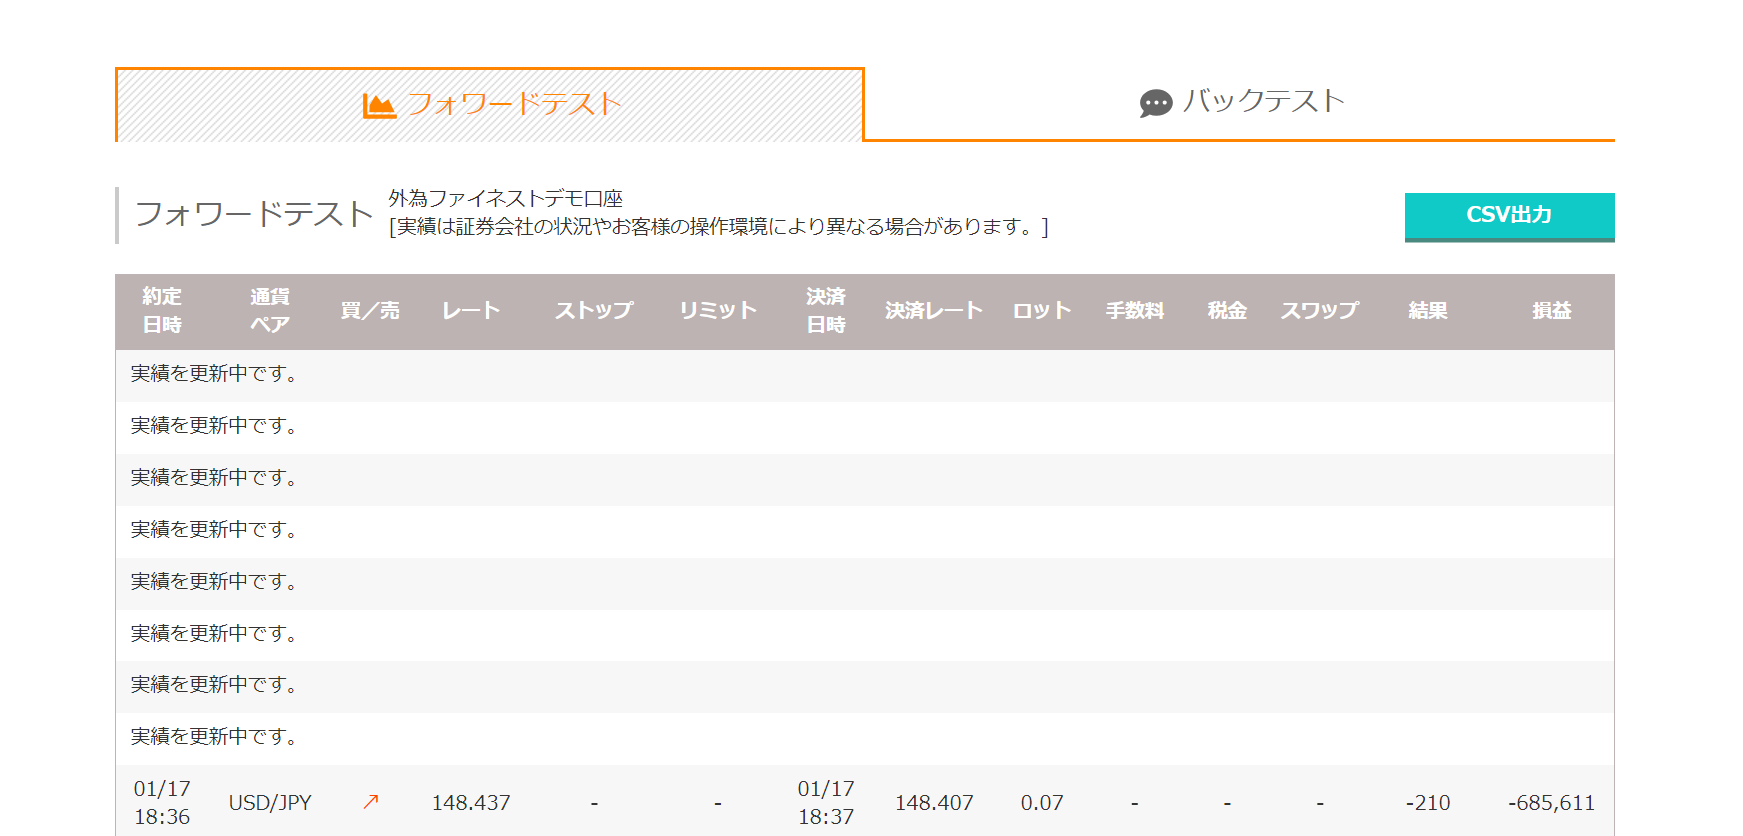
For some reason, as of yesterday, January 17, only one long position was settled, and the rest remained open.
Logically, when multiple positions are in the same direction, if one of the multiple open positions is settled, all should be settled, so it is odd that only one was settled.
With the broker I am using, when a bearish candle closes below MA50, all positions are settled, but Gogojungle still has them open.
I will check again tomorrow, but there is a delay in data transmission, and I have heard that within about two hours you can also view trading history on Gogojungle, yet positions remain open even the next day, which is very puzzling.
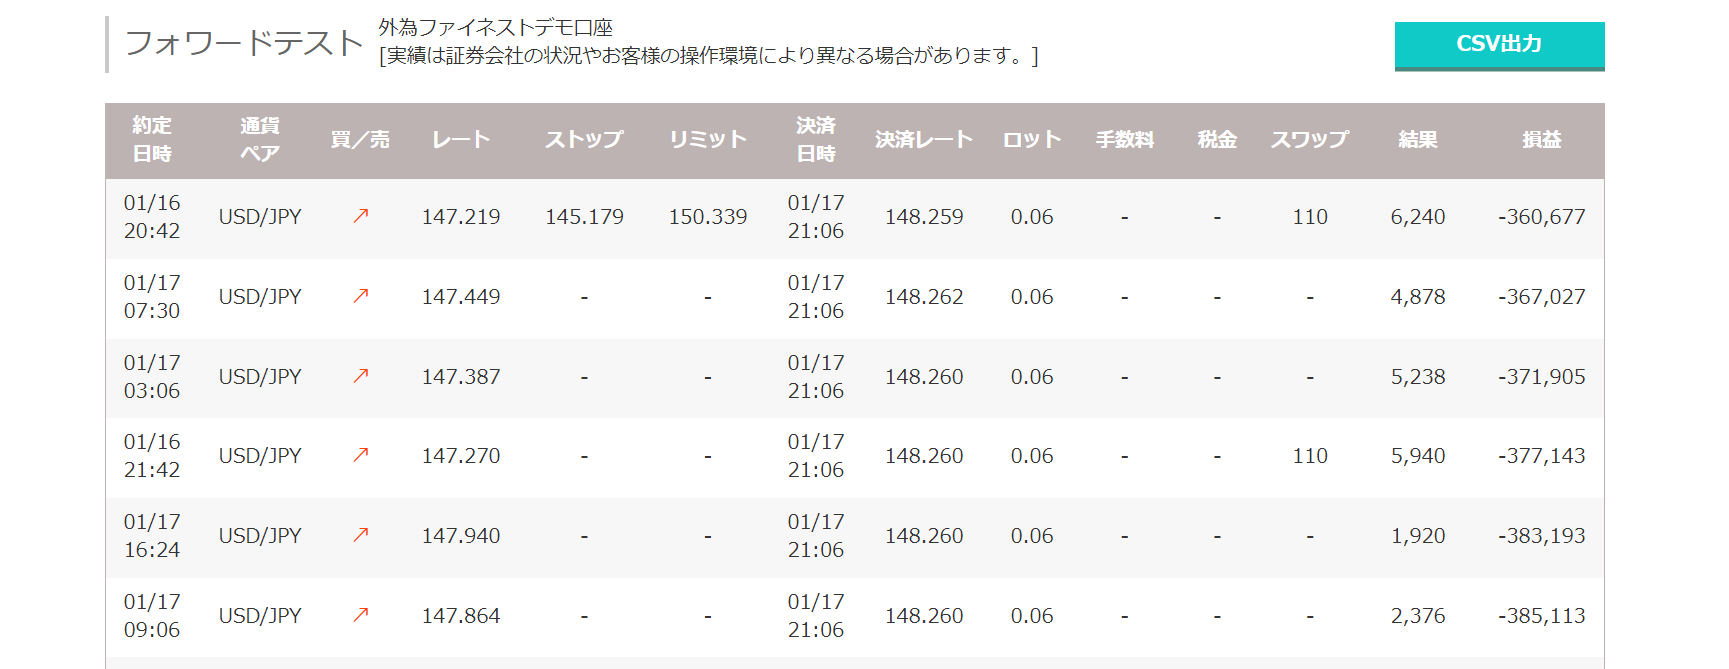
Additionally, another user who did not purchase the same EA but used a different indicator has results close to my account, with about 6 positions at 0.06 lots, earning 6,240 yen in profit, successfully realizing over 100 pips.
Looking at this, even with the same logic and same EA, brokers and accounts lead to quite different net profits.
One broker shows a 100-pip profit, while another broker leaves positions unsettled for more than a day.
Thus, even the same EA can yield completely different results depending on broker and account, so the profit and loss outcomes are individual to each case, wouldn’t you agree?
That’s all for today, but there were two reports of a bug where the panel display disappears in the new version of SuperRecovery 1_9, so I will release an updated version. Buyers should await a notification from Gugojungle about the version upgrade.