

[December/USDJPY] Verification results of the Tendo Navigator method
Hello!
I am Ponta the Tanuki Trader.
I have also verified USD/JPY for December, so I will summarize it here.
It was a market with little trend, not suitable for a method that requires strong trend; I wonder how it turned out?
I hope to share market analysis and FX information on this Investment Navigator Plus.
December 1st USD/JPY
Buy +2 pips
※ The background colors are aligned for a trading scene. However, there are times when the background becomes white, indicating a sideways market.
※ This is almost a break-even exit on take-profit signals.
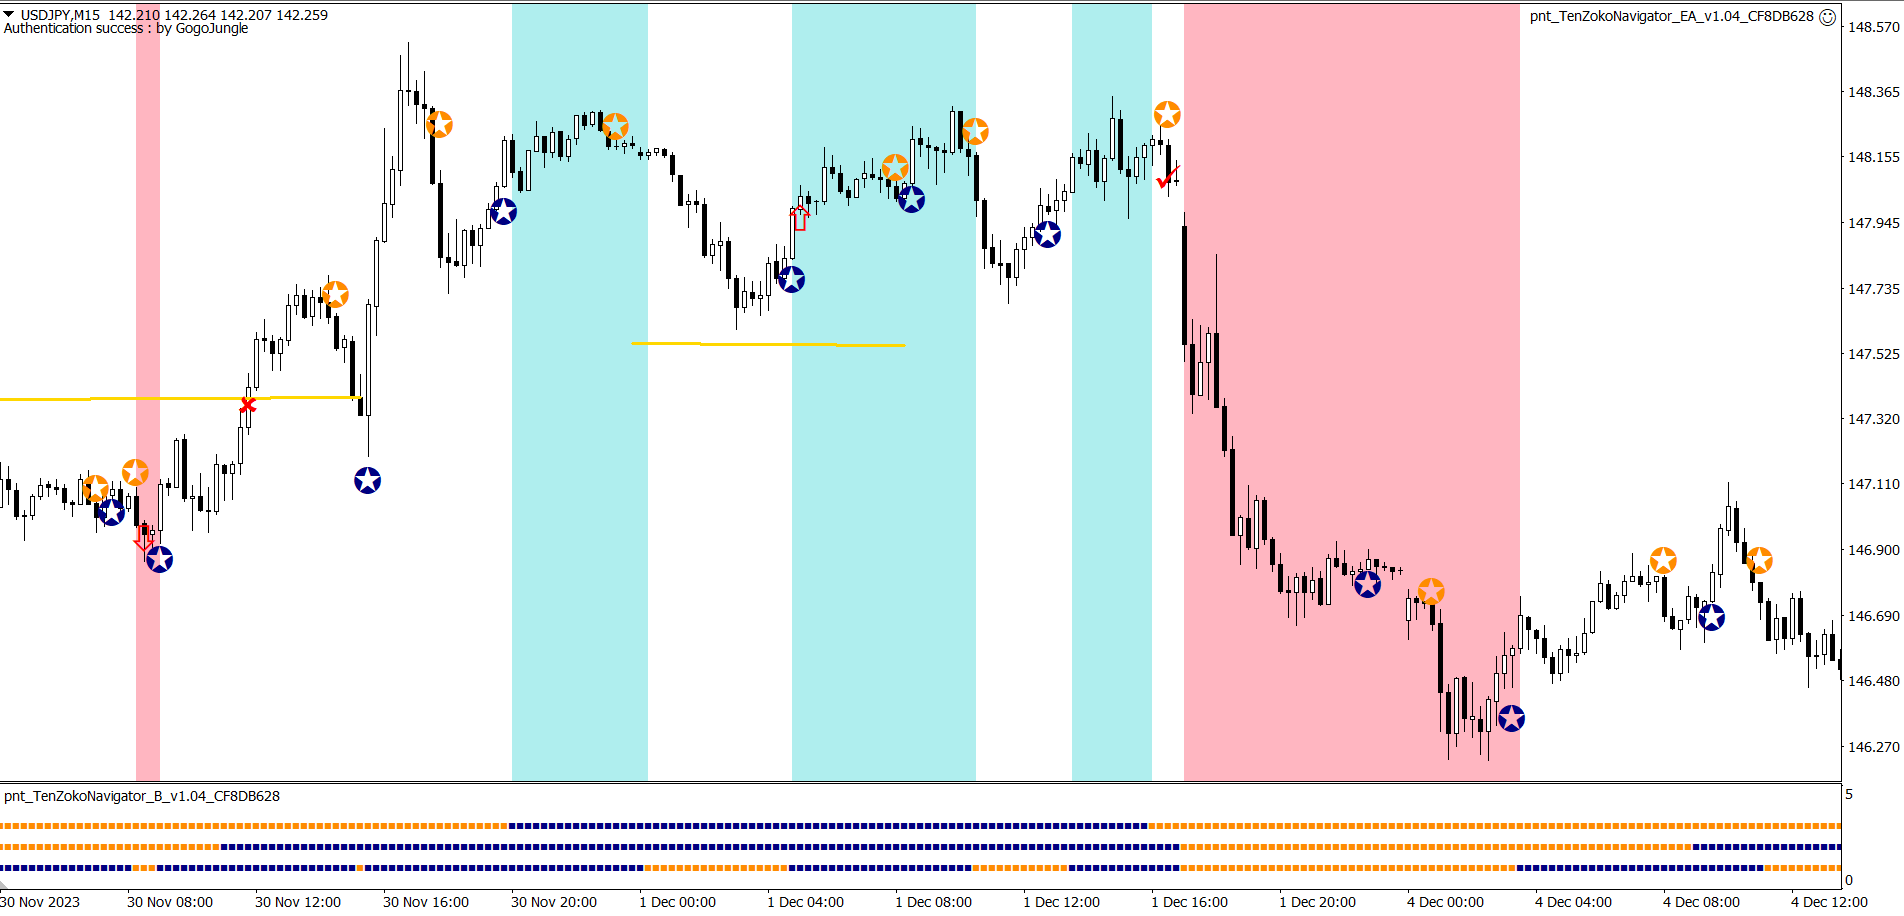
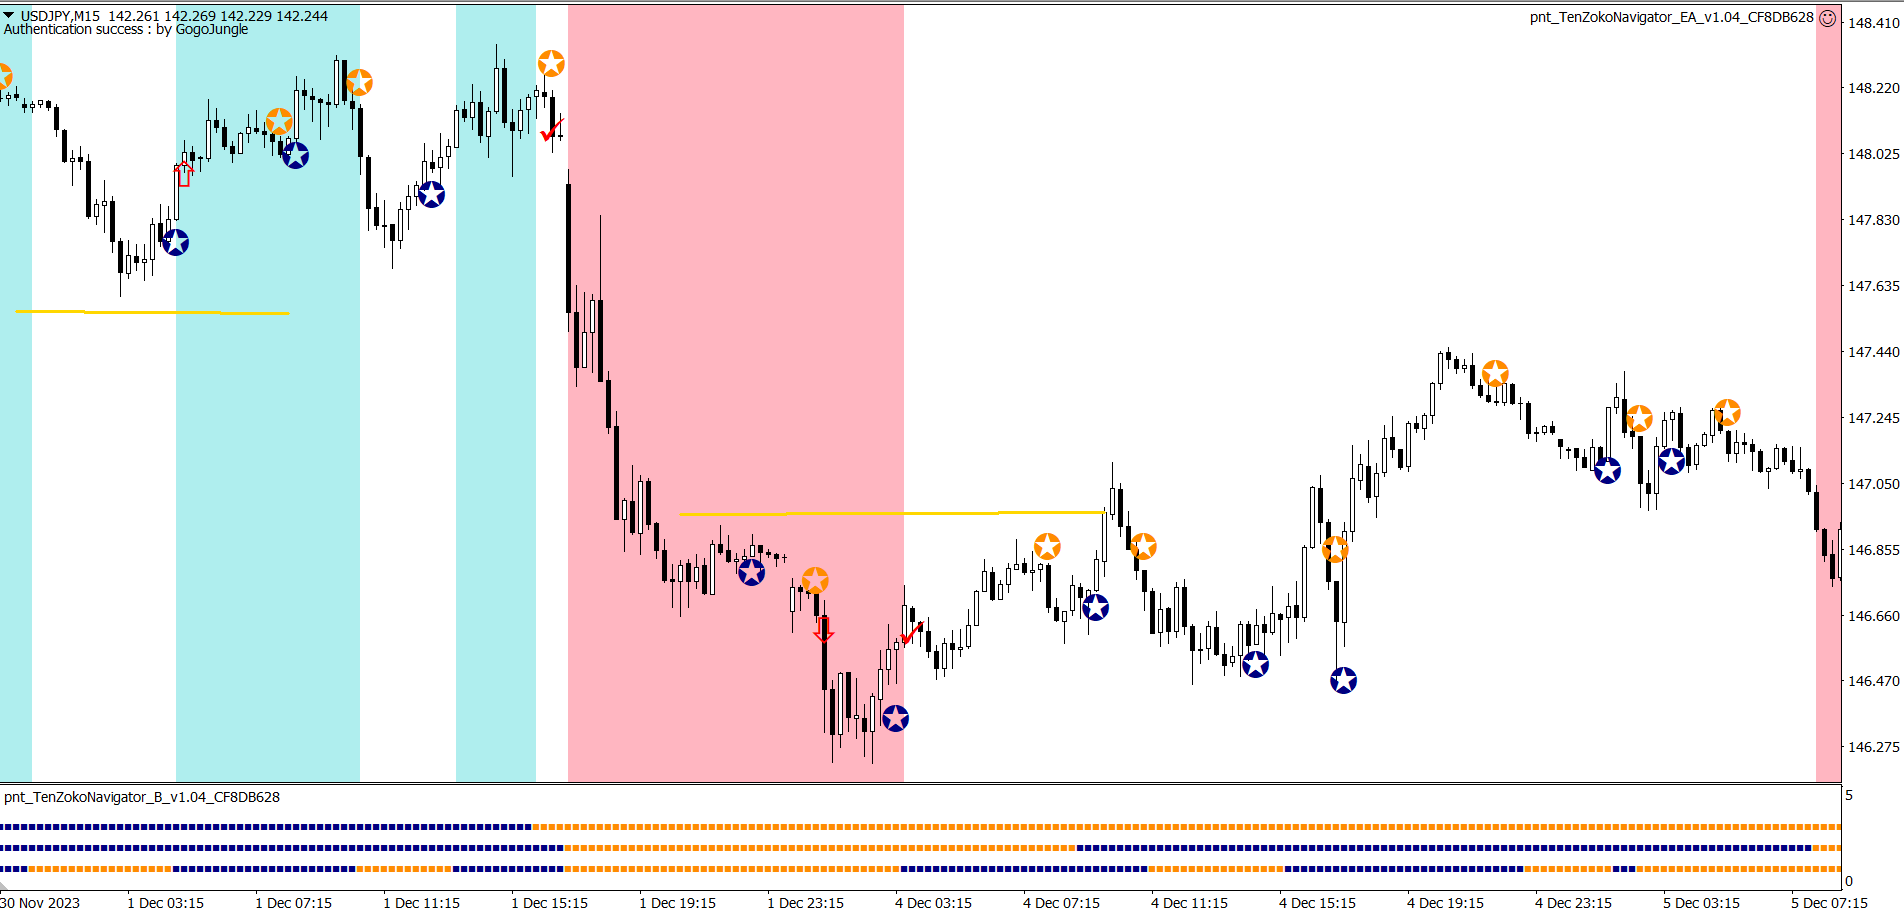
December 4th USD/JPY
Sell +7 pips
※ It was a sell trade after the price fell to a certain extent, exiting with a small profit.
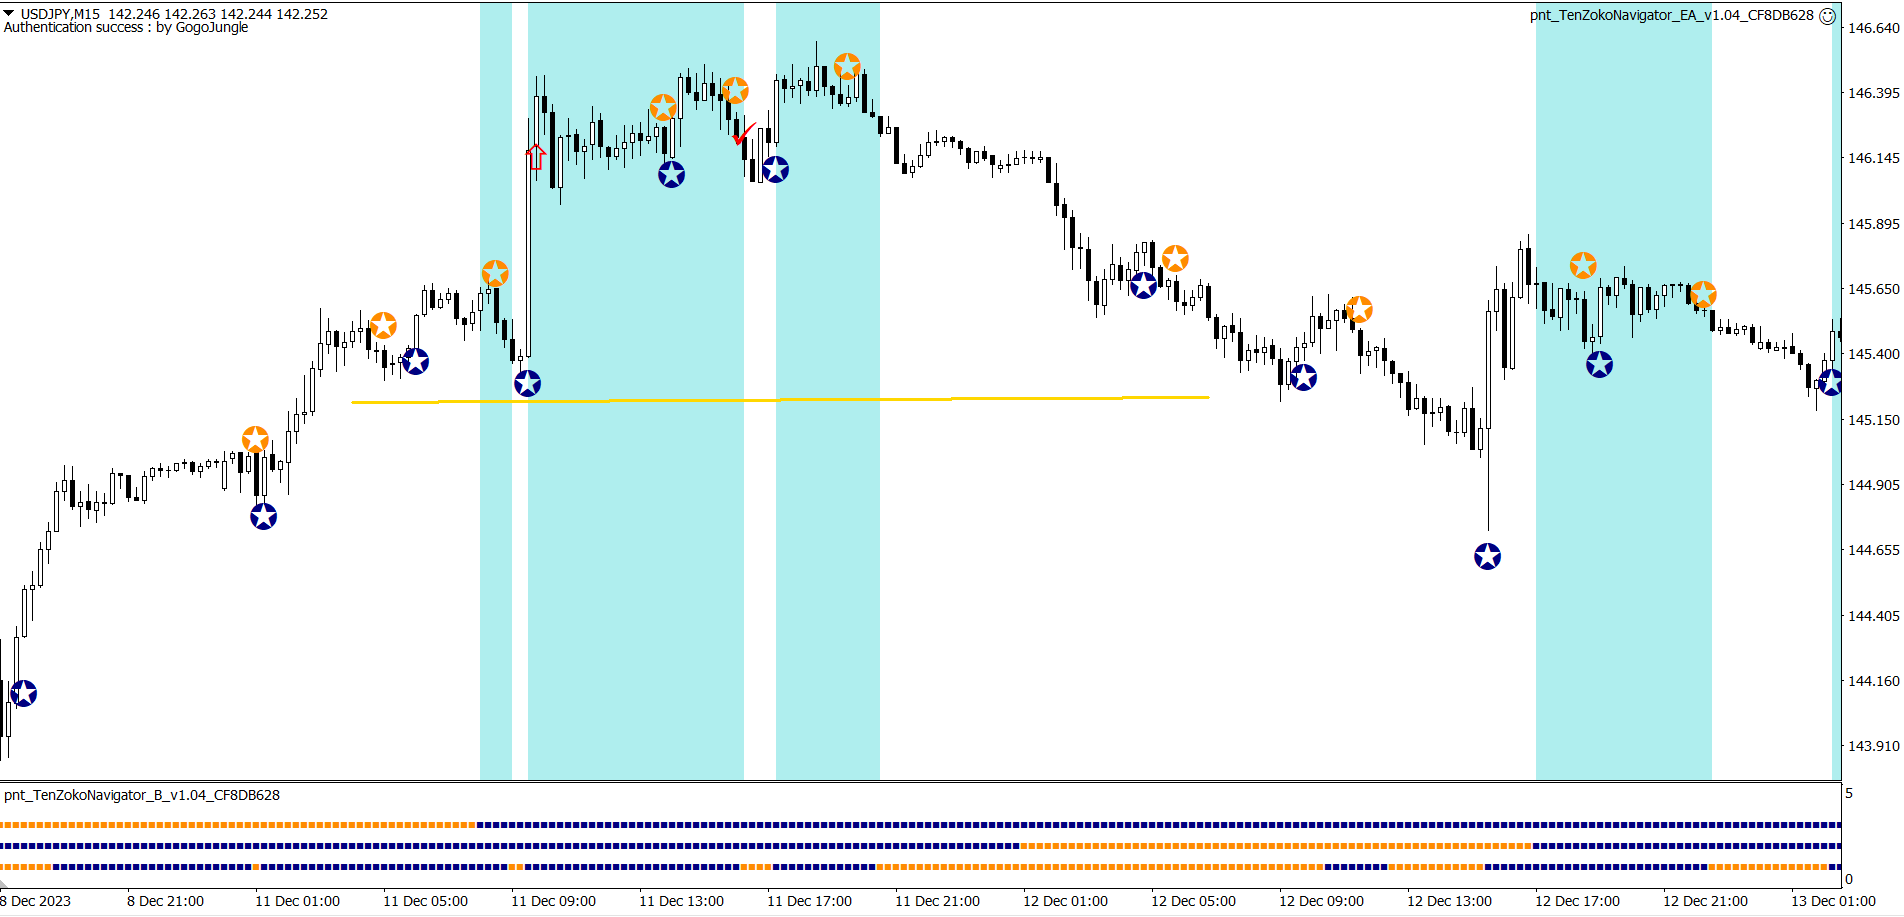
December 11th USD/JPY
Buy +2 pips
※ Another move did not extend, ending near break-even.
※ In the first half of December, there were few places to take profits in USD/JPY.
※ Aim for monthly or yearly profits, not just daily profits!
December 13th USD/JPY
Buy +7 pips
※ This was a buy signal at a high price area. After a strong rise, there are cases where it is easy to lose, but this time it exited with a small profit on the slight rise.
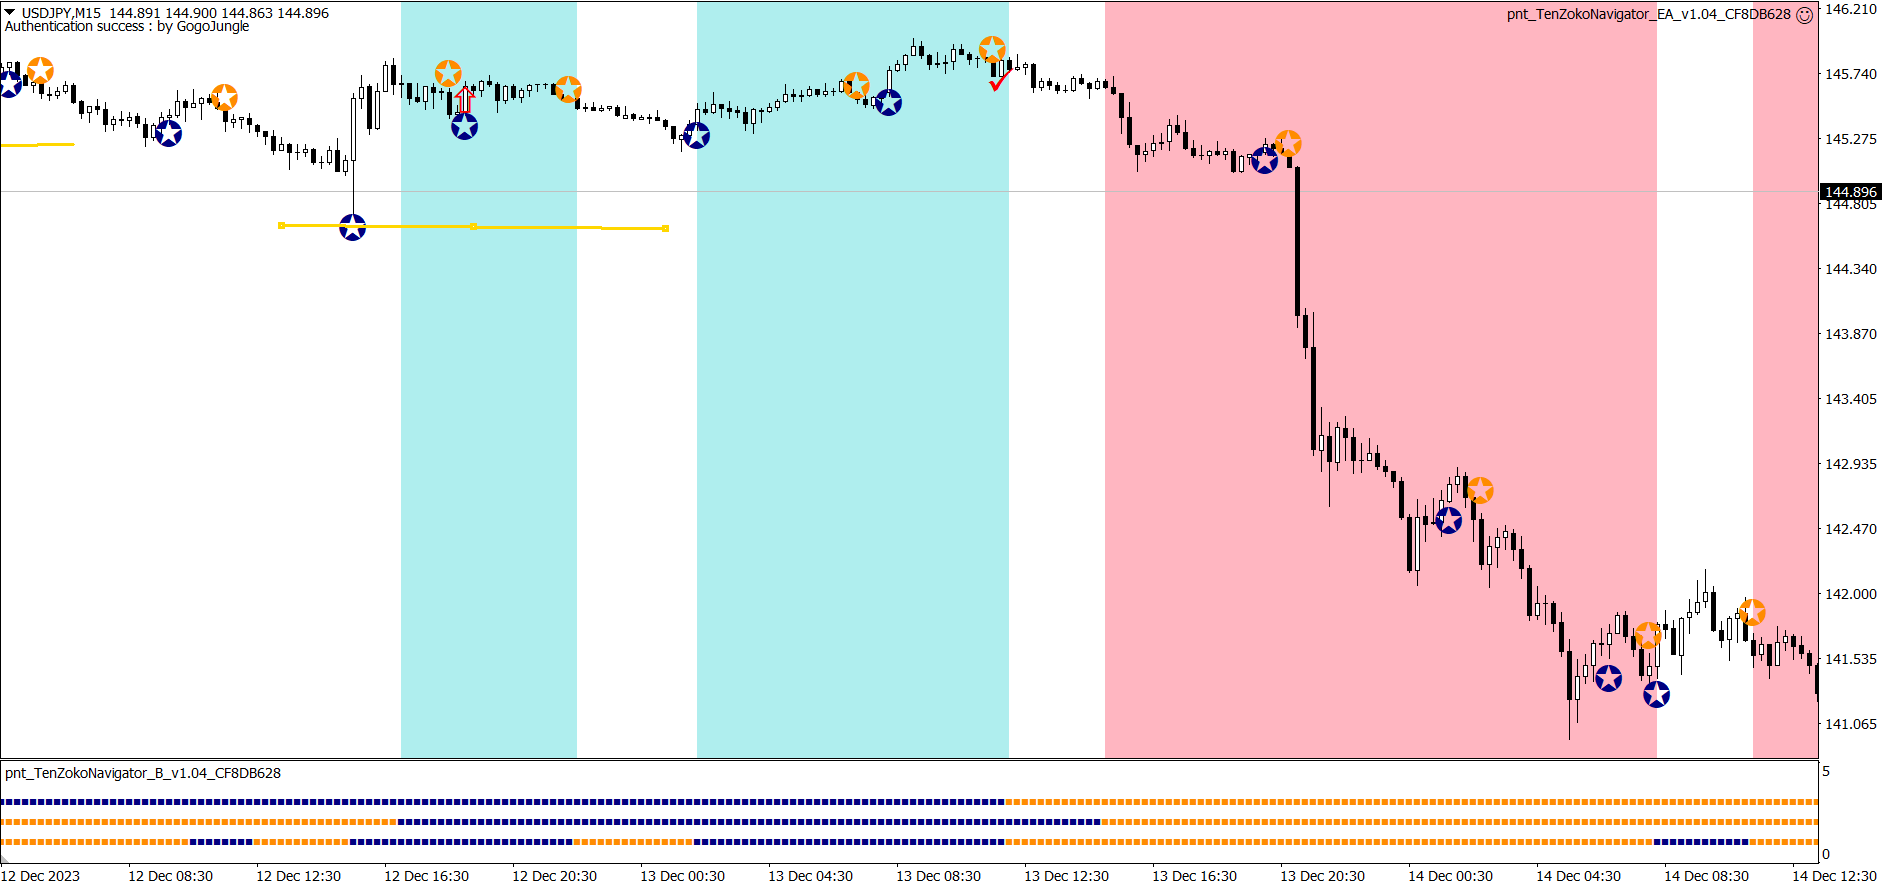
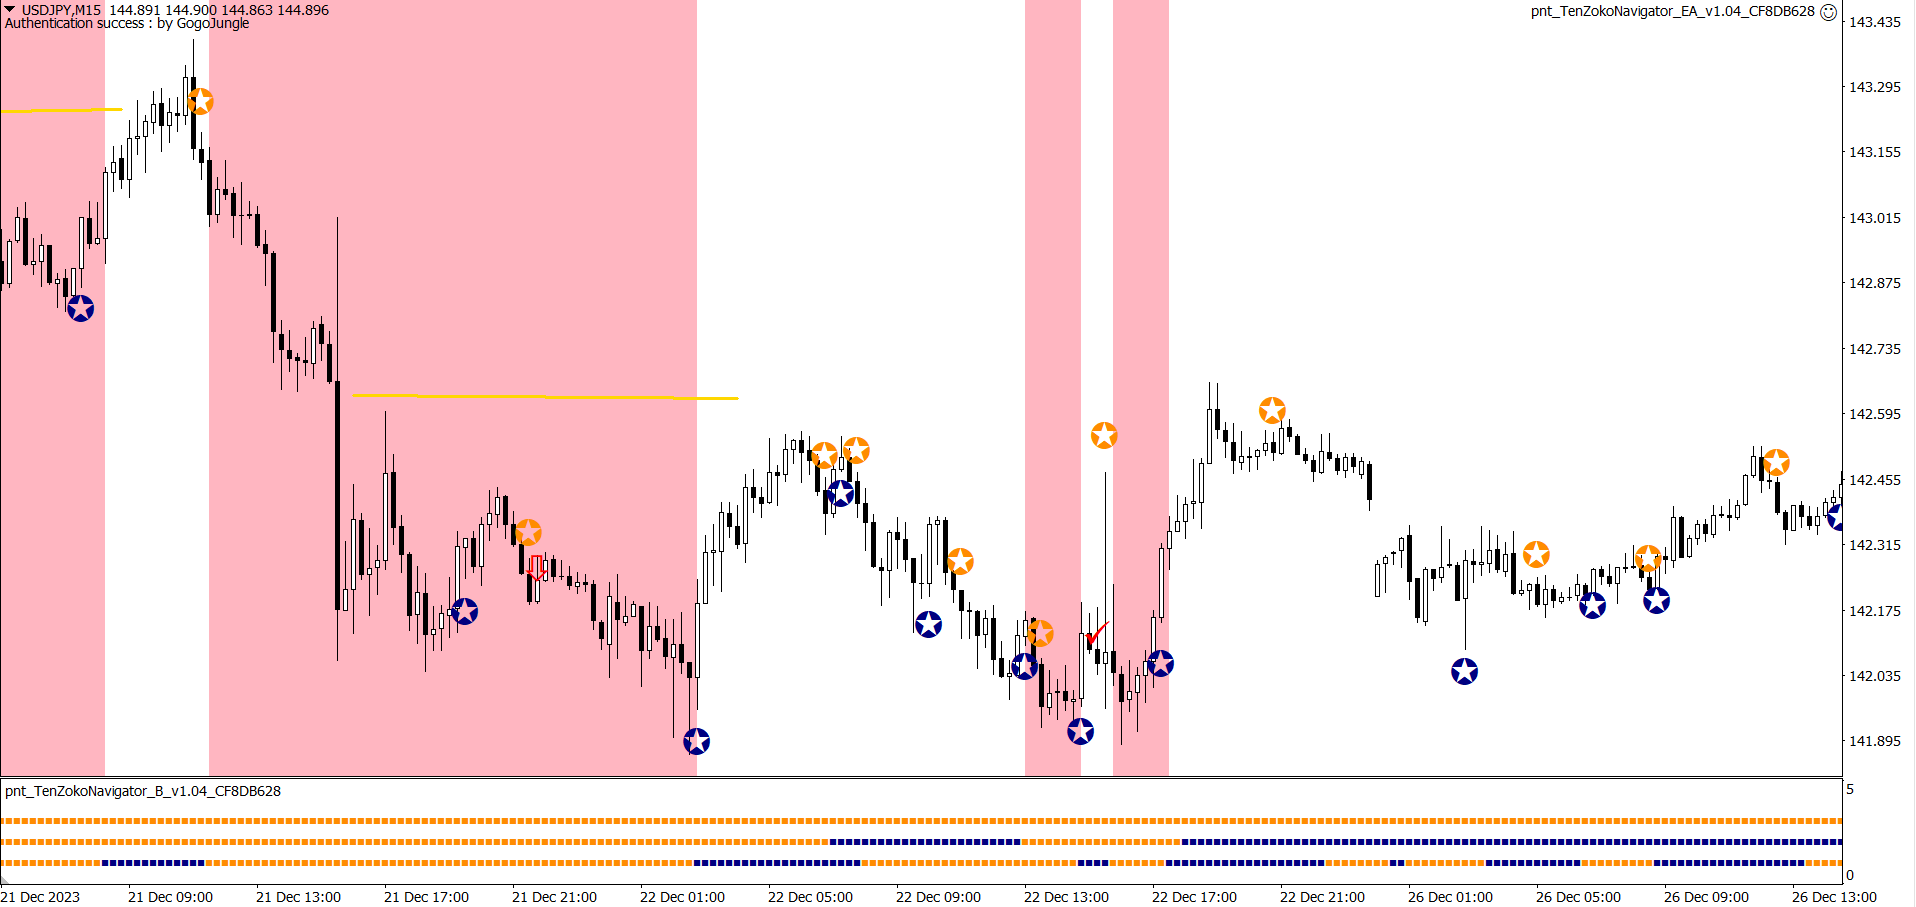
December 14th USD/JPY
Sell +63 pips
※ A trade that captured an early drop with a color change from light blue to pink at high price area. A pattern of selling on a pullback.
※ The first target is a 1-to-1.5 price level, which triggers before the signal.
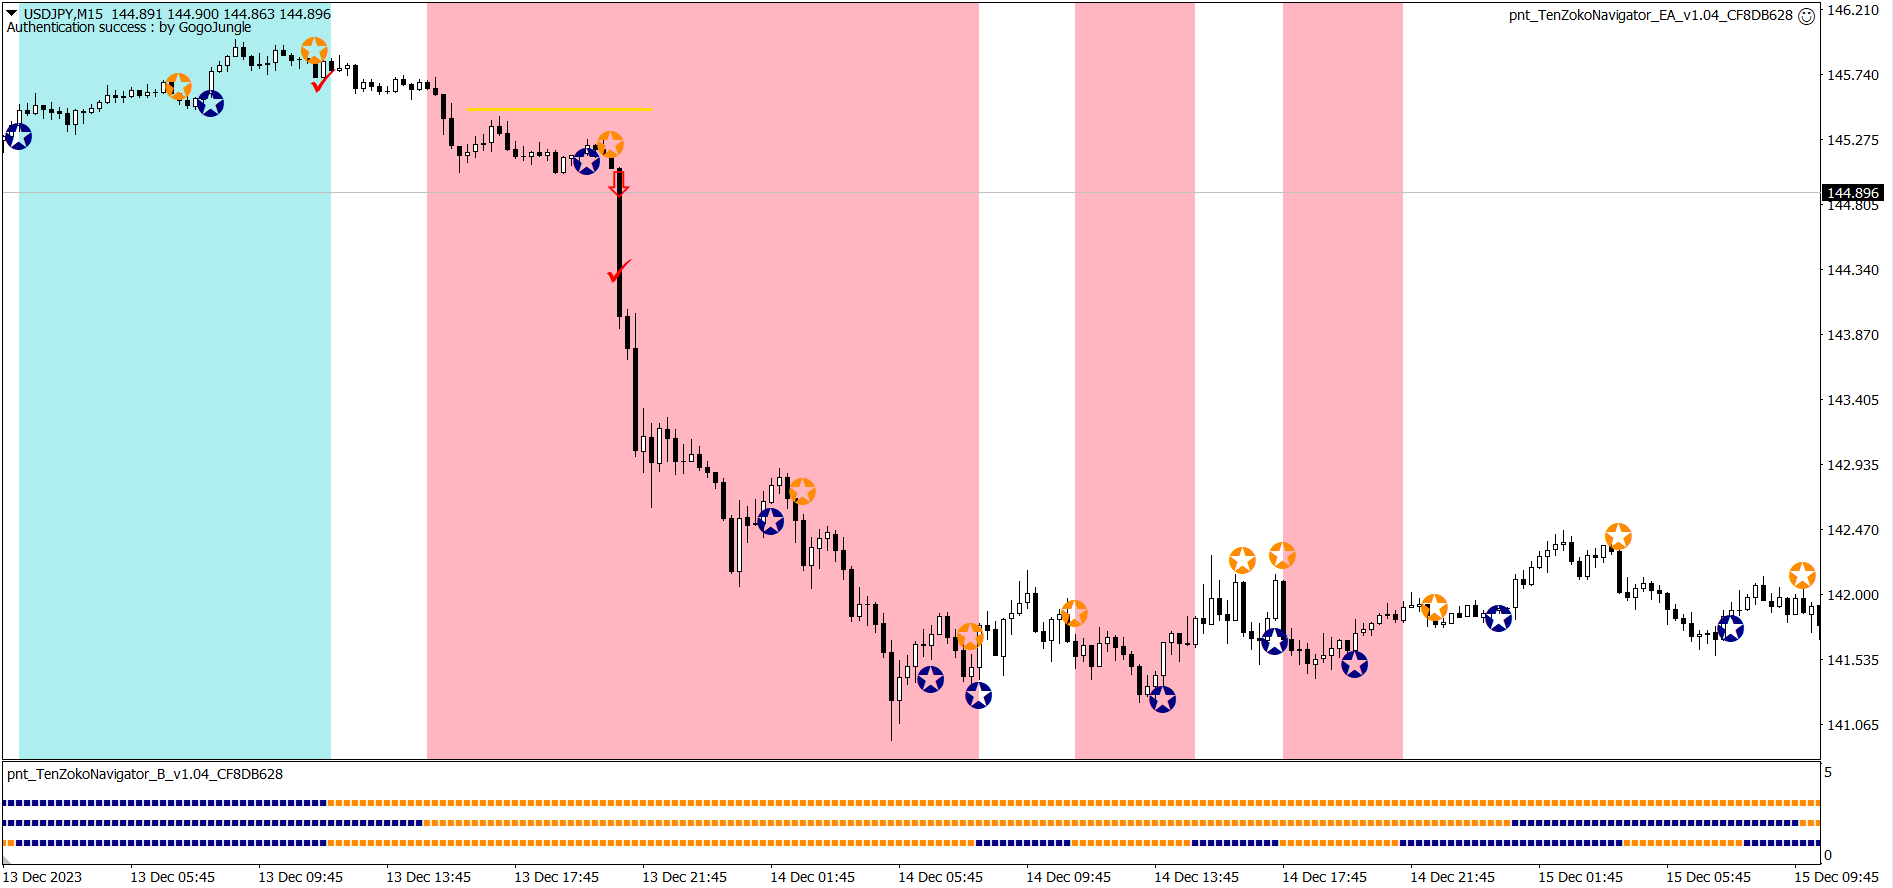
December 14th USD/JPY
Buy +46 pips
※ A pullback-selling pattern. When it extended, the opposite signal appeared, so it exited with a take-profit by an automatic take-profit EA.
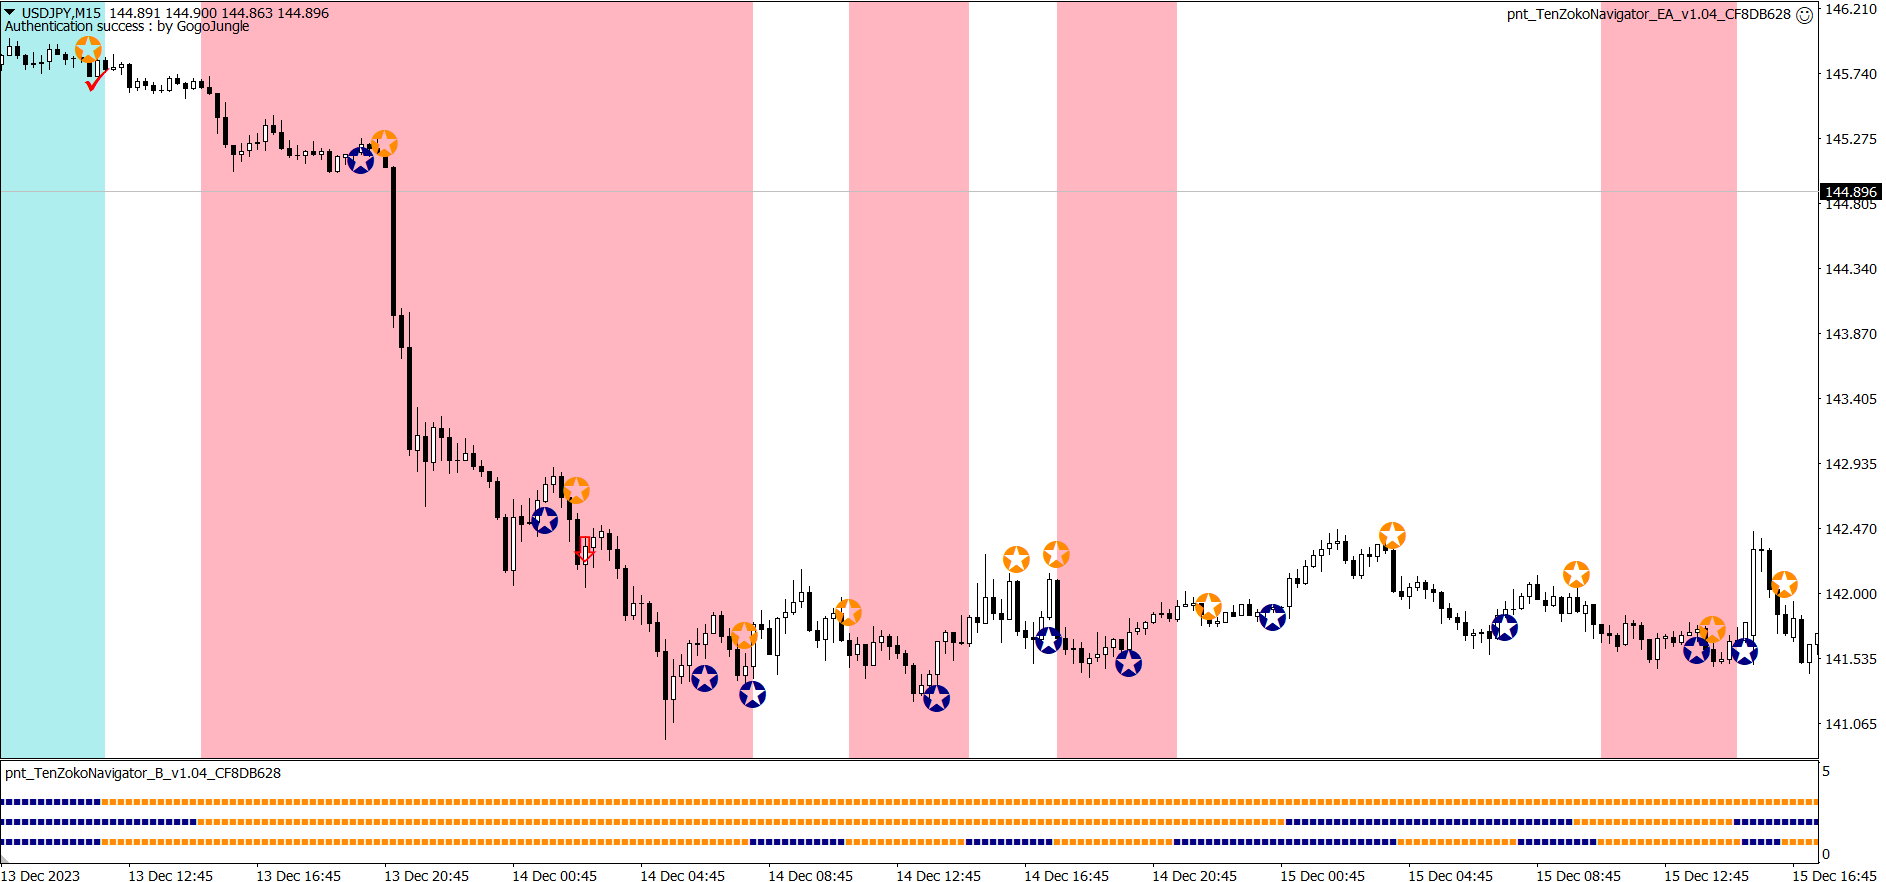
December 14th USD/JPY
Sell -102 pips
※ In a continuing selling trade, a pattern of consecutive pullback sales signals. This is a pattern that hits stop-loss.
※ Already sold twice in a row, it is the third sell trade.
※ In the latter part of the wave, momentum is low, so it would be good to create a filter for that as well.

December 18th USD/JPY
Buy +43 pips
※ A buy trade pattern after three consecutive sells. Closed with automatic take-profit on signal.
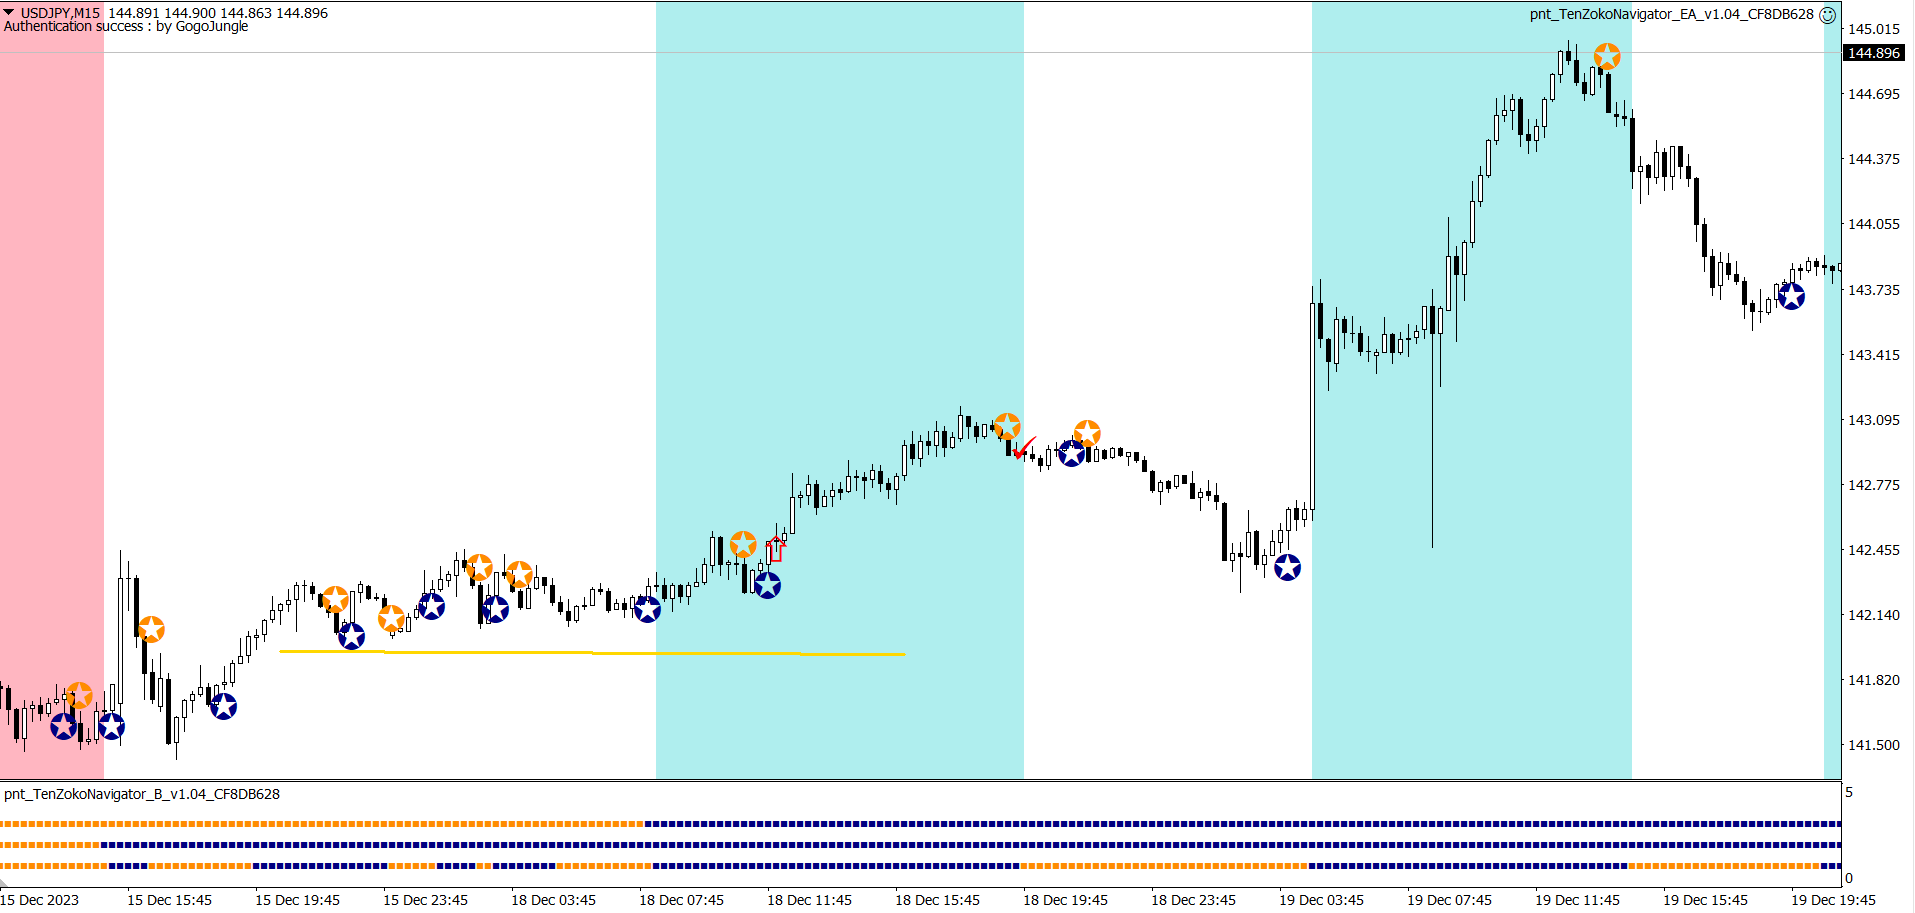
December 20th USD/JPY
Buy -63 pips
※ The higher timeframes were aligned, but it failed to extend and hit stop-loss.
※ In such cases, it is important to properly cut losses as necessary costs.
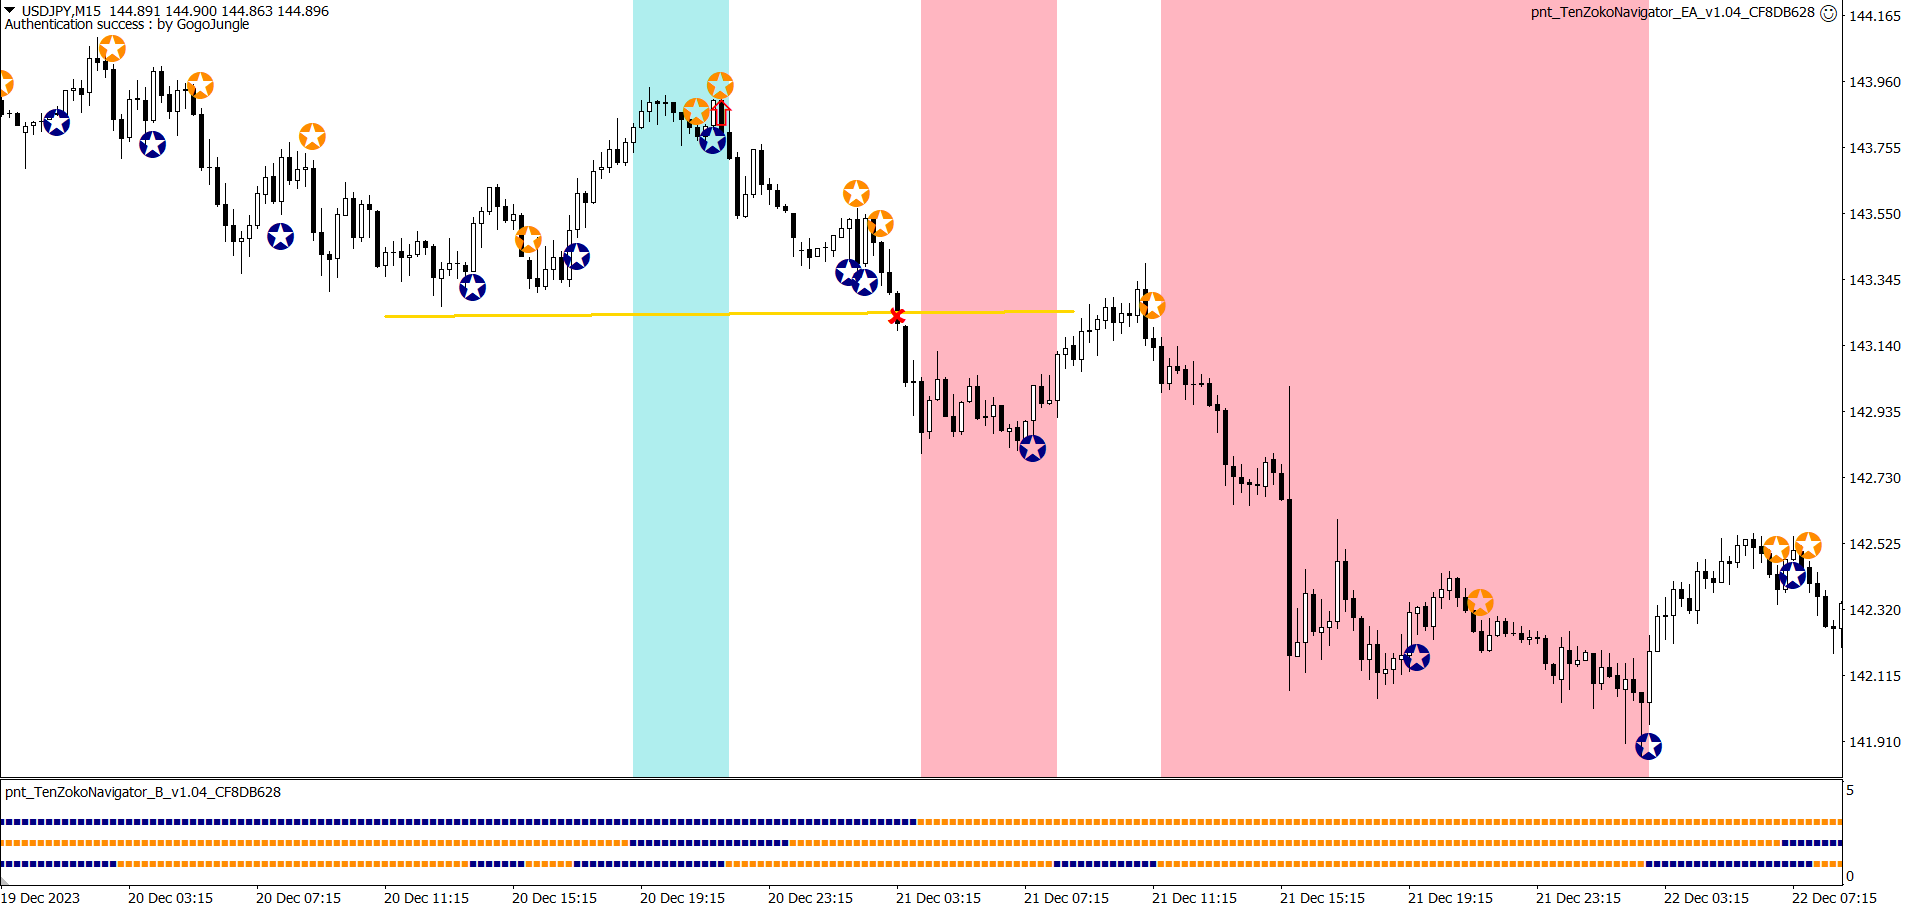
December 21st USD/JPY
Sell +7 pips
※ While the background color remains pink, the downtrend continues and a pullback sell signal appears.
※ It doesn’t extend as hoped, but it exits with a small profit before hitting a stop-loss.
December 27th USD/JPY
Buy +9 pips
※ A buy signal pattern in an uptrend. Exits with automatic take-profit on signal. Also exited with a small profit without full extension.
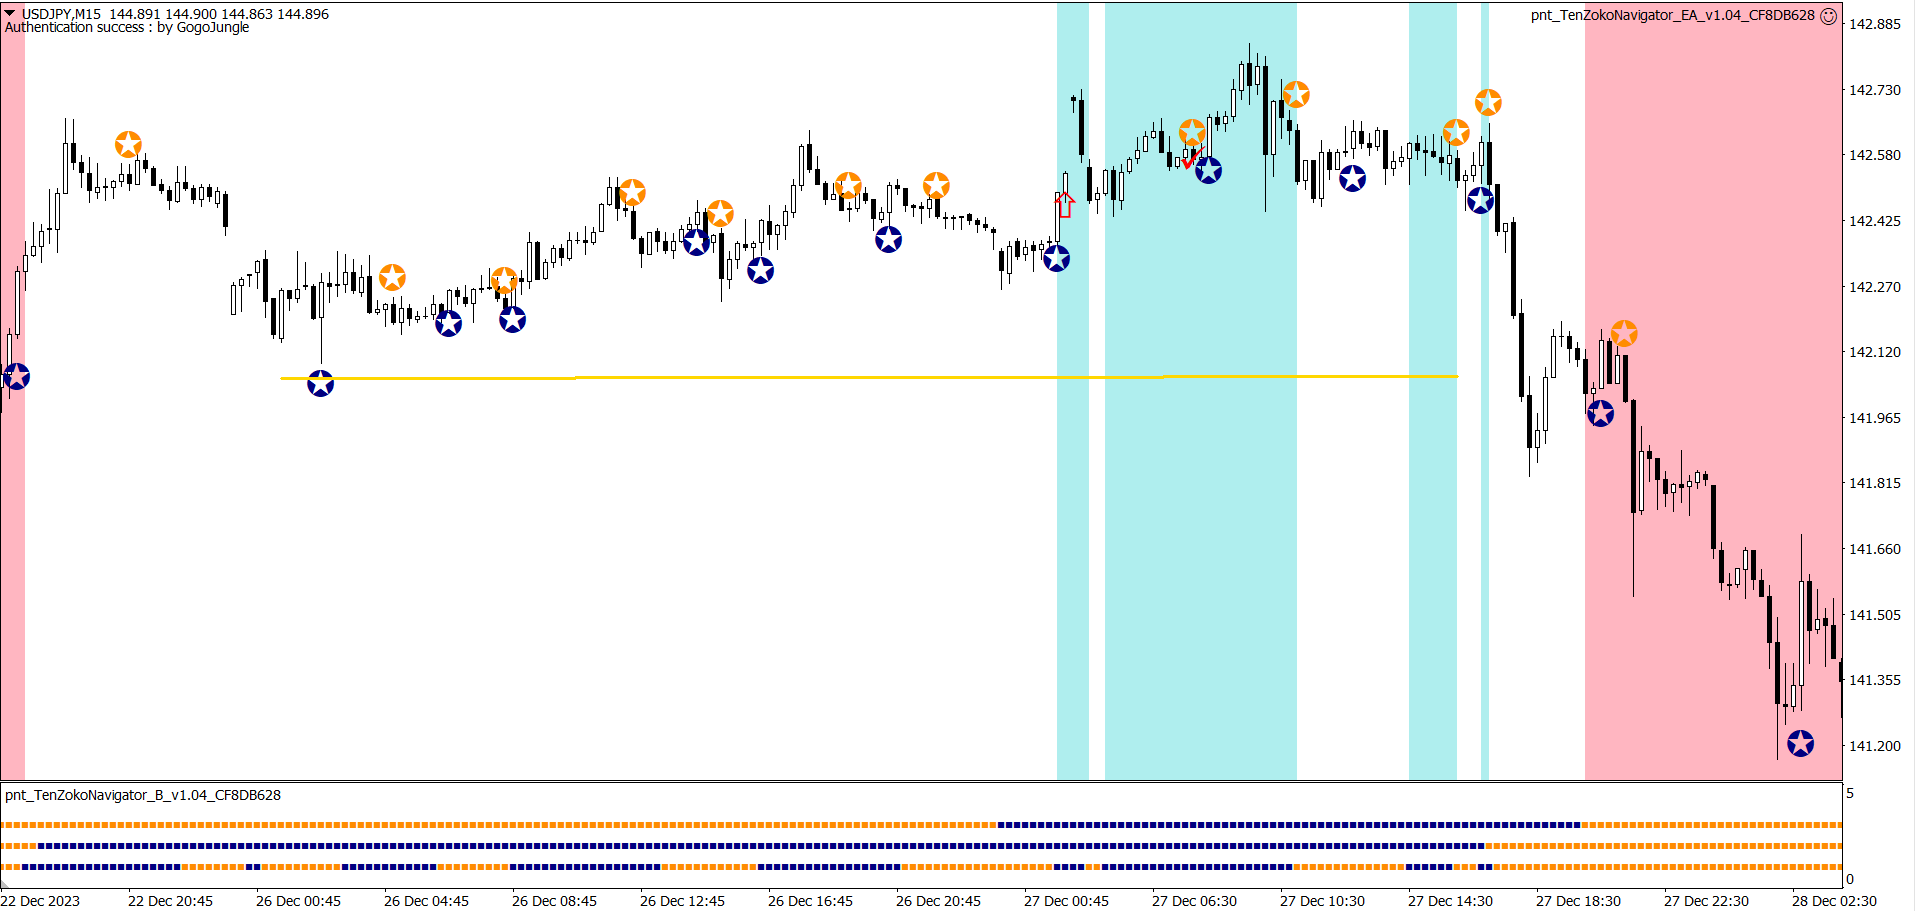
December 28th USD/JPY
Sell +40 pips
※ Trend reversal from the high price range. A sell signal appeared early.
※ Upward-to-downward trend changes have tighter stop-loss and higher win rate, so they are worth aiming for.
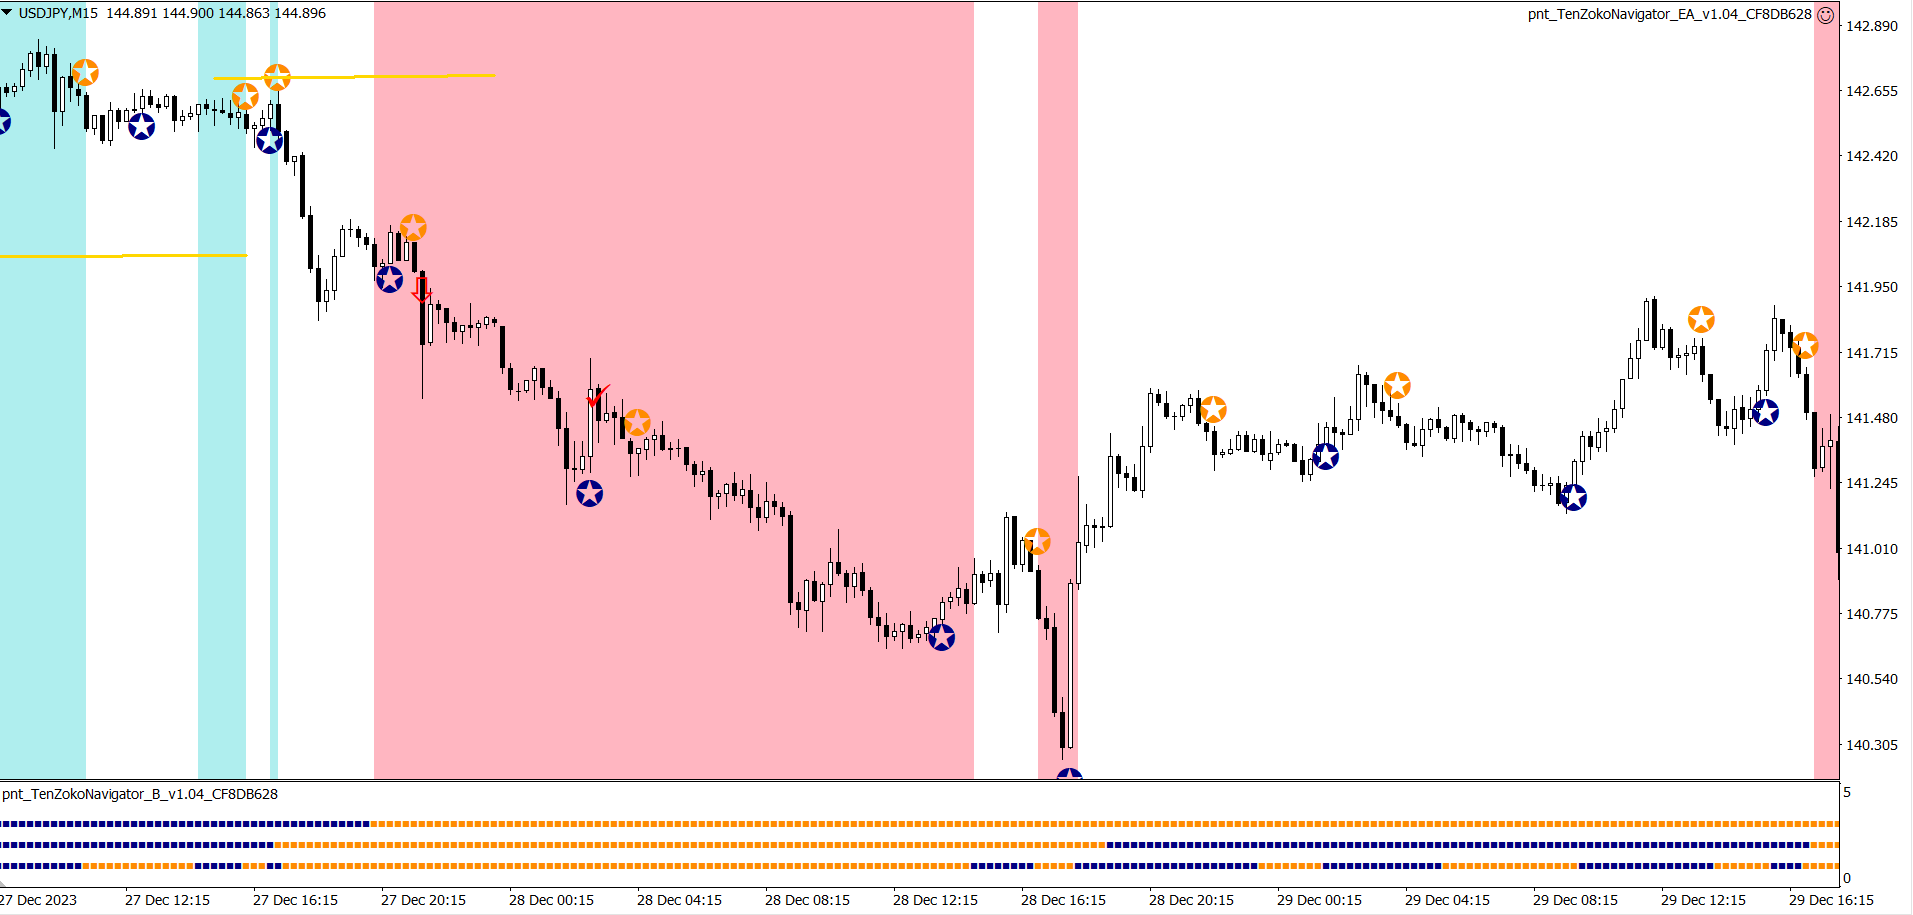
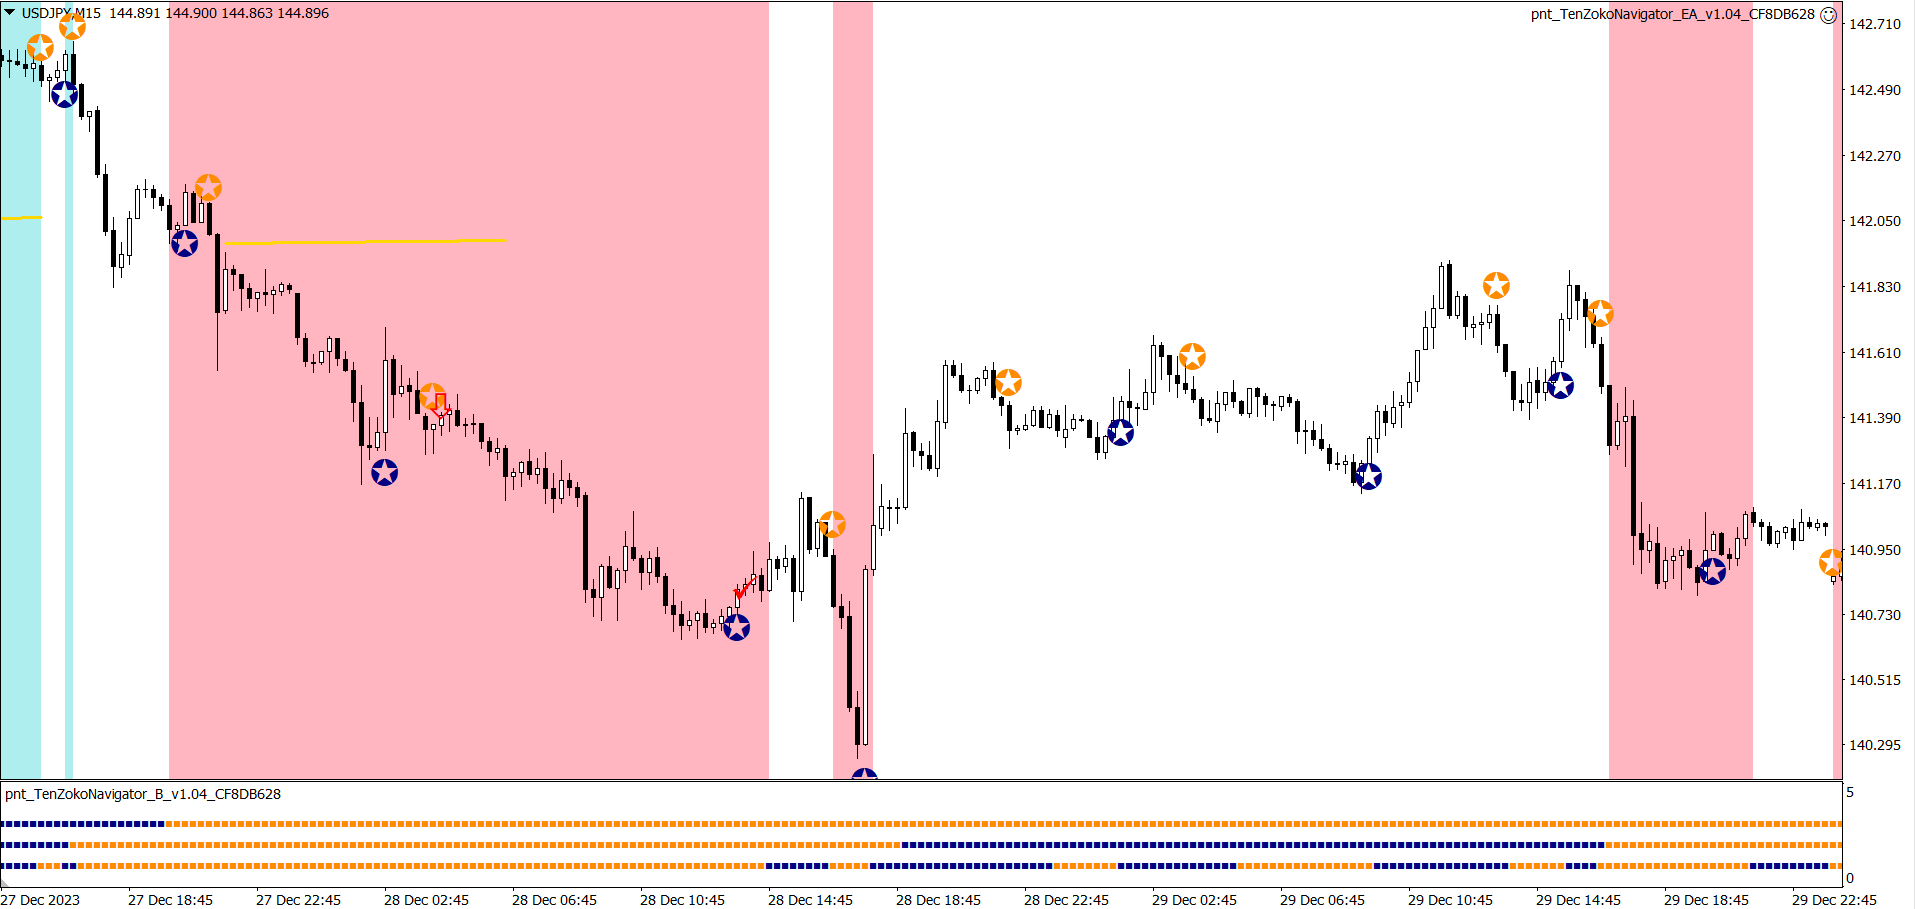
December 28th USD/JPY
Sell +57 pips
※ A clean downward trend is forming.
※ This was also a pullback selling point with good profit potential.
USD/JPY Summary
【Dec 1–28】11 wins, 2 losses, +118 pips
Total for December USD/JPY: 118 pips.
There were 13 trades in total. Not even once every two days on average.
December lacked a strong trend, and multi-timeframe indicators helped to narrow trades considerably.
Even if you cannot trade every time, there are relatively many opportunities, so gradually accumulate trades.
USD/JPY Summary
【November】10 wins, 8 losses, +203 pips
【December】11 wins, 2 losses, +118 pips
From a monthly perspective, trends appear clearly at the 15-minute level, so please focus on trading consistently where the trend is visible.
Please continue to gather data through verification!
↓↓↓The indicator that is very popular on Gogojan is here↓↓↓

That is all for now.
I would be happy if this could be of some help to everyone’s trading.