

Usage of the “Visualization Indicator” (Part 129)
Usage of the "Visualization Indicator" (its129)
1. Further development of the "28 Currency Pairs List Indicator" and indicators
“8CPVisualization Indicator”to drawEURJPY.
There are versions of the "8CPVisualization Indicator" such asOceania版,London版,” enables drawing sloped downward lines, and when broken upward, automatically buys, and when the rising line is broken, automatically closes the trade, enabling passive trading.NewYorkAnyCP版. This time, the01:41London版 was used.
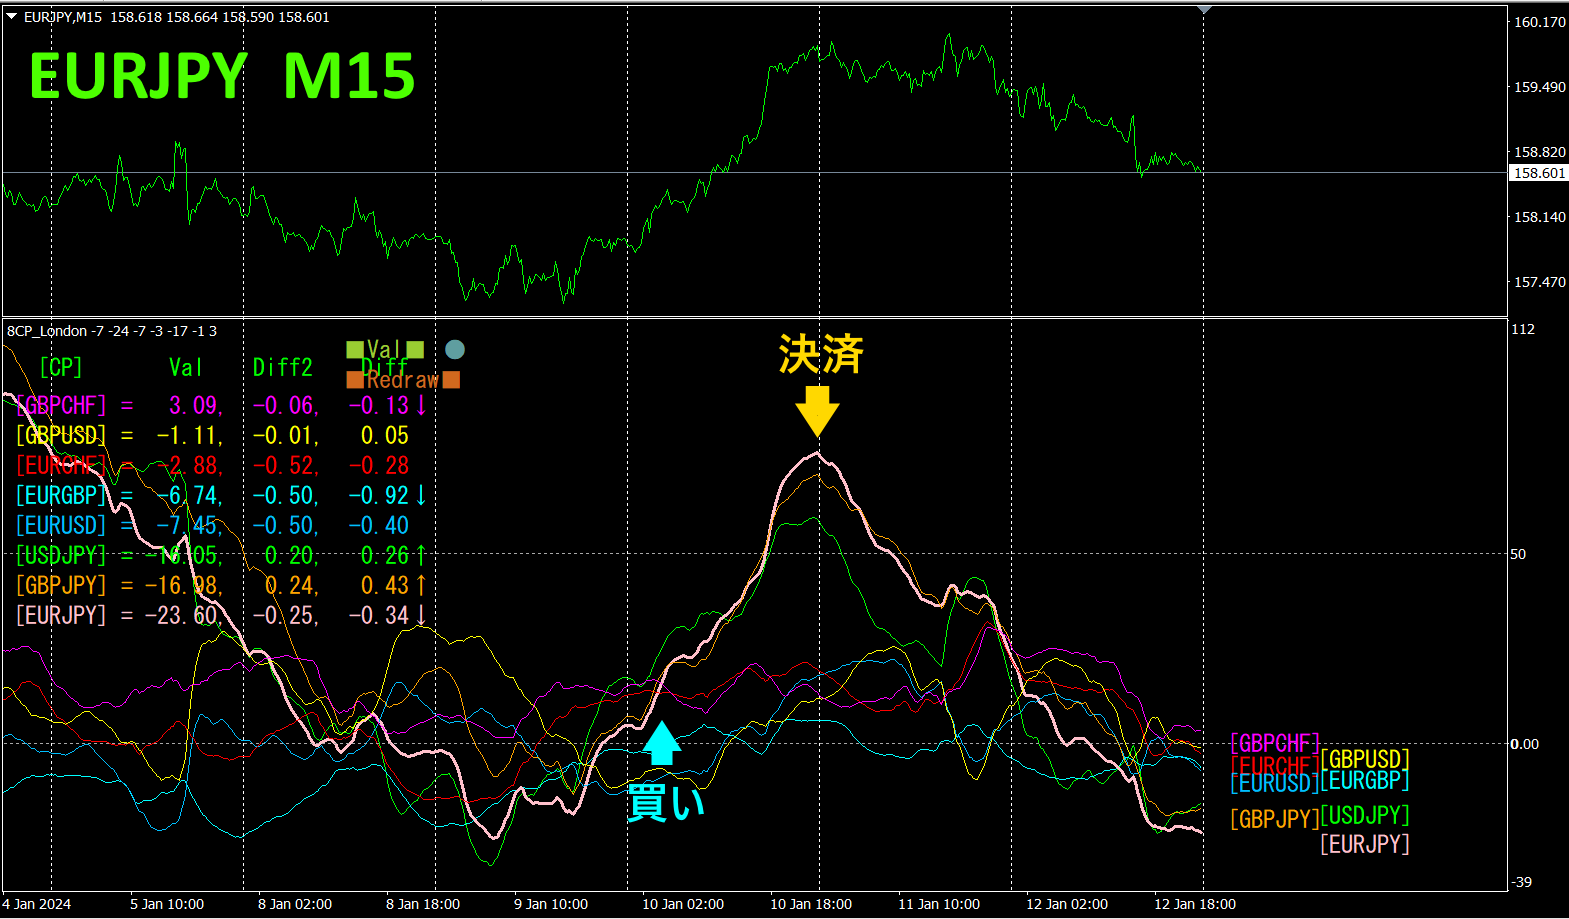
The top half shows theEURJPY 15-minuteminute chart. The bottom half is from the “8CP Visualization Indicator”; the pink thick line chart corresponds toEURJPY.
On Wednesday,EURJPY broke upward through the cluster of charts, so we entered a buy. The next day, we closed the position at the peak where it reversed.About190pips of profit was earned.
As the chart shows,GBPJPY andUSDJPY also yielded profits from long positions.
With the “8CPVisualization Indicator,” you can focus on the most active currency pair movements to trade efficiently.
2. Best SelectTry the indicator
The figure below is a screenshot taken onJanuary 12, 2024 (JST)).
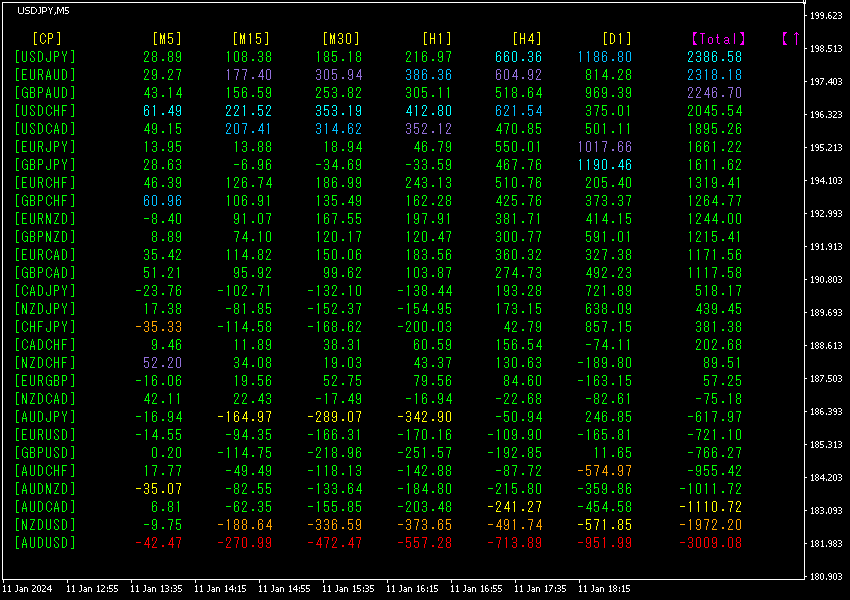
TotalSorting by descending numeric value. The lowest row showsAUDUSD, which is in red on all timeframes, and theTotal value is-3009.08, a large negative number. This indicates a downtrend forAUDUSD.
Now, look at the AUDUSD chart.
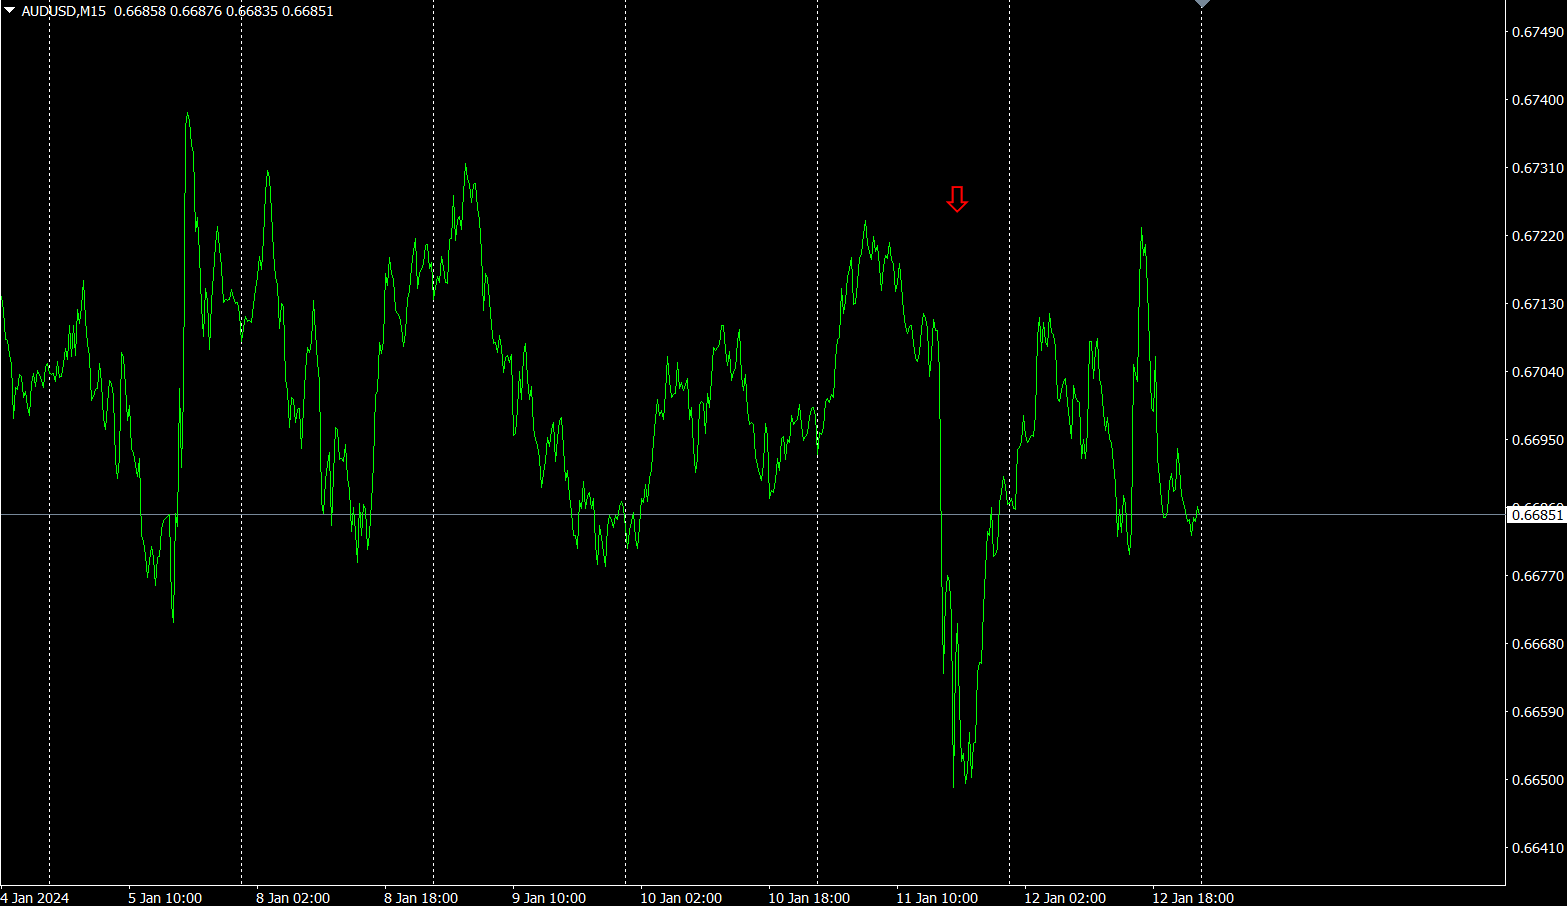
The red arrow marks the point of the screenshot, capturing a sharp drop.
“28 currency pairsBest Select indicator” allows you to easily identify which currency among the 28 pairs is currently in the strongest trend. It also tells you whether to trade now via numeric and color cues. It is an excellent indicator for assessing all currency pairs at a glance.
“28 currency pairsBest Select indicator”
https://www.gogojungle.co.jp/tools/indicators/35128

3. 2021Year5month onward, what happened withEURJPY? has been tracked.
In2021 year5EURJPY
To view the overall trend, a30-minute chart shows roughly the last about3 weeks.
Last time I wrote the following.
JPY is rising,EUREURJPY is expected to fall.
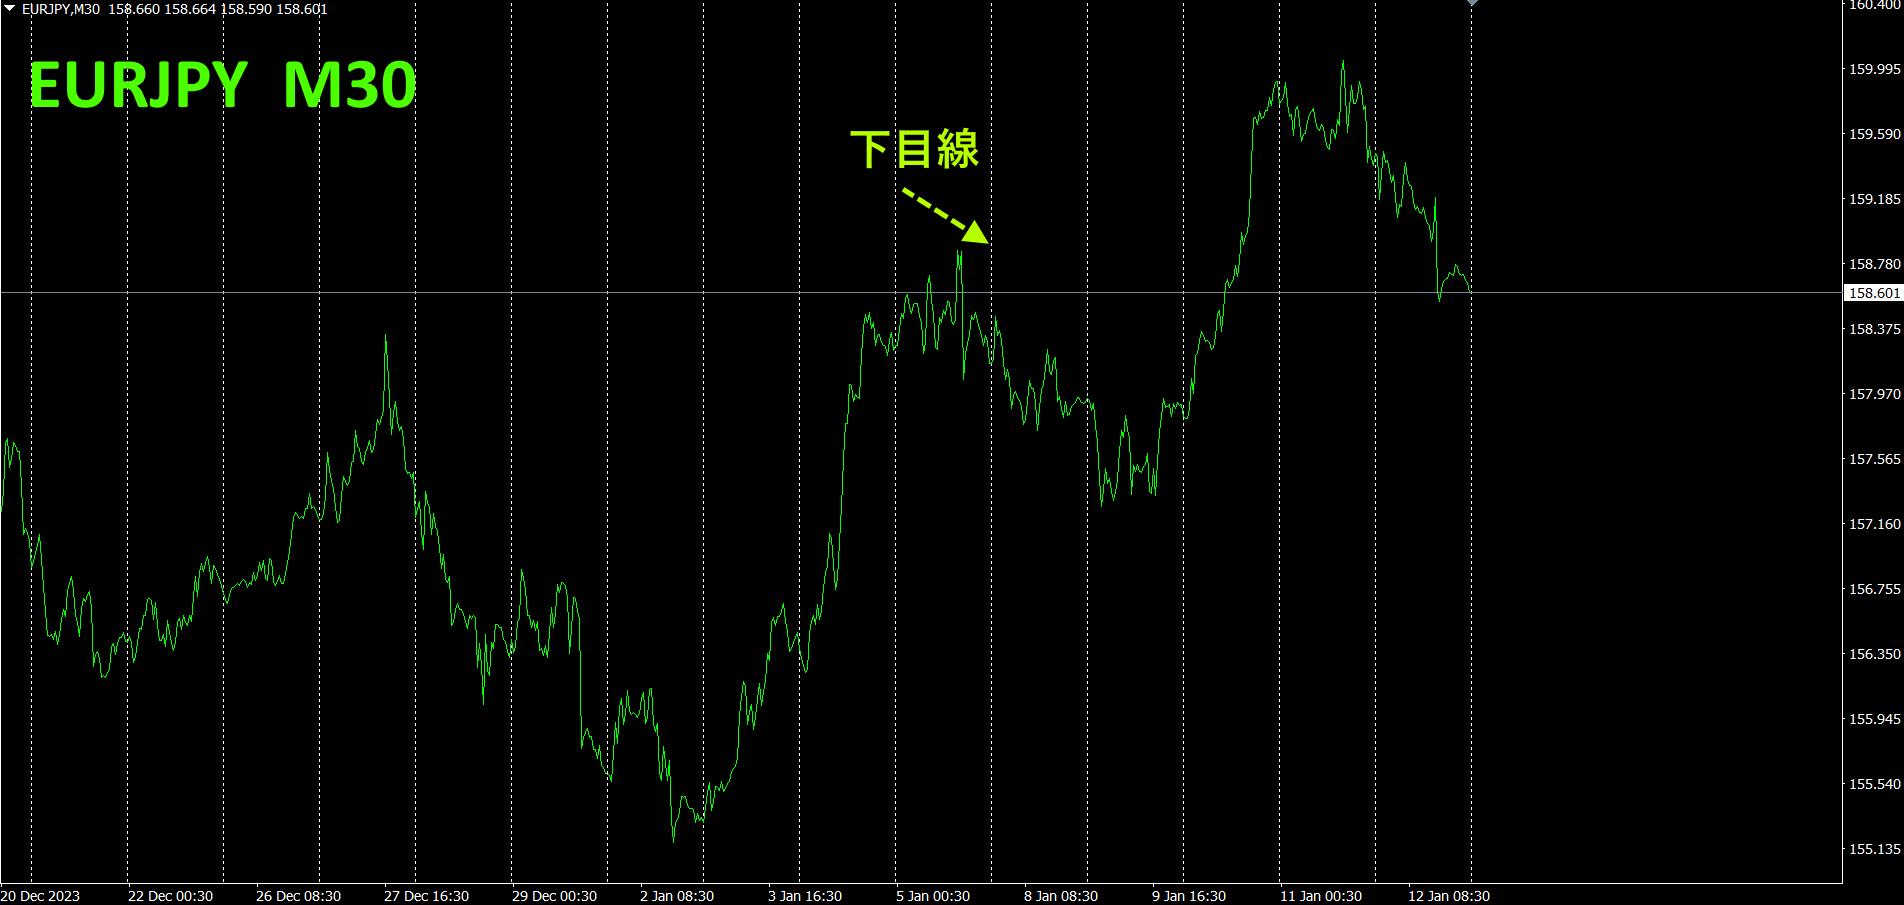
As predicted, it fell slightly. Overall, the upward trend is still evident.
30-minute currency strength chart.
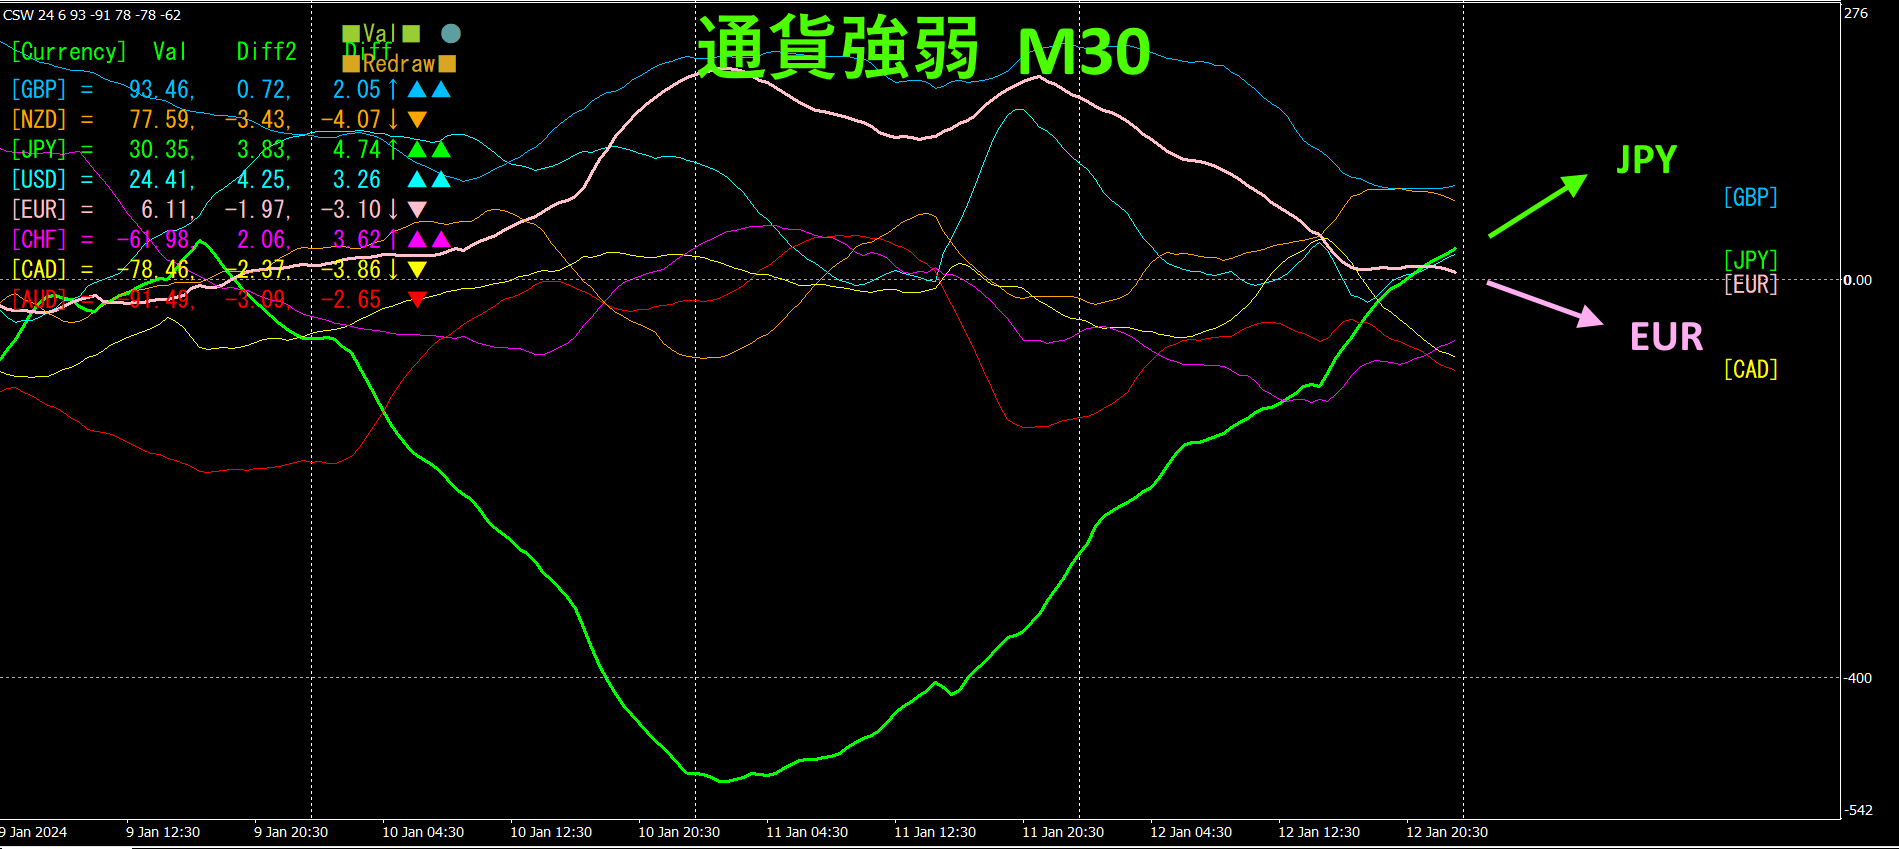
Pink isEUR, green is.JPYJPY is rising,EUR is falling, and from convergence it is moving toward divergence, soEURJPY is expected to fall slightly.
4. Find highs and lows across all currency pairs and build a trend strategy (target isNZDCHF)
2505“High-LowSearch indicator” used to select the currency pair positioned at the bottom,NZDCHF. We aim for an up move from the bottom.
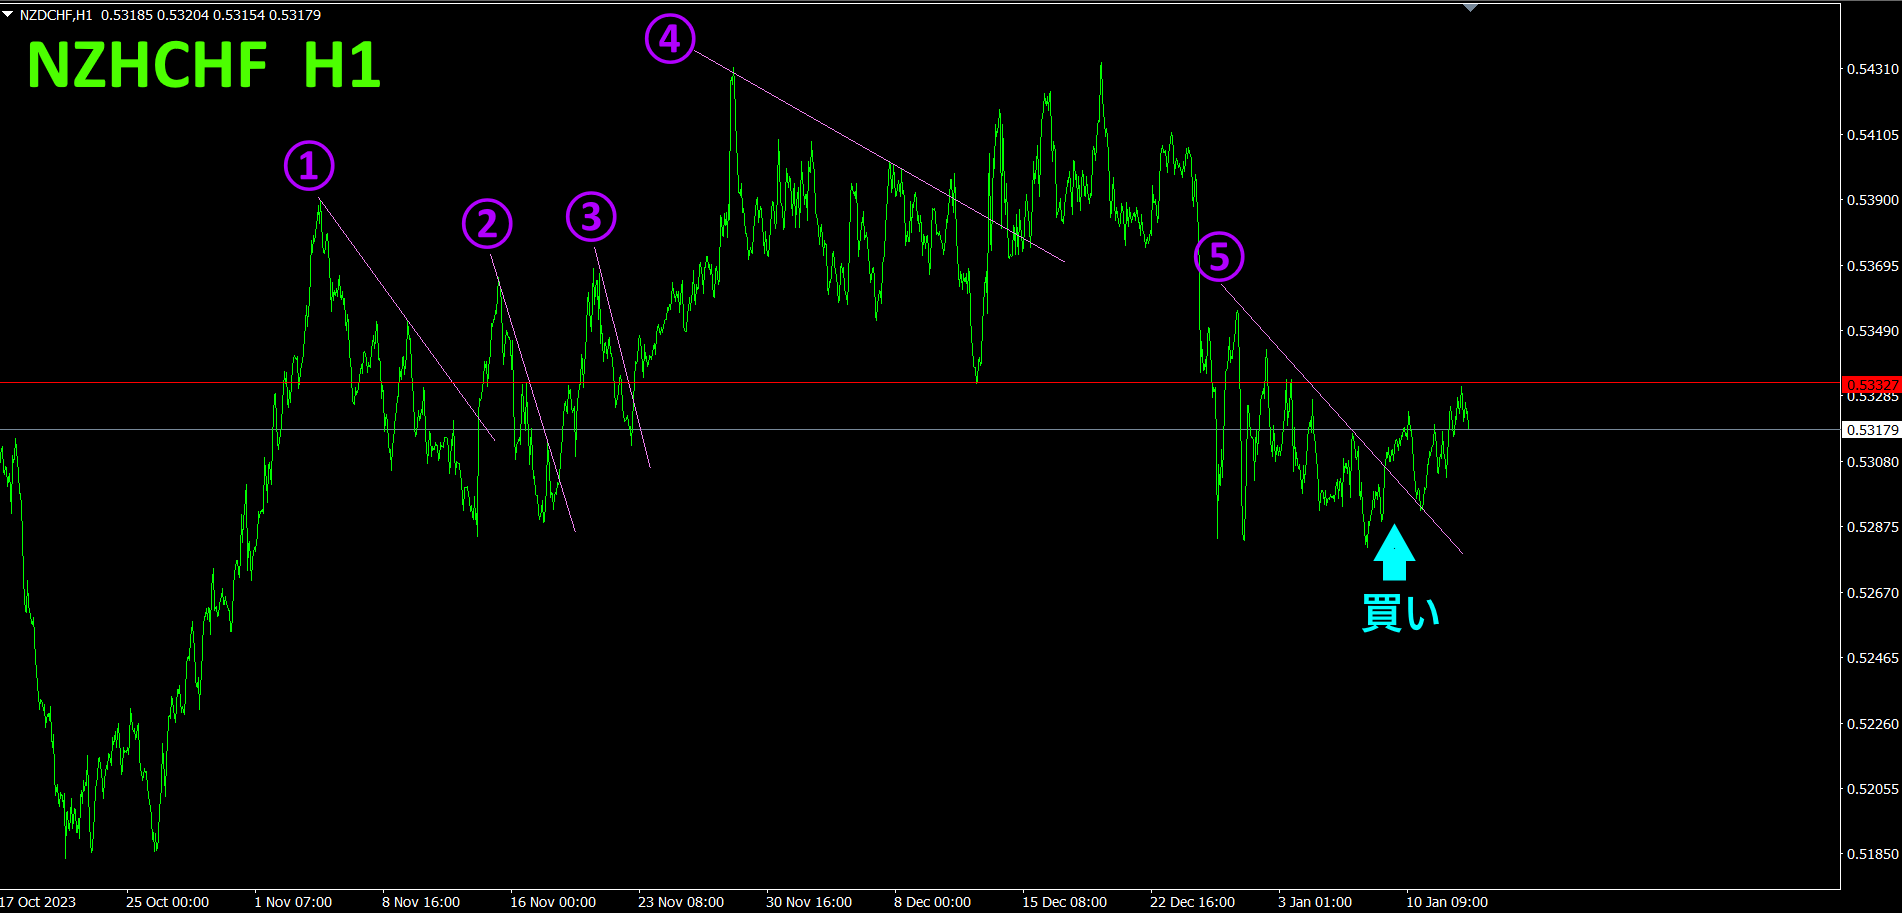
①, ②, ③, ④ breakouts of the descending lines would be bought, and the rising trendline would be broken for exit, repeatedly. At ①,40pips, at ②, at ③, total profit was earned. Since ④ declined, I closed at the entry price.
⑤ I had drawn a descending line, but it broke above this line, so I entered a buy.10pips unrealized profit is growing.
Refer to the 4-hour currency strength chart.
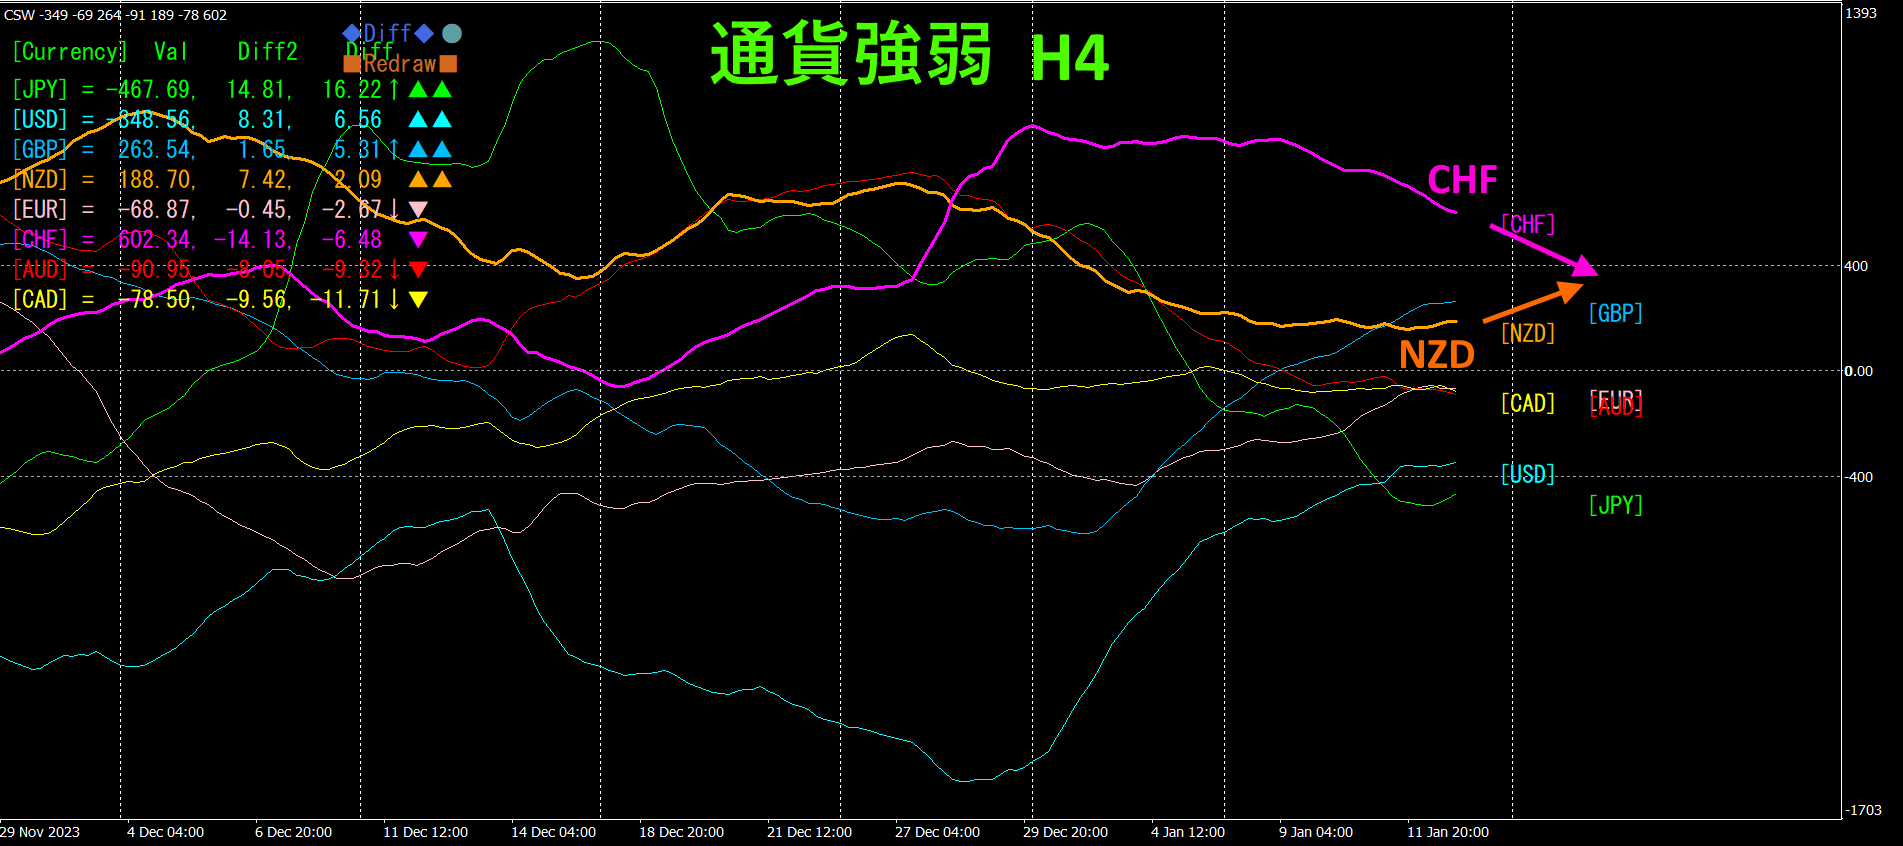
Red-purple isCHF, orange isNZD. is trending downward,NZD is trending upward. Finally, the rise ofNZDCHF begins.
By comparing standard FX charts with currency strength charts simultaneously,, allowing confident trading.
Semi-automaticEA’s “Trend Line EX
“Trend Line EX”

https://www.gogojungle.co.jp/tools/indicators/42257
If you are interested in the “8C currency strength visualization indicator
MT4 version https://www.gogojungle.co.jp/tools/indicators/39150
version https://www.gogojungle.co.jp/tools/indicators/39159
【My listed products】


