

EA without curve fitting by optimization
■ Introduction
・In an EA optimized using Strategy Tester, even when backtest results are good,
there are many EAs that do not perform in forward testing as they did in the backtest.
・This is the phenomenon often referred to as over-optimization or “curve fitting.”
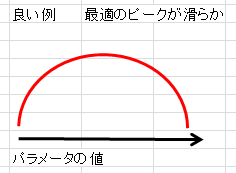
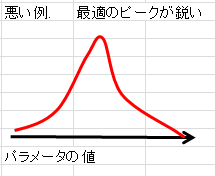
■ What is Curve Fitting
・Curve-fitting optimizations occur when, for the parameter values,
the profit peak is sharp or there are two peaks, which tends to happen.

■ EAs with strong curve-fitting tendencies
① Low number of trades
・With a small number of trades, parameters are optimized to fit those few trades,
which makes curve fitting more likely.
② Short backtest period
・Even with a short period, curve fitting is more likely in the same way.
③ Using martingale or averaging down
・A method that increases lot sizes gradually with martingale or averaging down to greatly raise win rate
but, especially when the backtest period is only a few years, there are parameter combinations that avoid large drawdowns.
・When looking at those backtest results, a clean, upward-sloping equity curve appears,
so one may be tempted to think “this is amazing.”
・However, there are future times when increasing averaging down will not yield profits.
At that time a large drawdown occurs, wiping out the assets accumulated until then.
④ Stop-loss width is much larger than take-profit width.
・By widening the stop-loss and narrowing the take-profit, win rate can be greatly increased, and
as with martingale and averaging down, a nice upward equity curve may appear in backtests,
which is tempting to jump on.
・However, there will be times in the future when consecutive losses occur.
In such cases a large drawdown happens and you lose the accumulated assets all at once.
■ Pseudo-Forward Test
・A pseudo-forward test can be used to determine whether curve fitting is present.
This is a method employed by MT5.
・I will introduce an example using my upcoming EA “Senju-Banko” that I developed.
・During the first 10 years of the past 12 years, optimization was performed with Strategy Tester,
and then the same parameters were forward-tested for the remaining 2 years with Strategy Tester to verify performance.
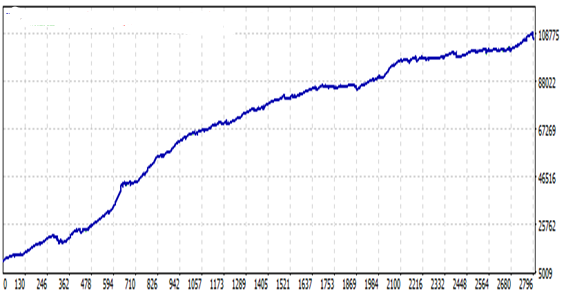
<10 years of backtest>
・Period: 2006.08.01 - 2016.08.01
・Net profit: 96,342
・Average annual return: 96.3%
・Maximum drawdown: 3,692
・Profit factor: 2.04
・Expectancy: 34.51
・Win rate: 73.50%
・Total trades: 2,792 (273 per year)
<2 years forward test>
・Period: 2016.08.01 - 2018.08.01
・Net profit: 13,014
・Average annual return: 65.1%
・Maximum drawdown: 3,388
・Profit factor: 1.77
・Expectancy: 25.42
・Win rate: 70.90%
・Total trades: 512 (256 per year)
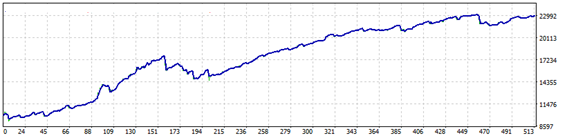
・Although the profitability and win rate and number of trades drop slightly, the profit is clearly
present/realizable.
That is all.