

Utilization of "Visualization Indicators" (Part 128)
“Visualization Indicator” usage (part128)
1. Further develop the “28 Currency Pair List Indicator” into a more advanced indicator
“8CP Visualization Indicator” to plotUSDCHF
The “8CP Visualization Indicator” includesOceania edition,London edition,NewYork edition,AnyCP edition. This time, we used theLondon edition.
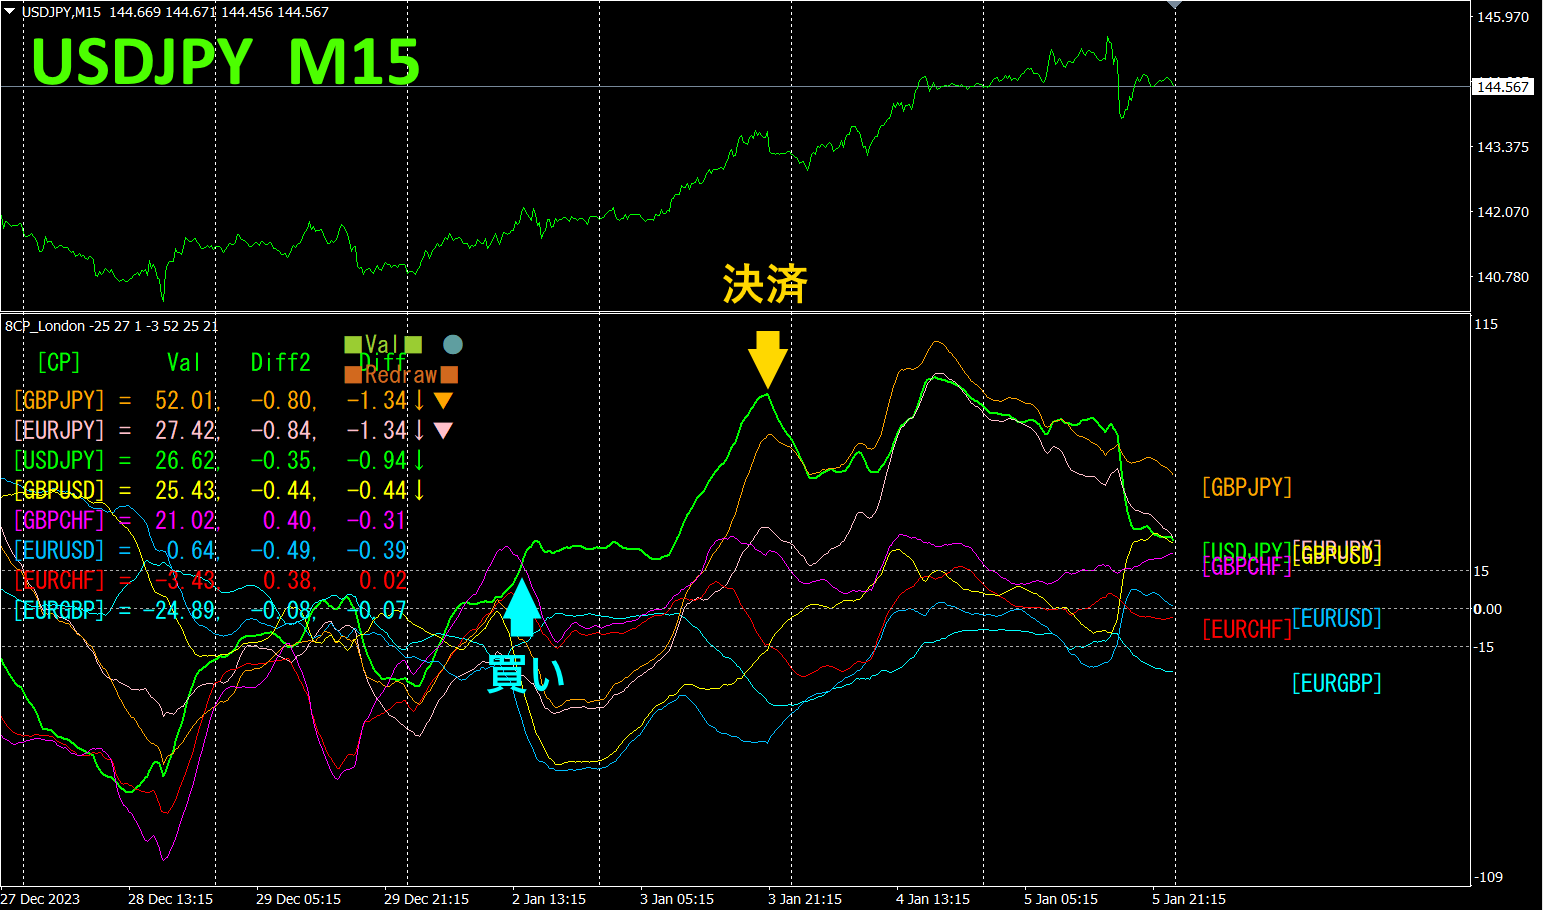
The top half is a 15-minute chart ofUSDJPY. The bottom half shows data from the “8CP Visualization Indicator”; the green bold line graph corresponds toUSDJPY.
On Tuesday,USDJPY broke above the group of graphs, so we entered a buy. The next day, we exit at the peak where it reverses.Approximately180pips of profit was earned. With the “8CP Visualization Indicator,” by focusing only on the currency pair with the most movement, you can trade efficiently.
2. Best Select Try the indicator
The image below is a screenshot taken on2024 yearJanuary4th, 00:43 (JST)
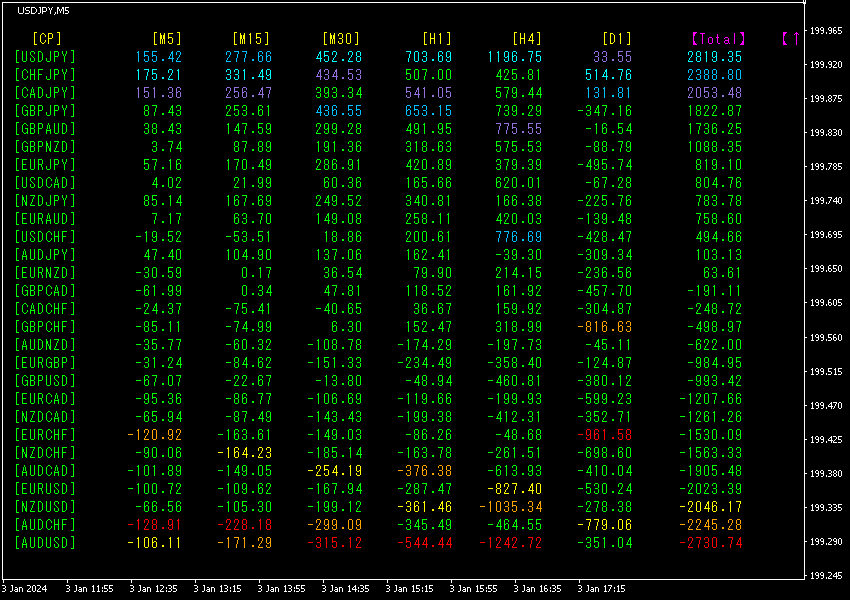
values are sorted in descending order. The top-most row forUSDJPY shows blue in all timeframes, and value is +2819.35, indicating a rising trend for.
Now, let's look at the USDJPY chart.
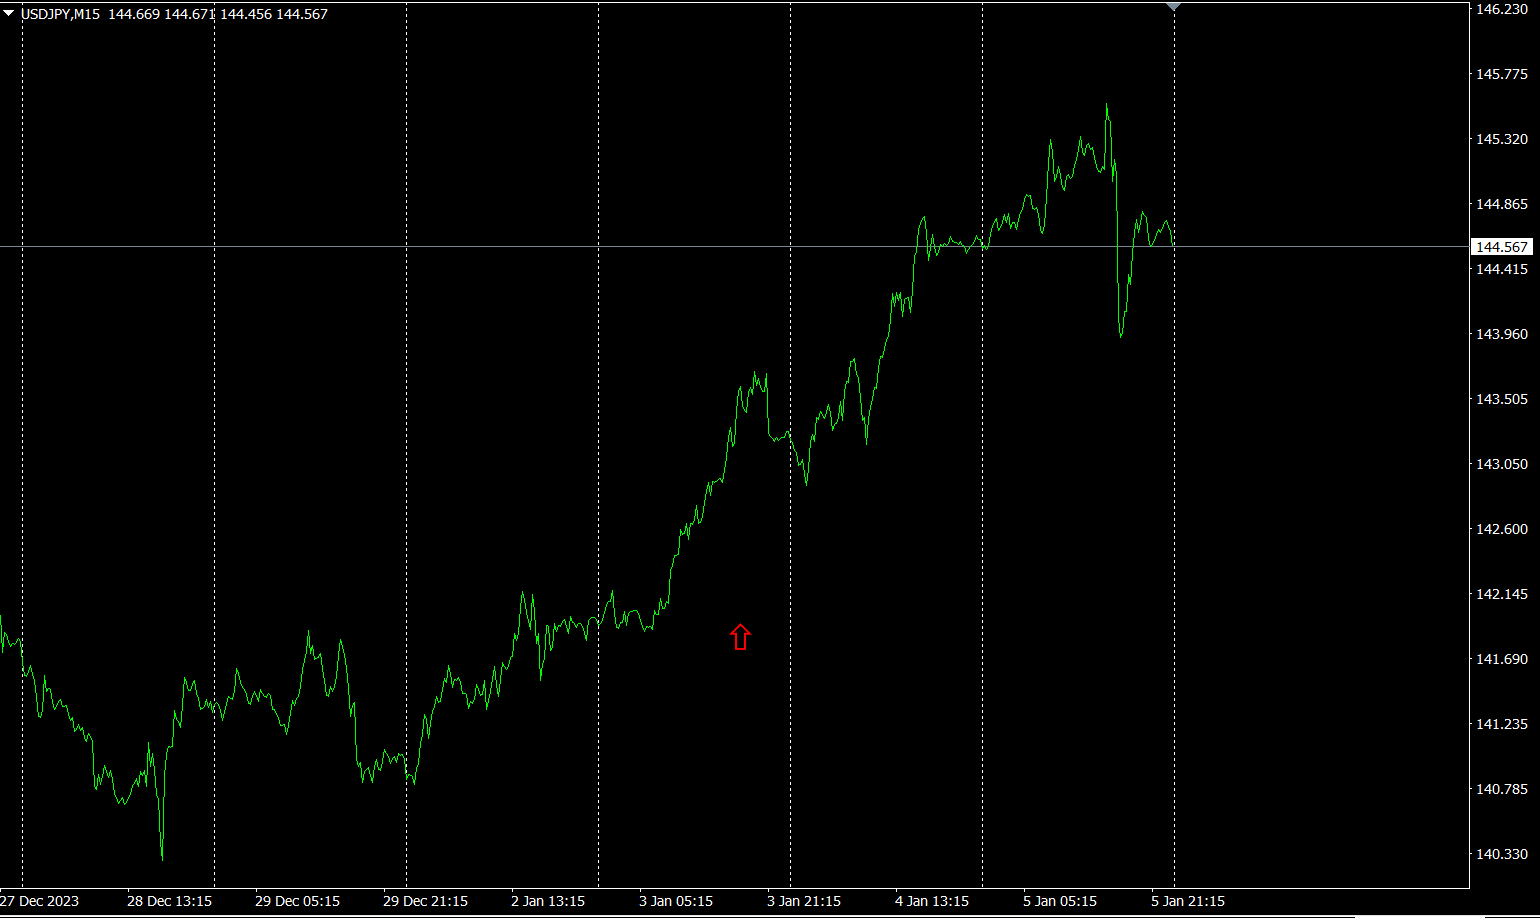
The red arrows mark the spot where the screenshot was taken, capturing a sharp rise.
The “28 currency pairs Best Select indicator can easily identify which currency is currently in the strongest trend among 28 pairs. It also tells you whether you should trade now via color and numeric signals. It’s an excellent indicator for quickly assessing all currency pairs at a glance.
The “28 currency pairs Best Select indicator”
https://www.gogojungle.co.jp/tools/indicators/35128

3. 2021 year May month onward,EURJPY movement has been tracked.
year May month onward,EURJPY
To view the overall trend, a 30-minute chart covering roughly the last weeks is drawn.
Previously, I wrote as follows.
JPY is rising,EUR is falling, and they are diverging, soEURJPY is expected to fall.
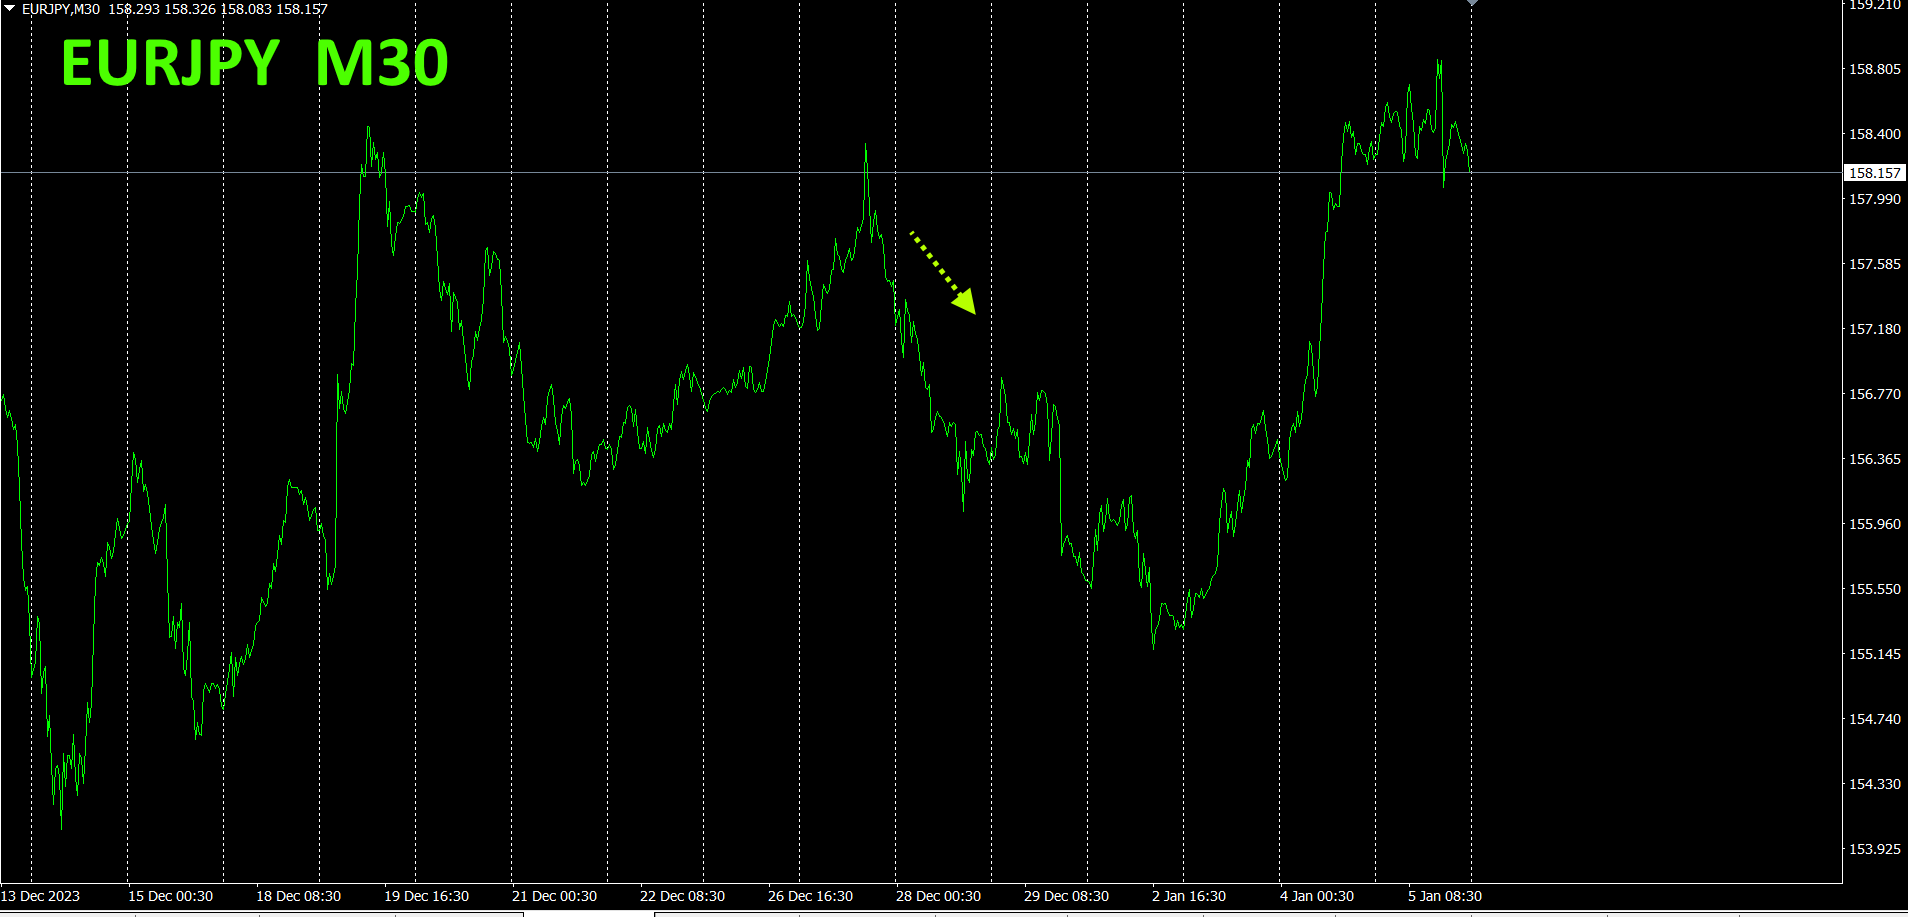
As expected, it fell a bit. Since then, it has reversed and risen.
A 30-minute currency strength chart.
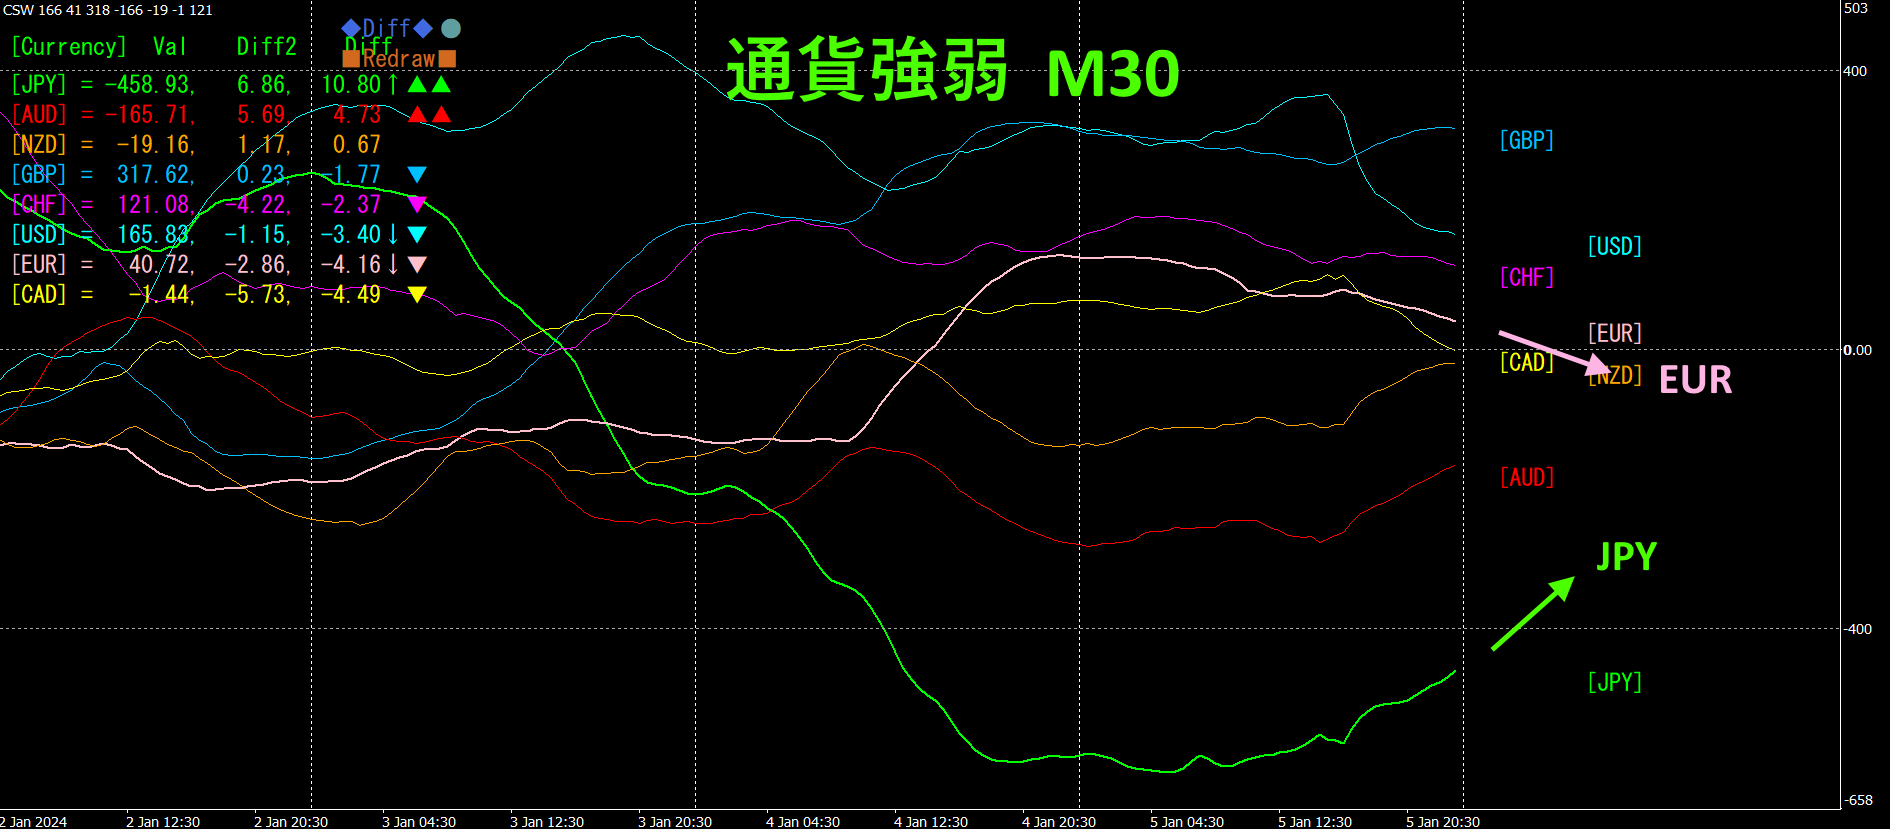
Pink showsEUR, green showsJPY.JPY is rising,EUR is falling, and they are converging, soEURJPY is expected to fall.
4. Find tops and bottoms from all currency pairs and build a trend-following strategy (target:NZDCHF)
2505“Top-Bottom Search Indicator” was used to select the currency pair positioned at the bottom,NZDCHF
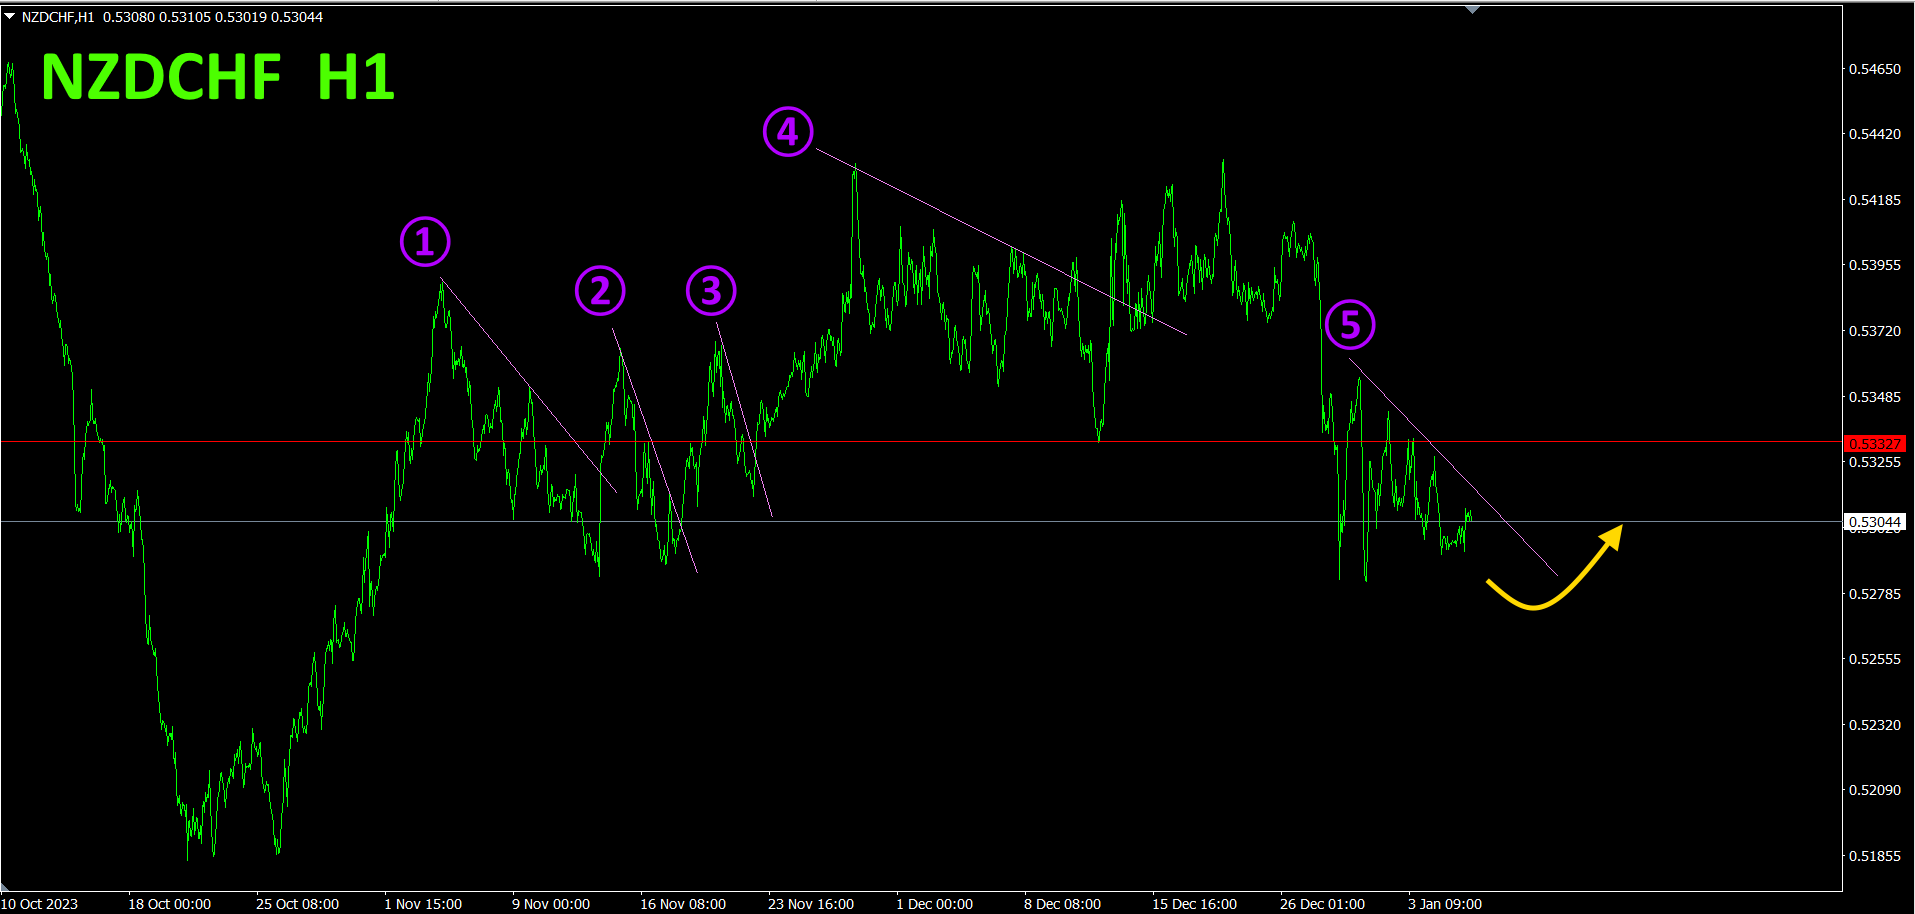
When lines ①, ②, ③, ④ are broken upward, we buy; when the upward-trend line is broken, we exit. We have repeated this: ① about40pips, ② about60pips, ③ about58pips, totaling158pips profit. The fourth (④) declined, so we exited at the entry price.
I will draw the fifth downward line (⑤) and, if it breaks above it in yellow, I will open a new long position. For now, I am waiting.
Refer to the 4-hour currency strength chart.
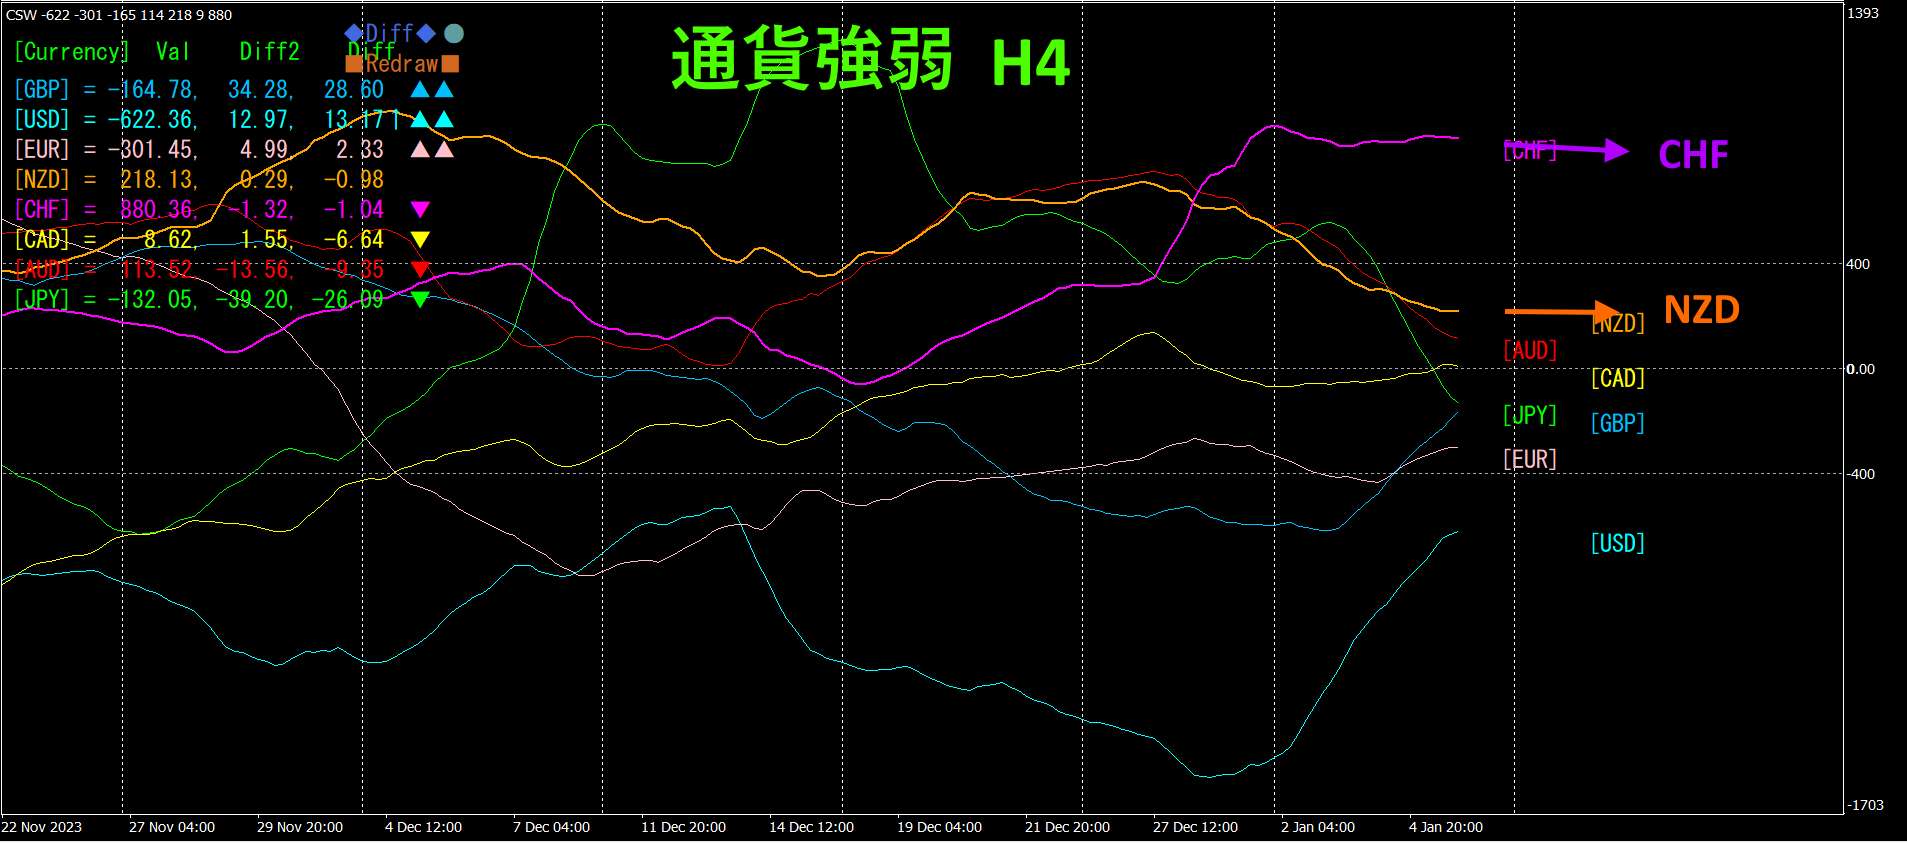
Red-purple isCHF, orange isNZD.CHF andNZD are roughly flat to slightly downward; ifNZDCHF reverses upward, will rise.
With a semi-automaticEA, the “Trend Line EX” allows you to draw a diagonally descending line; when it breaks above, it automatically buys, and when a rising line is broken, it automatically exits, enabling a passive trading style.
※“Trend Line EX

https://www.gogojungle.co.jp/tools/indicators/42257
If you are interested in the “8C currency strength visualization indicator,” please refer to the following page.
MT4 edition https://www.gogojungle.co.jp/tools/indicators/39150
MT5 edition https://www.gogojungle.co.jp/tools/indicators/39159
【My listed products】


