

Surprise!! FX beginners must see. Start by knowing your own probability of ruin
Day trading is all about the "profitability ratio"!
To succeed in day trading, you need not only technical analysis but also
probabilistic thinking and money management.
Even if the technical buy/sell signals are excellent,
if you do not understand these elements, it will be difficult to
maintain stable performance.
In day trading, you must clearly define the points at which you will lock in profits or cut losses
before you enter a trade.
It's too late after you have entered.
For example, to "take profits at a given level of price movement"
"if the price moves against you to this point, the entry signal will
be invalid, so you cut your losses"
—it's important to set such rules in advance.
The trading steps are always the following three.
1. Form a strategy
2. Enter
3. Close the trade (take profit or cut losses)
These three should be decided before you enter.
And the tip to dramatically improve your trading results is to
at the stage of forming the strategy, cultivate the mindset to raise the reward-to-risk ratio.
Why calculate the profitability ratio? Because
you can use the profitability ratio to calculate your "probability of ruin."
Your method of calculating profitability and your ruin probability are...
Profitability ratio is the ratio of the profit width (pips) to the loss width (pips).
For example, suppose you assume a trade where you take profit at +40 pips and stop loss at -20 pips.
In this case, "40 ÷ 20 = 2," so the profitability ratio is "2."
If the profit width is +40 pips and the stop loss is -40 pips, the profitability ratio is 1.
Thus, by calculating the profit and loss widths, you derive numbers like 1 or 2.
Trades accumulate daily, becoming enormous in number.
If you make 30 trades in a week,
you can calculate the average profit width of winning trades and the average loss width of losing trades, and divide them.
Profitability ratio = average profit (pips) ÷ average loss (pips)
This shows what kind of trades you conducted in a week. Rather than calculating amounts like 1000 yen or 5000 yen,
it is important to calculate in pips.
Why calculate profitability ratio? Because you can compute your "probability of ruin" from it.
Many people are startled by the term ruin probability, but conversely,
it also reveals how to avoid ruin, i.e., how to keep winning.
Note that profitability ratio is also called the "payoff ratio" or "risk-reward ratio."
To derive ruin probability from profitability ratio, use the "VaR ruin probability table" (Kelly/Balser table).
This is an essential concept for day trading.
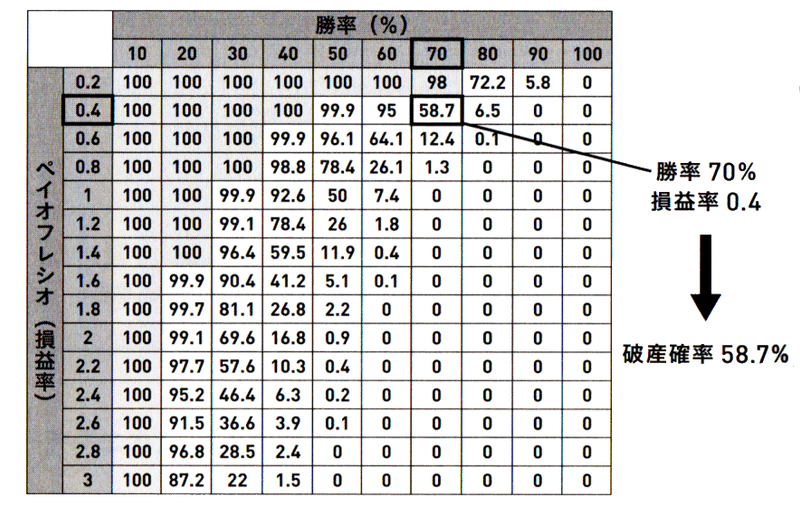
How to read this table is to compute your profitability and win rate from your trade history, and
fit them into the table.
Win rate is calculated as "number of winning trades ÷ total trades × 100."
Profitability ratio is the same as the previously described "average profit (pips) ÷ average loss (pips)".
For example, suppose the average win rate for a month is 70%.
That is a very high win rate.
However, if the profitability ratio is 0.4, your probability of ruin becomes
58.7%.
*Profitability ratio 0.4 occurs when the width of profit is +20 pips and the stop loss is -50 pips (20 ÷ 50 = 0.4).
A 58.7% ruin probability may seem high or low, but this number essentially implies a high likelihood of ruin.
If you continue your current trading, you will run out of capital, so you must immediately change your approach.
So, what ruin probability should you aim for?
In my view, the target should be "0%."
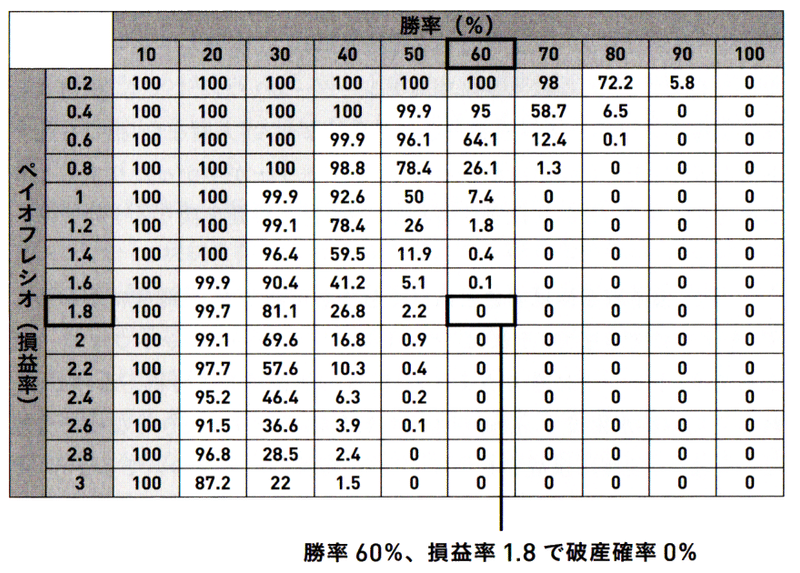
For example, if you trade with a profitability ratio of 1.8,
as long as you maintain a 60% win rate, the ruin probability becomes 0%.
A profitability ratio of 1.8 means, for instance, when the profit width is 100 pips and the stop loss is 55 pips
(100 ÷ 55 = 1.81).
As discussed, day trading methods aim for small losses and large gains,
so a profitability ratio of 1.8 is quite realistic.
In fact, you can and should aim for profitability ratios of 2 or higher.
With profitability ratio 2, the scenario might be +50 pips profit against -25 pips loss, for example.
If you enter at points like “if it goes up from here” or “if it goes down from here,” this is achievable.
Moreover, with a profitability ratio above 2, your ruin probability remains virtually zero even with a 50% win rate.
Day trading’s lifeblood is the profitability ratio.
To lower the ruin probability, you can either improve the win rate or improve the profitability ratio, and the latter will bring you to zero more readily.
Why is profitability ratio more important than win rate?
Because there is a limit to how much you can raise your win rate.
Explaining this itself is difficult, but since your trading skill is not perfect, you cannot perform perfectly every time.
No matter how skilled a professional trader is, there is no perfect, never-lose, super trader.
Everyone makes basic mistakes, gets fooled by deceptions, or sometimes enters too early.
To improve, you repeatedly analyze and verify.
On the other hand, it is always possible to increase profitability ratio.
Regardless of experience, you can do it right now.
That is because day trading methods follow trends.
If you ride the trend, you can target the next price move,
and you can see a substantial price move.
It is natural that the profit width will be larger than the stop loss width.
If you push to extend profitability irrationally, it will be mentally tough.
Rather, although not exactly easy, keeping profitability ratio at 2 is not difficult.
This also aligns with the market principle that "the trend continues until proven otherwise."
To reduce ruin probability, you should either
preventively increase profitability ratio or improve win rate.
• Increase profitability ratio
• Increase win rate
Focus on increasing profitability ratio among the two.
Conversely, if profitability ratio is poor, it indicates the overall entry-to-exit strategy itself is flawed.
Moreover, even with profitability ratio above 2, win rate can be low.
In that case, more entries or many unnecessary trades lead to more losses.
If unsure, check two bases: "What is the higher-timeframe market situation?"
"Are moving averages and lines properly drawn?"
Always verify these.
Thank you for reading up to here.