

【January 4, 2024】Backtest using Sky and Earth Indicator (USD/JPY)
Last time's Chart Analysis Article examined the subsequent movement of the USD/JPY waiting for a long entry. At the start of the new year, a perfect pattern appeared, so I would like to introduce it. It’s a basic pattern, and it seems many users were able to catch it in similar locations. A promising start to 2024!
・This article mainly covers chart analysis and historical verification using the "Heaven and Earth Indicator".
・The content is built around the premise of using the「15-minute chart + 4-hour chart simultaneous monitoring method」, which is regarded as the highest-accuracy tool among these.
・This tool is a groundbreaking trading tool that can be used without any understanding of the conventional FX theories (Elliott Wave, Dow Theory, Grandwell's Law, cycle theory, price action, Fibonacci, support/resistance, channels, etc.).

Heaven and Earth Indicator is a trading method using an original indicator developed by me, Abu, released in February 2022.
Thanks to everyone's support, "GogoJungle Award 2022, 2023" was awarded for two consecutive years.
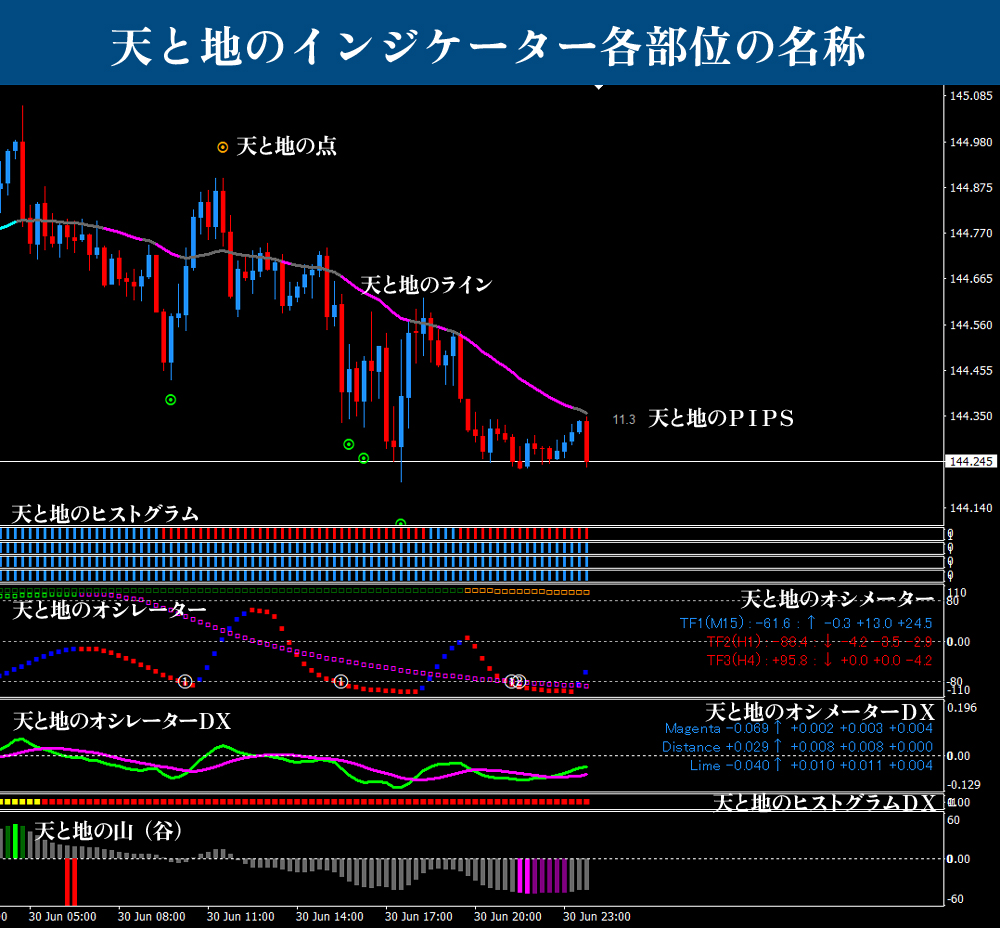
■ Heaven and Earth Indicator
https://www.gogojungle.co.jp/tools/indicators/35780
■ Heaven and Earth Indicator [MT5 Version]
https://www.gogojungle.co.jp/tools/indicators/47523
■ Heaven and Earth Mountain
https://www.gogojungle.co.jp/tools/indicators/37744
■ Heaven and Earth EA ~ Semi-Discretionary Auto Trade System ~
https://www.gogojungle.co.jp/tools/indicators/43213
■ Heaven and Earth Dashboard
https://www.gogojungle.co.jp/tools/indicators/46257
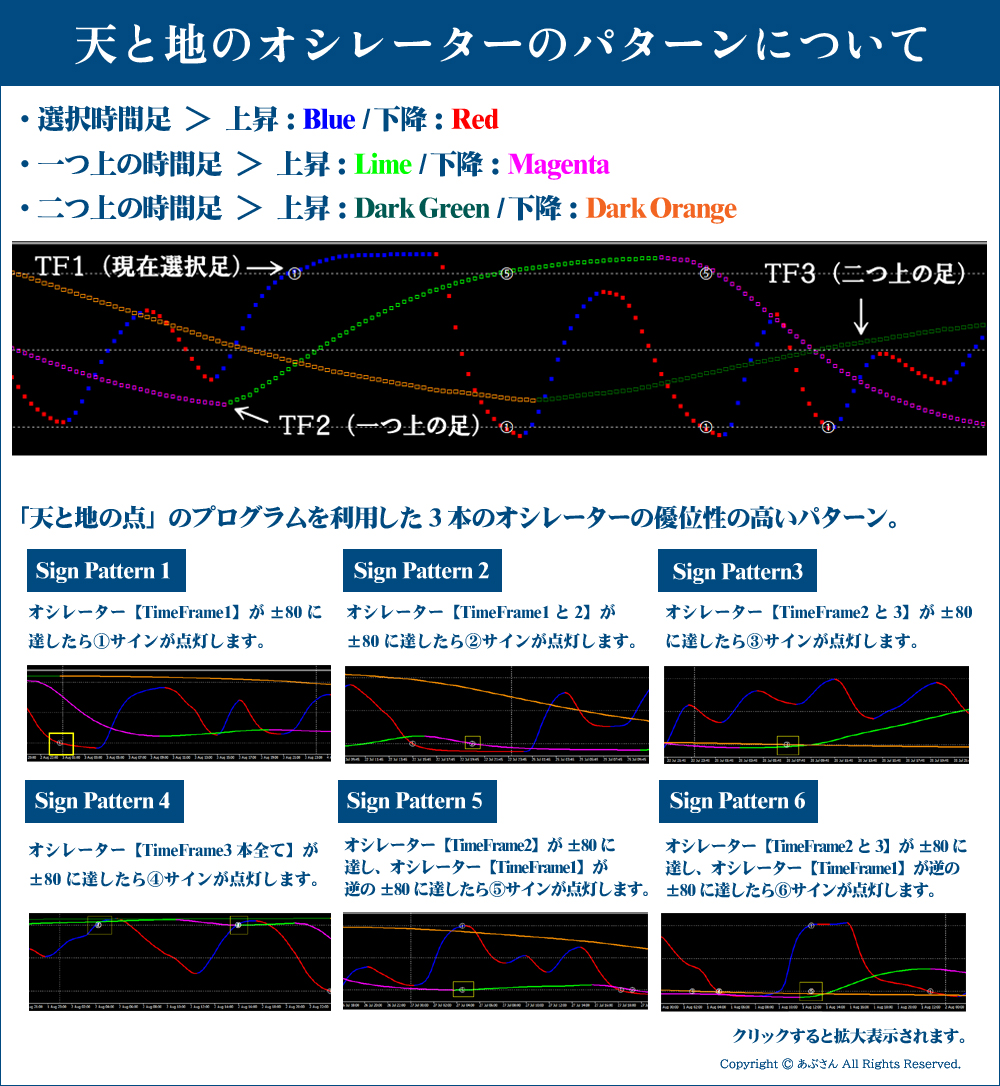
※ For the specialized terms used in this blog, please refer to the below “Names of the parts of Heaven and Earth Indicator” and “Pattern of Heaven and Earth Oscillator.” If you have any other questions, please refer to the Heaven and Earth Indicator sales page for a general understanding. Those who are already users should have no problem by reading the manual. If you have any questions, please refer to the Heaven and Earth Indicator sales page for a general understanding. Those who are already users should have no problem by reading the manual. Already a user? Just read the instruction manual.
Now, let's move on to the verification.
Thank you in advance!
※ All images can be enlarged by clicking.

USD/JPY 15-minute + 4-hour Historical Verification (From January 2, 2024 to present)
※ Please look at the yellow vertical line. There is a yellow vertical line at the same place on the 15-minute chart as well. (Using the LINK LINE)
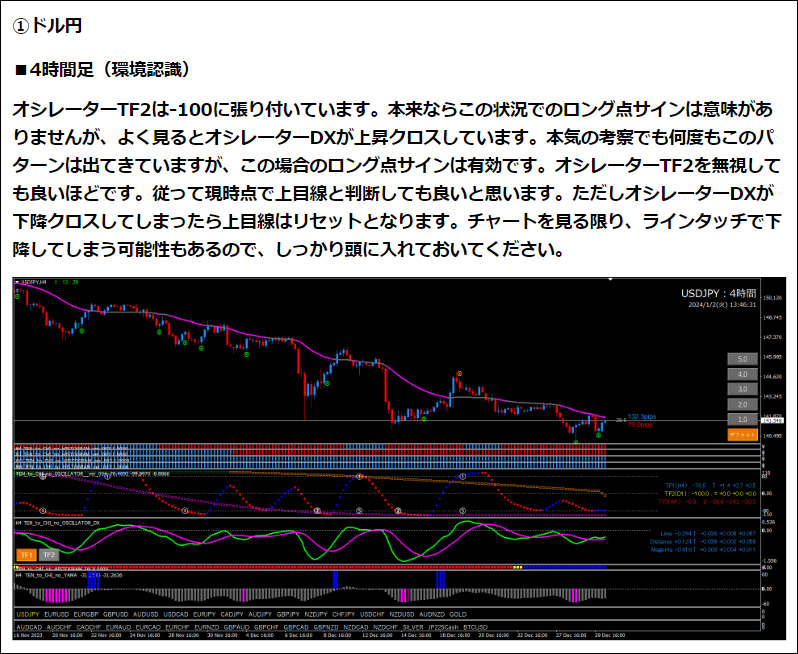
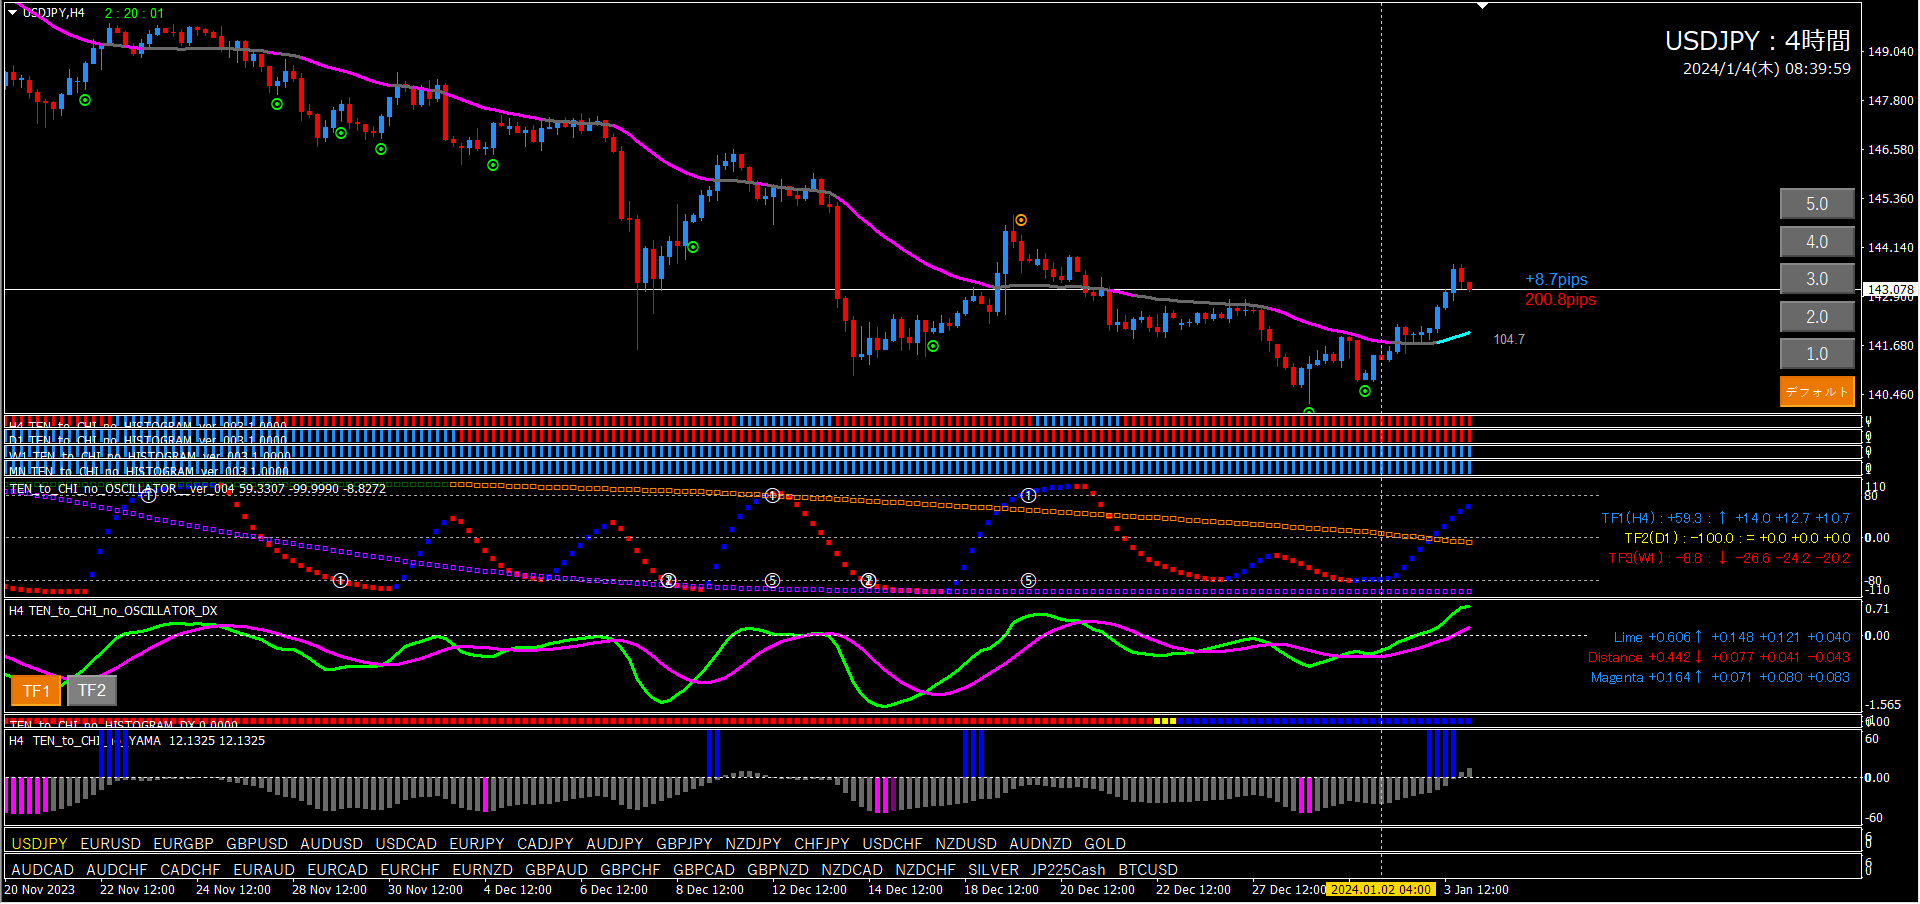
■ 4-hour chart (Market context)
The top of the image is the content from the previous article. The bottom is the current chart.
The yellow vertical line on the current chart is a place judged as bullish based on the previous article.
When I wrote the previous article, I had already determined a bullish outlook, so the remaining situation was simply waiting for a long-entry trigger on the 15-minute chart. Even so, the long entry signal after the oscillator DX rising cross had high edge. It rose properly.

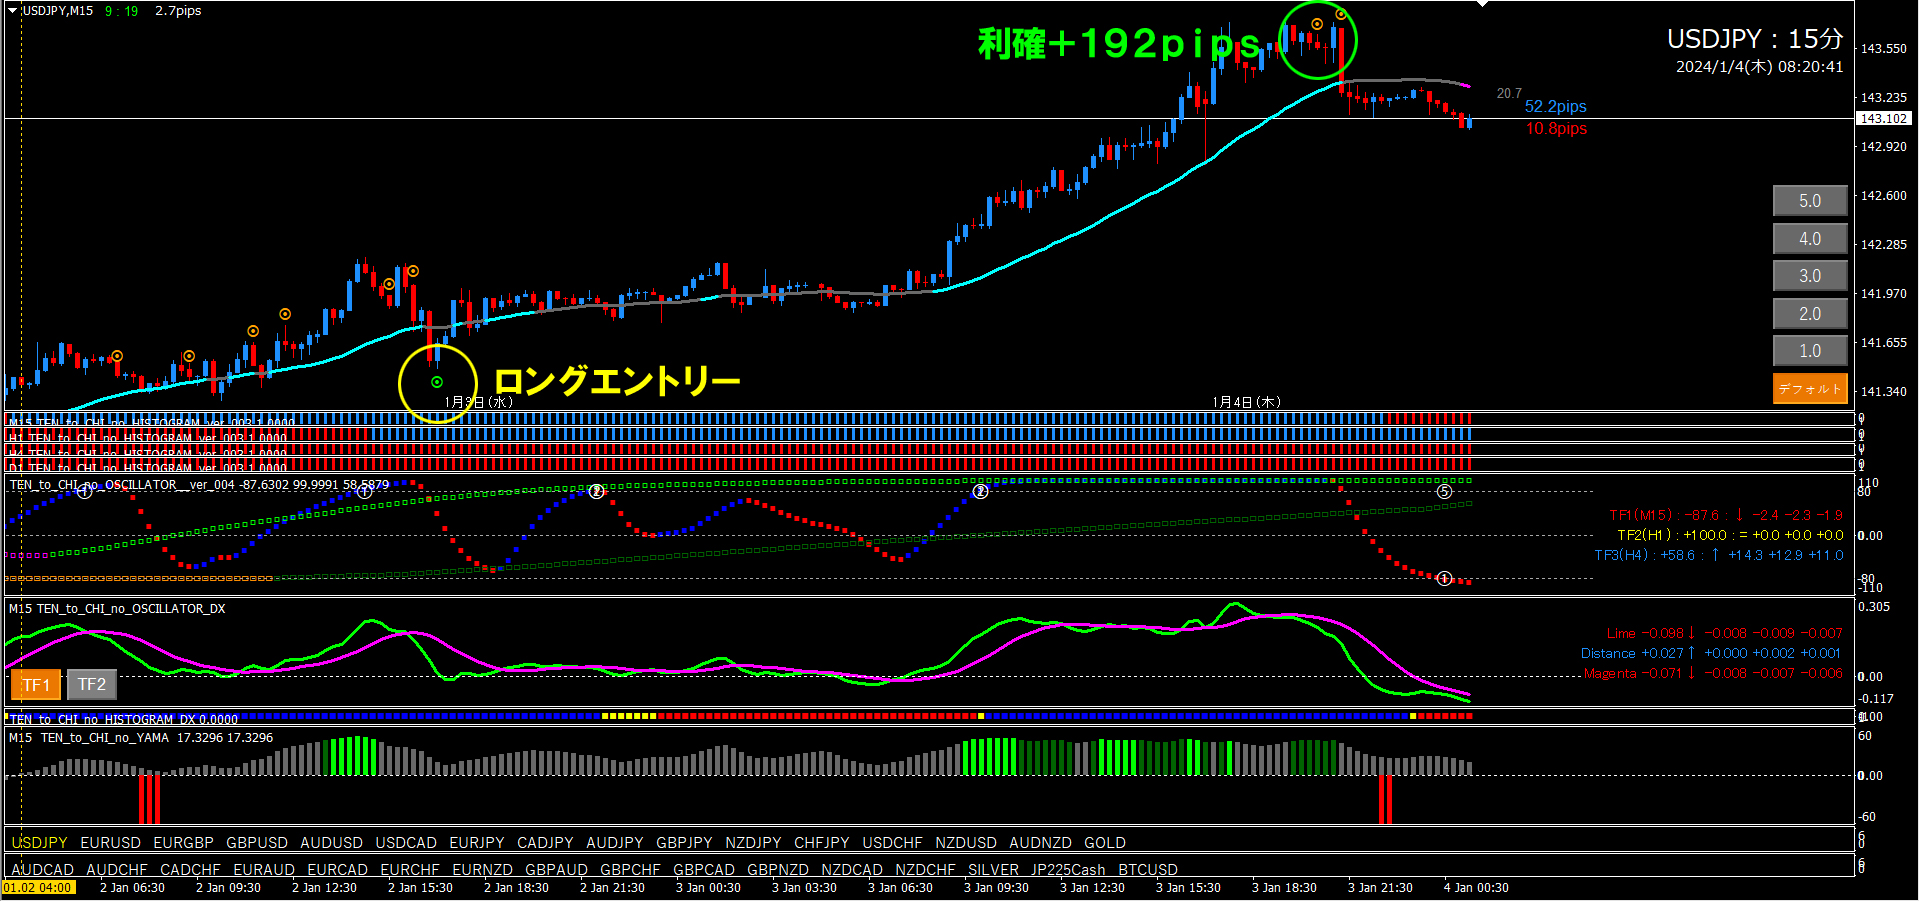
■ 15-minute chart (Entry Trigger)
The yellow vertical line is where I judged a bullish outlook on the 4-hour chart.
Yellow circle marks the long entry point. The green circle marks the point where I took profit from the long signal.
As Oscillator TF2 was rising, a long signal appeared. The histogram and Histogram DX were both blue. Since the 4-hour chart already indicated bullish, these are sufficient grounds. It then rose steadily, and the short-signal appeared at a good position. Being able to capture +192 pips on the 15-minute chart feels satisfying.

That is all.
I hope this has been at least somewhat helpful to everyone.
