

【Happy New Year】Chart analysis using indicators for heaven and earth
Happy New Year. I look forward to your continued support this year as well.
I would be grateful if you continue to utilize Investment Navigator+ articles in 2024 as well.
This year’s first article is a chart analysis of a total of eight currency pairs (USD/JPY, EUR/USD, EUR/GBP, GBP/USD, AUD/USD, USD/CAD, EUR/JPY, and the Nikkei 225). I hope it can be of some reference to everyone.

Table of Contents

・This article uses“Heaven and Earth Indicator” for chart analysis and backtesting as the main content.
・This content is based on the premise of using the most precise“15-minute chart + 4-hour chart simultaneous monitoring” method.
・This tool is a groundbreaking trading tool that can be used without understanding the traditional FX theories (Elliott Wave, Dow Theory, Grandville's Law, cycle theory, price action, Fibonacci, support/resistance, channels, etc.).

Heaven and Earth Indicator is a trading method using the original indicator I, A-busan, developed in February 2022.
Thanks to everyone's support, we have received the “GogoJungle Award 2022, 2023” for two consecutive years.
■ Heaven and Earth Indicator
https://www.gogojungle.co.jp/tools/indicators/35780
■ Heaven and Earth Indicator【MT5版】
https://www.gogojungle.co.jp/tools/indicators/47523
■ Heaven and Earth Mountain
https://www.gogojungle.co.jp/tools/indicators/37744
■ Heaven and Earth EA ~ Semi-Discretionary Auto Trading System ~
https://www.gogojungle.co.jp/tools/indicators/43213
■ Heaven and Earth Dashboard
https://www.gogojungle.co.jp/tools/indicators/46257
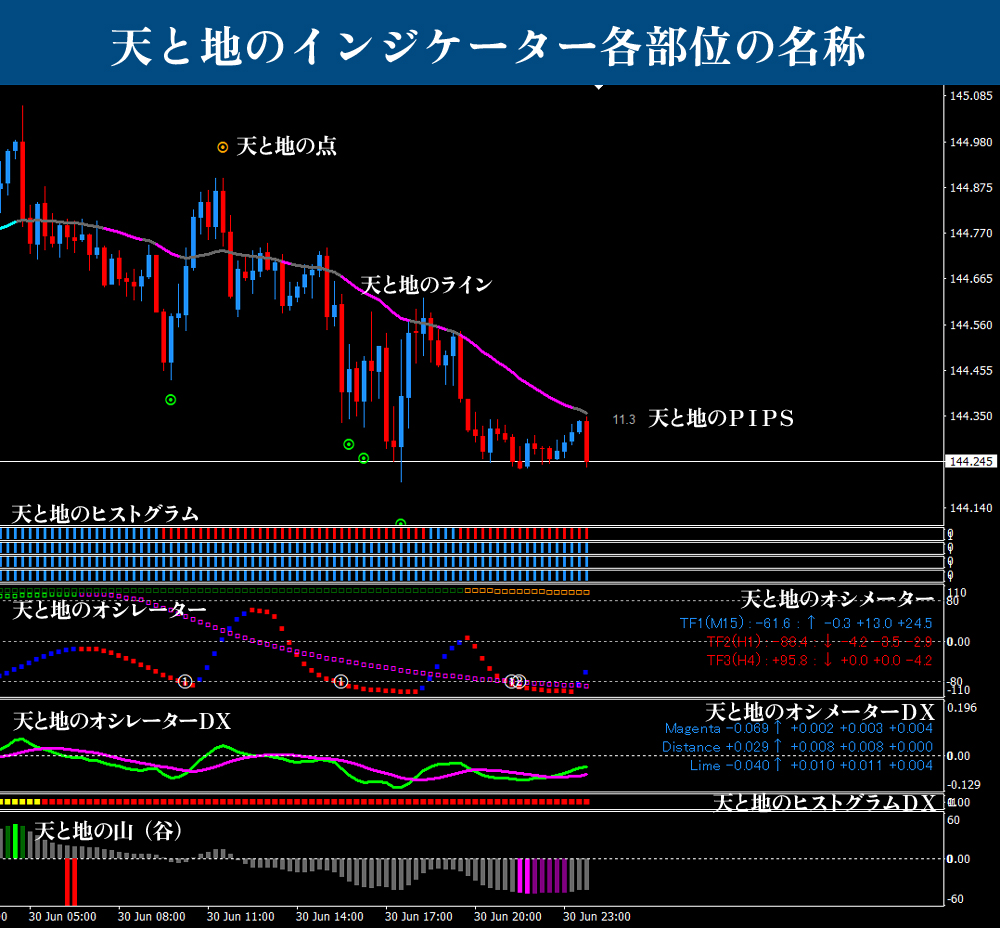
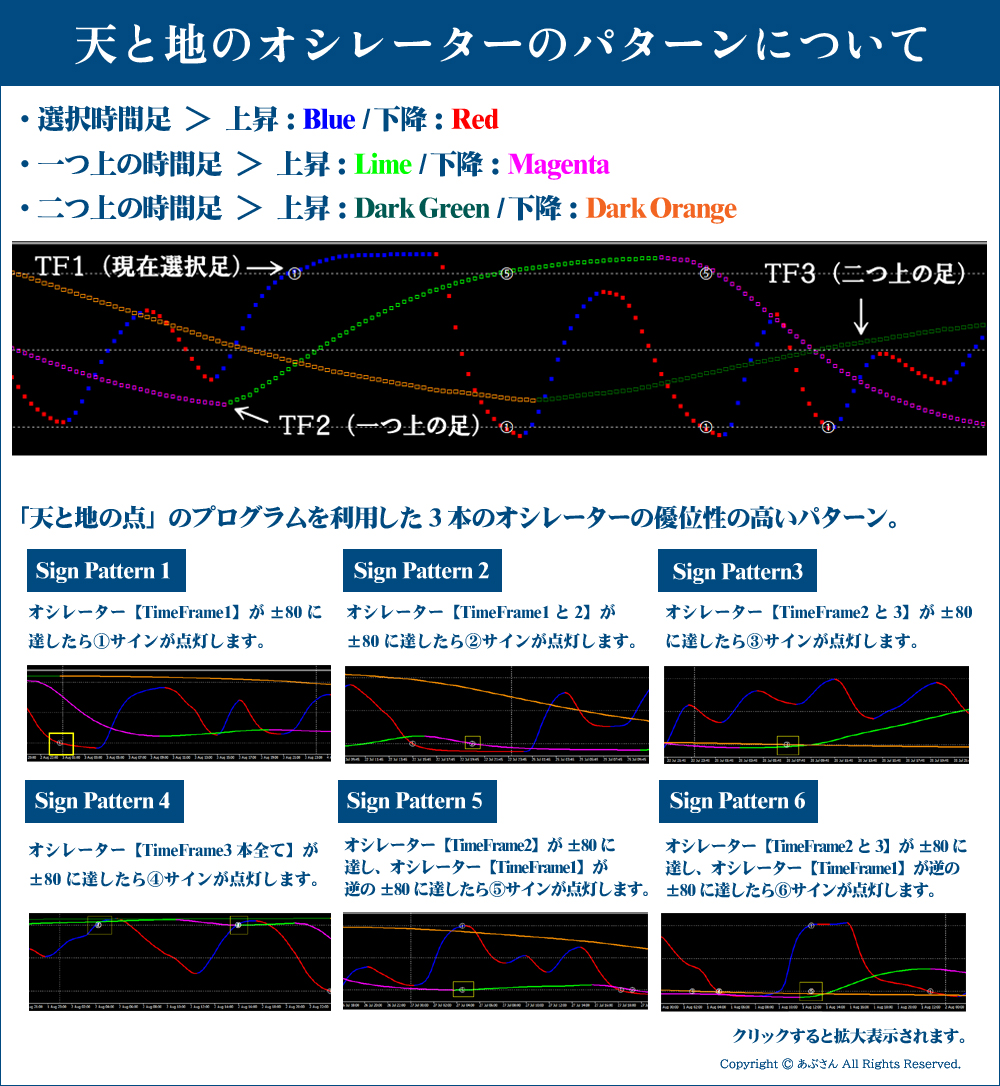
※ Regarding specialized terms used in this blog, please refer to the below “Names of each part of Heaven and Earth Indicator” and “Oscillator patterns of Heaven and Earth.” If you have any other questions, please consult the Heaven and Earth Indicator sales page. For existing users, reading the manual should suffice.Also, if you have any questions, you can usually understand by reading the manual.If you already are a user, reading the manual should be fine.
Now, I would like to move on to the analysis.
Thank you in advance!
※ All images can be enlarged by clicking.

■ 4-hour chart (environment recognition)
Oscillator TF2 is stuck at -100. A long entry signal in this situation would normally be meaningless, but if you look closely, Oscillator DX is showing a rising crossover. In serious analysis, this pattern occurs repeatedly, and in this case the long-entry signal is valid. You could ignore Oscillator TF2 if needed. Therefore, you can consider a bullish bias at this point. However, if Oscillator DX makes a downward crossover, the bullish bias resets. From the chart, there is a possibility of decline after touching the line, so keep that in mind.

■ 15-minute chart (entry trigger)
Since the 4-hour chart already shows a bullish bias, we will look for a long entry on the 15-minute chart.
Oscillator TF2 is beginning to turn up (a mid-flight turn, not ideal). Oscillator DX has just had a downward crossover, so consider a possible drop once. The future scenario is: drop once, then on a line touch whether Oscillator DX is turning upward toward a crossover, or the line is broken to trigger a long-entry signal; either could lead to a long entry.

■If using Heaven and Earth EA (on 15-minute chart)
Since Oscillator TF2 is already rising, the basic method is to set EA Pattern ①. However, there is a chance the long signal may not reach 45 pips.
■A-busan Signal (on 15-minute chart)
If you have A-busan Signal, you can enter on Signal 1 after waiting on Signal 2. In A-busan Signals, as long as the 4-hour chart shows a clear trend, you can ignore the direction of Oscillator TF2 and other bases. It is a very strong trend-following signal, so this is fine.The method is the same for other currency pairs, so I will omit it from the following analysis.

■ 4-hour chart (environment recognition)
Oscillator TF2 is rising, TF1 is falling toward -80. This is a good setup for a bullish bias. The minimum long-entry signal after the signal appears is at least 15.0 pips. It’s nearing. When the long-entry signal appears, consider the bullish bias. At that time, watch whether Oscillator DX is contracting toward an upward crossover. If Oscillator Signal ① or ⑤ appears, you may consider bullish bias. If Oscillator TF2 turns downward, the bullish bias resets.

■ 15-minute chart (entry trigger)
If you have a bullish bias on the 4-hour chart, only look for long entries on the 15-minute chart.
Currently not yet bullish, so stay on the sidelines. The future scenario is that after confirming a bullish bias, check the rise of Oscillator TF2 and then take a long-entry signal.

■Heaven and Earth EA (used on 15-minute chart)
Refer to EUR/USD for guidance.


■ 4-hour chart (environment recognition)
Oscillator TF2 is rising, TF1 is heading downward toward -80. This forms a good setup for a bullish bias. The minimum long-entry signal is 46.1 pips. When the long-entry signal appears, you may consider bullish bias. At that time, watch whether Oscillator DX is contracting toward an upward crossover. If Oscillator Signals ① or ⑤ appear, you may consider bullish bias. If Oscillator TF2 turns downward, the bullish bias resets.

■ 15-minute chart (entry trigger)
If you determine a bullish bias on the 4-hour chart, search for long entries on the 15-minute chart only.
Currently not yet bullish, so stay on the sidelines. The future scenario is that after confirming a bullish bias, check the rise of Oscillator TF2 and then take a long-entry signal.

■Heaven and Earth EA (used on 15-minute chart)
② EUR/USD for reference.

■ 4-hour chart (environment recognition)
Oscillator TF2 is rising and stuck, TF1 is rising toward +80. There is also a valley. This forms a favorable setup for a bearish bias. The minimum short-entry signal is 26.3 pips. When the short-entry signal appears, you may consider bearish bias. At that time, watch whether Oscillator DX is contracting toward a downward crossover. If Oscillator Signals ① or ⑤ appear, you may consider bullish bias. If Oscillator TF2 turns upward, the bearish bias resets.

■ 15-minute chart (entry trigger)
If you determine a bullish bias on the 4-hour chart, search for long entries on the 15-minute chart only.
Currently not yet bullish, so stay on the sidelines. The future scenario is that after confirming a bullish bias, check the rise of Oscillator TF2 and then take a long-entry signal.

■Heaven and Earth EA (used on 15-minute chart)
② EUR/USD for reference.

■ 4-hour chart (environment recognition)
Oscillator TF2 is declining, TF1 is rising toward +80. A valley is also appearing. This is a favorable setup for a bearish bias. The minimum short-entry signal is 26.3 pips. When the short-entry signal appears, you may consider bearish bias. At that time, watch whether Oscillator DX is contracting toward a downward crossover. If Oscillator Signals ① or ⑤ appear, you may consider bullish bias. If Oscillator TF2 turns upward, the bearish bias resets.

■ 15-minute chart (entry trigger)
If you determine a bearish bias on the 4-hour chart, search for short entries on the 15-minute chart only.
Currently not yet bearish, so stay on the sidelines. The future scenario is that after confirming a bearish bias, check the rise of Oscillator TF2 and then take a short-entry signal.

■Heaven and Earth EA (used on 15-minute chart)
② EUR/USD for reference.

■ 4-hour chart (environment recognition)
Oscillator TF2 is rising, and the long-entry signal has appeared. TF1's position is reasonably good. At this stage, you may consider bullish bias. For certainty, wait until Oscillator DX fully crosses upward before deciding bullish bias.

■ 15-minute chart (entry trigger)
Since you already have a bullish bias on the 4-hour chart, search for long entries on the 15-minute chart.
Oscillator TF2 is currently rising, so all that remains is to find a long-entry trigger. A mild basis is acceptable. Ideally, a brief retreat followed by a long-entry signal would be best. There is about 31.6 pips to go. TF1 position is not ideal, and Oscillator DX has just crossed downward. It seems you will need to wait a while for a trigger.

■Heaven and Earth EA (used on 15-minute chart)
Set EA Pattern ① safely, since TF2 is already rising, but note the entry may not reach automatically. If TF2 turns downward, the EA will stop, which provides safety.

■ 4-hour chart (environment recognition)
Oscillator TF2 is rising, TF1 is heading downward toward -80. This is a favorable setup for a bullish bias. The histogram and Histogram DX are all blue. The minimum long-entry signal is at least 25.5 pips. When the long-entry signal appears, you may consider bullish bias. At that time, watch whether Oscillator DX is contracting toward an upward crossover. If Oscillator Signals ① or ⑤ appear, you may consider bullish bias. If Oscillator TF2 turns downward, the bullish bias resets.

■ 15-minute chart (entry trigger)
If you determine a bullish bias on the 4-hour chart, search for long entries on the 15-minute chart only.
At present, the pattern is fully for a short entry, so you may need to wait for a while. The future scenario is that after confirming a bullish bias, check the rise of Oscillator TF2 and then take a long-entry signal.

Refer to EUR/USD for guidance.

■ Finally, here is a dashboard image of the current 4-hour chart.


That is all.
I hope this is helpful to everyone to some extent.
