

Utilization of "Visualization Indicator" (Part 127)
“Visualization Indicator” Utilization (Part127)
1. Further evolve the “28 Currency Pairs List Indicator” into an indicator
“8 CP Visualization Indicator” for USDCHF.
There are versions of the “8 CP Visualization Indicator”: Oceania, London, New York, and AnyCP versions. This time, the New York version was used.
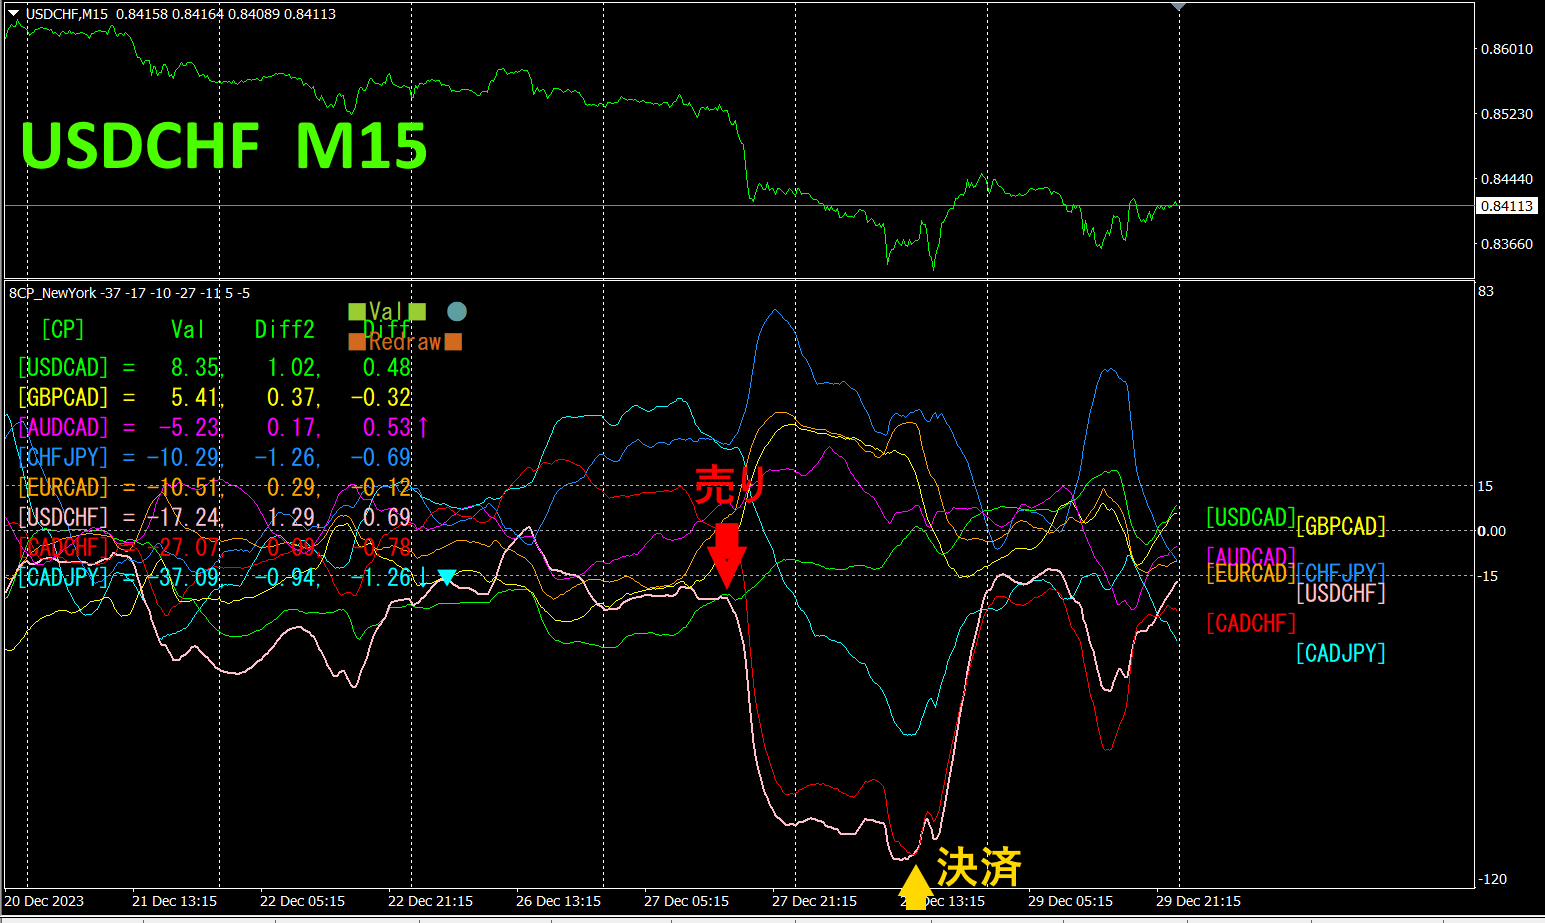
The top half is the 15-minute chart of USDCHF. The bottom half is from the “8 CP Visualization Indicator.” The magenta solid line graph corresponds to USDCHF.
On Wednesday, USDCHF broke below the chart cluster, so I entered a sell. The next day, at the point where it bottomed and reversed, I closed the position.About170 pips
2. Best Select Try the Indicator
The following is a screenshot dated2023 year12 month29 day 00:43 (JST).
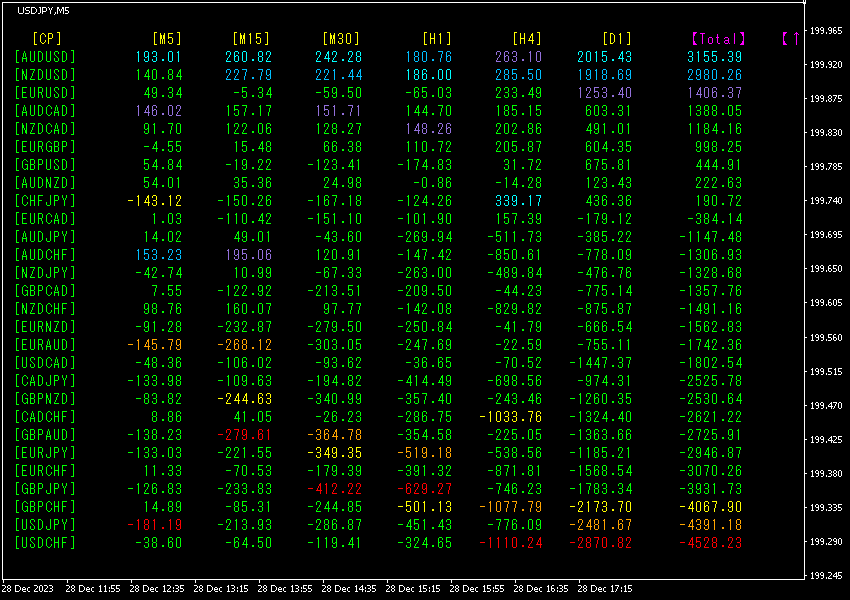
The values are sorted in descending order. The top row isAUDUSD, which appears blue across all timeframes, and the value is +3155.39
Now, let’s look at the AUDUSD chart.
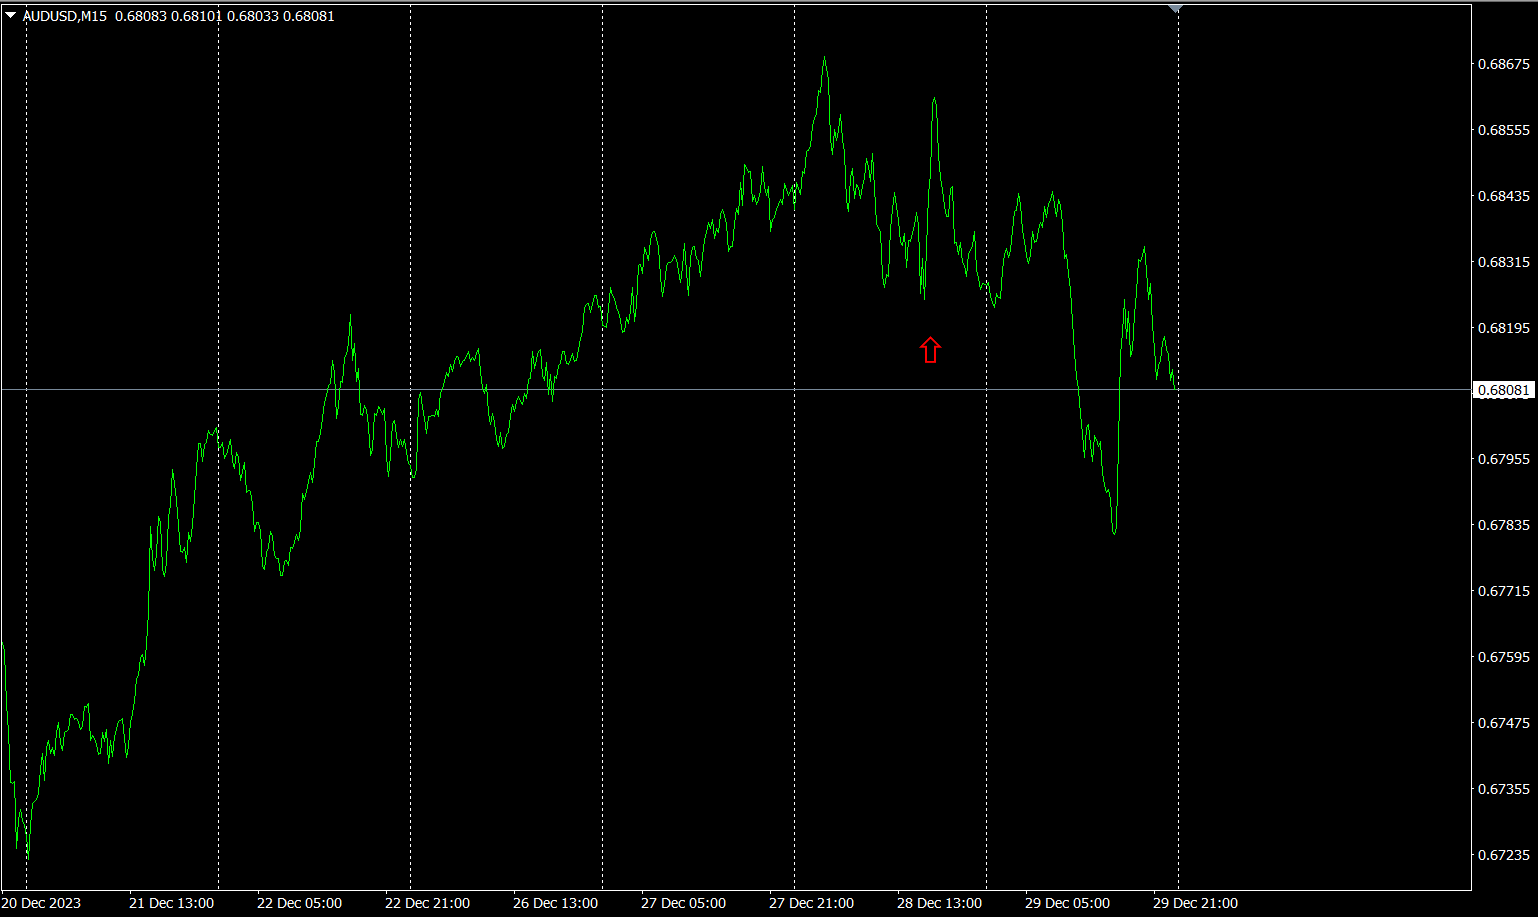
The red arrows indicate where the screenshot was taken, capturing a sharp rise.
“28 currency pairs Best Select Indicator
“28 currency pairs Best Select Indicator
https://www.gogojungle.co.jp/tools/indicators/35128

3. Since May of the year before last, how did EURJPY move?
20215
To view the overall trend, I have drawn about three weeks of the most recent 30-minute candles.
Last time I wrote the following.
Pink is EUR, green is JPY. Both are almost horizontal. The JPY appears slightly more downward-tilted than the EUR. In the future,EURJPY lacks a clear directional trend.
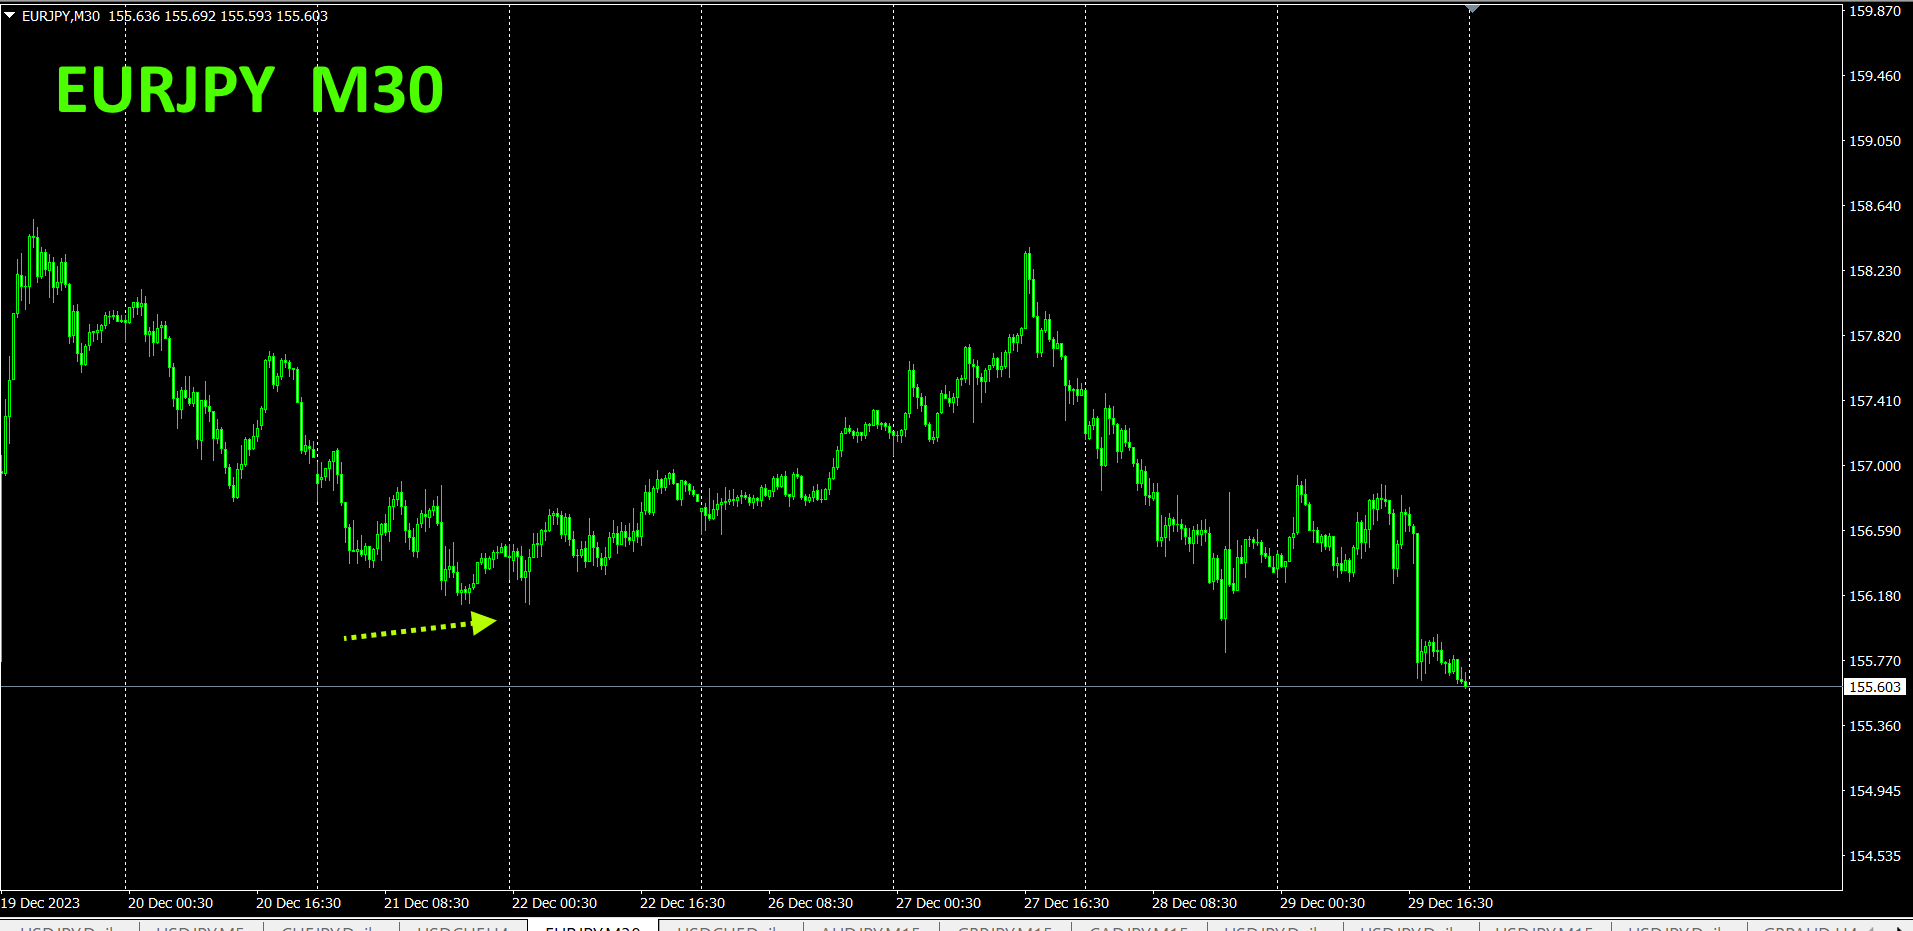
From Monday to Wednesday it rose, and from Thursday onwards it fell.
30 minute currency strength chart.
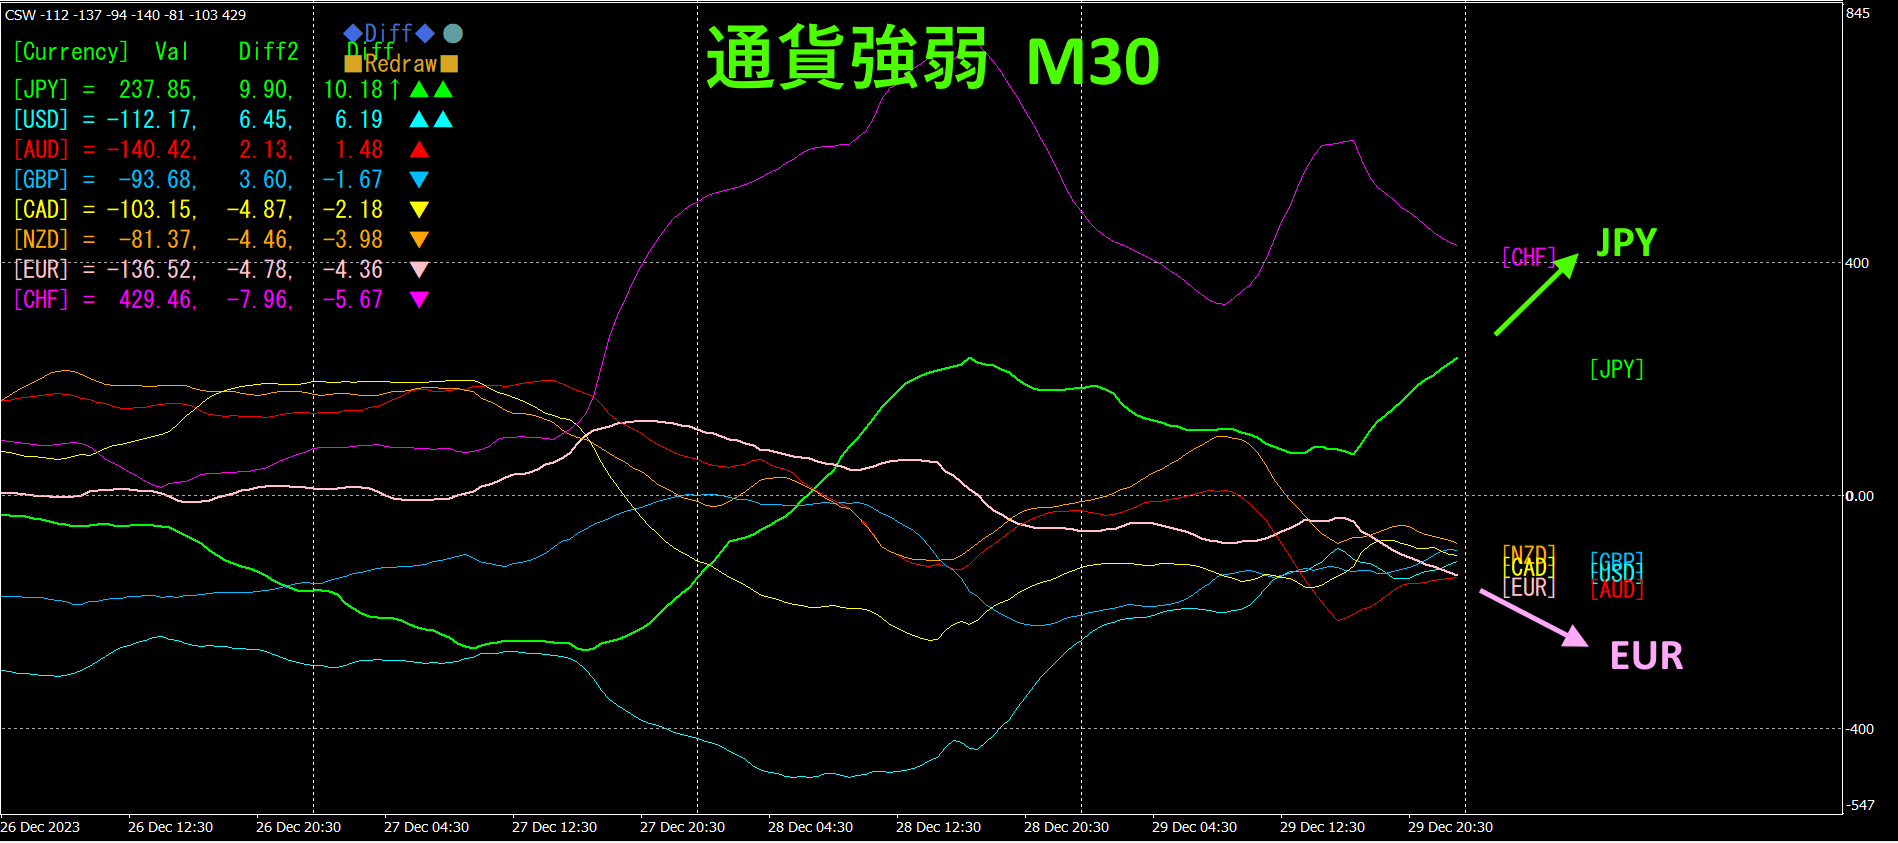
Pink is EUR, green is JPY. JPY is rising, EUR is falling, so they are diverging, and it is expected that will decline.
4. Scan all currency pairs for tops and bottoms and build a trend strategy (target isNZDCHF)
2505“Top/Bottom Search Indicator” is used to select NZDCHF as a currency pair located at a bottom, aiming for a rise from the bottom.
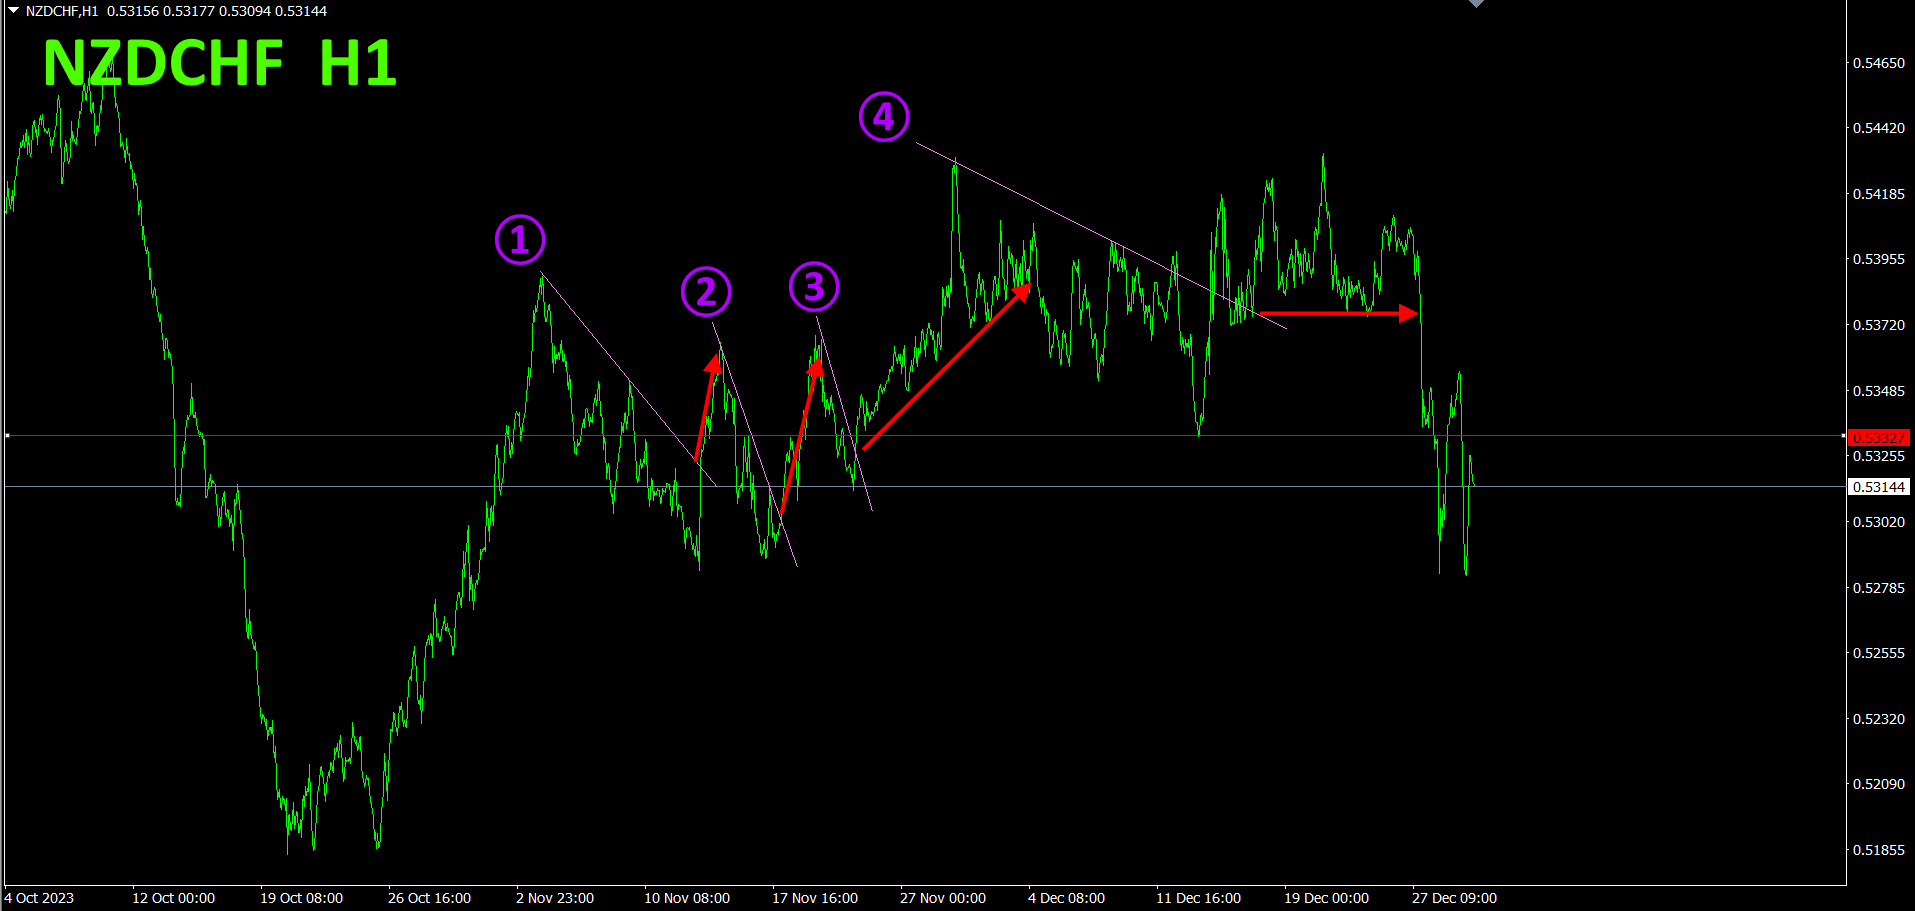
I bought after prices broke above lines ①, ②, ③, and ④ of the downsloping lines, and closed when the rising trend line was breached. From ①,40pips, from ②,60pips, from ③,58pips, totaling158pips profit.
When the downsloping line of ④ was broken, I opened a buy position, but the price subsequently fell, so I closed at the entry price.
Since it broke the near-term low, I will wait for a reversal and rise again.
Refer to the four-hour currency strength chart.
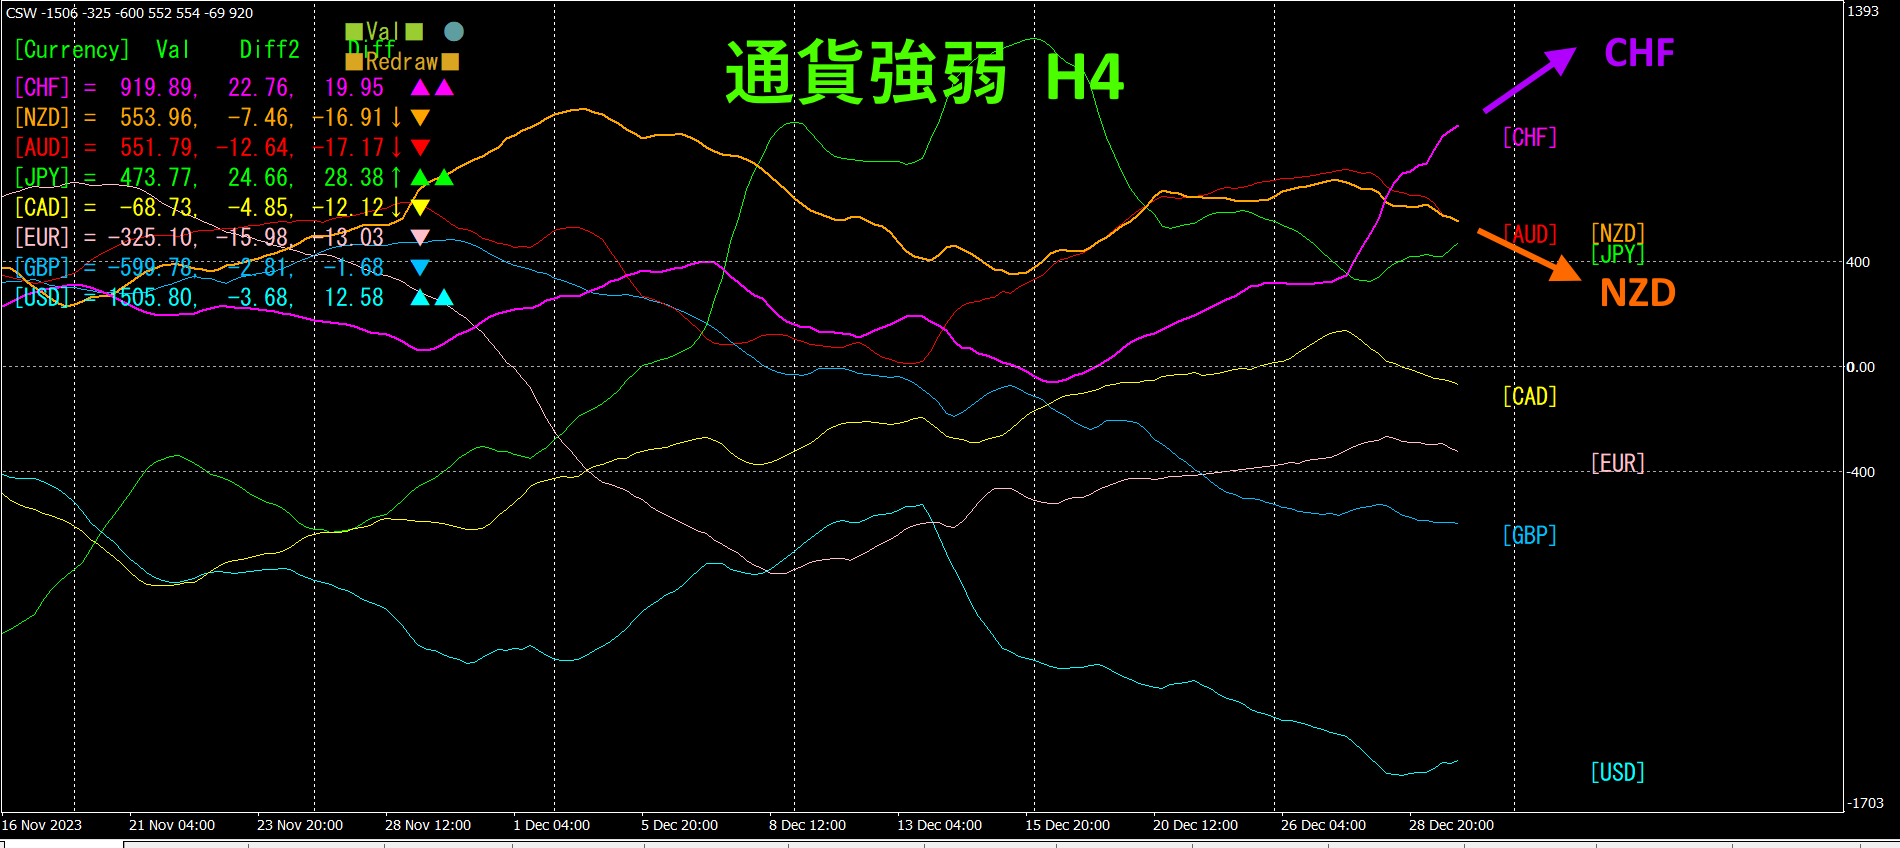
Red-purple is CHF, orange is NZD. CHF is rising, NZD is falling. Going forward, it is reasonable to expect that
With a semi-automatic EA, the “Trend Line EX” allows you to draw diagonal down-sloping lines and automatically buy when price breaks above, and automatically exit when it breaks above the rising line, enabling a hands-off trade.
※“Trend Line EX”

https://www.gogojungle.co.jp/tools/indicators/42257
If you are interested in the “8C Currency Strength Visualization Indicator,” please refer to the pages below.
MT4 version
https://www.gogojungle.co.jp/tools/indicators/39150

MT5
https://www.gogojungle.co.jp/tools/indicators/39159

【My Listings】


