

[December 23, 2023] Backtest using Heaven and Earth Indicators (PON/JPY)
This time, we would like to introduce the entry points for the most recent USD/JPY (PON) trades.
Next year, we will also reveal a little about the full picture of the EA pattern ⑦ to be distributed to Tian and Earth EA users.EA Pattern ⑦.

・This article mainly focuses on backtesting using the “Tian and Di Indicator”.
・This tool is designed on the premise of using the most accurate method,“15-minute chart + 4-hour chart simultaneous monitoring method”.
・This tool is a groundbreaking trading tool that can be used even if you do not understand classic FX theories (Elliott Wave, Dow Theory, Grandville’s Law, cycle theory, price action, Fibonacci, support/resistance, channels, etc.)."

Tian and Di Indicator is a trading method that uses my original indicator released in February 2022.
Thanks to everyone's support, we were awarded“GogoJungle Award 2022, 2023” for two consecutive years.
■ Tian and Di Indicator
https://www.gogojungle.co.jp/tools/indicators/35780
■ Tian and Di Indicator【MT5 Version】
https://www.gogojungle.co.jp/tools/indicators/47523
■ Tian and Di Mountain
https://www.gogojungle.co.jp/tools/indicators/37744
■ Tian and Di EA ~ Semi-Discretionary Auto Trading System ~
https://www.gogojungle.co.jp/tools/indicators/43213
■ Tian and Di Dashboard
https://www.gogojungle.co.jp/tools/indicators/46257
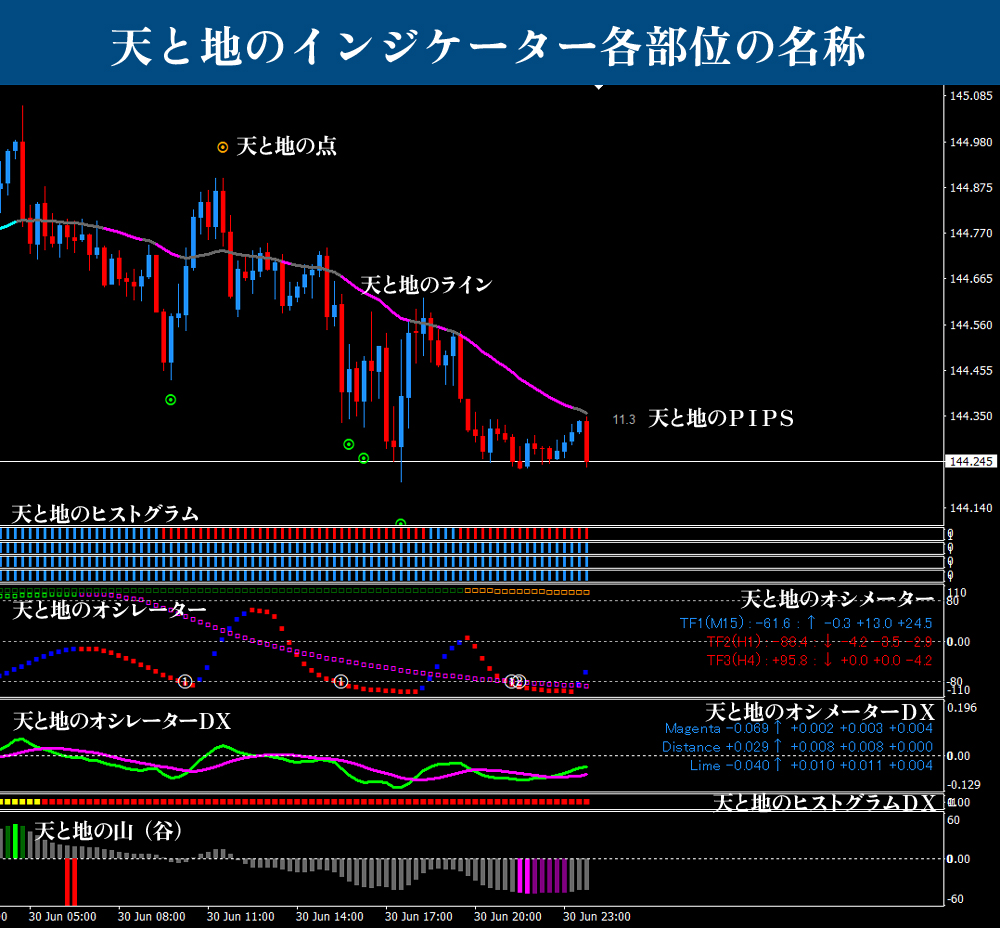
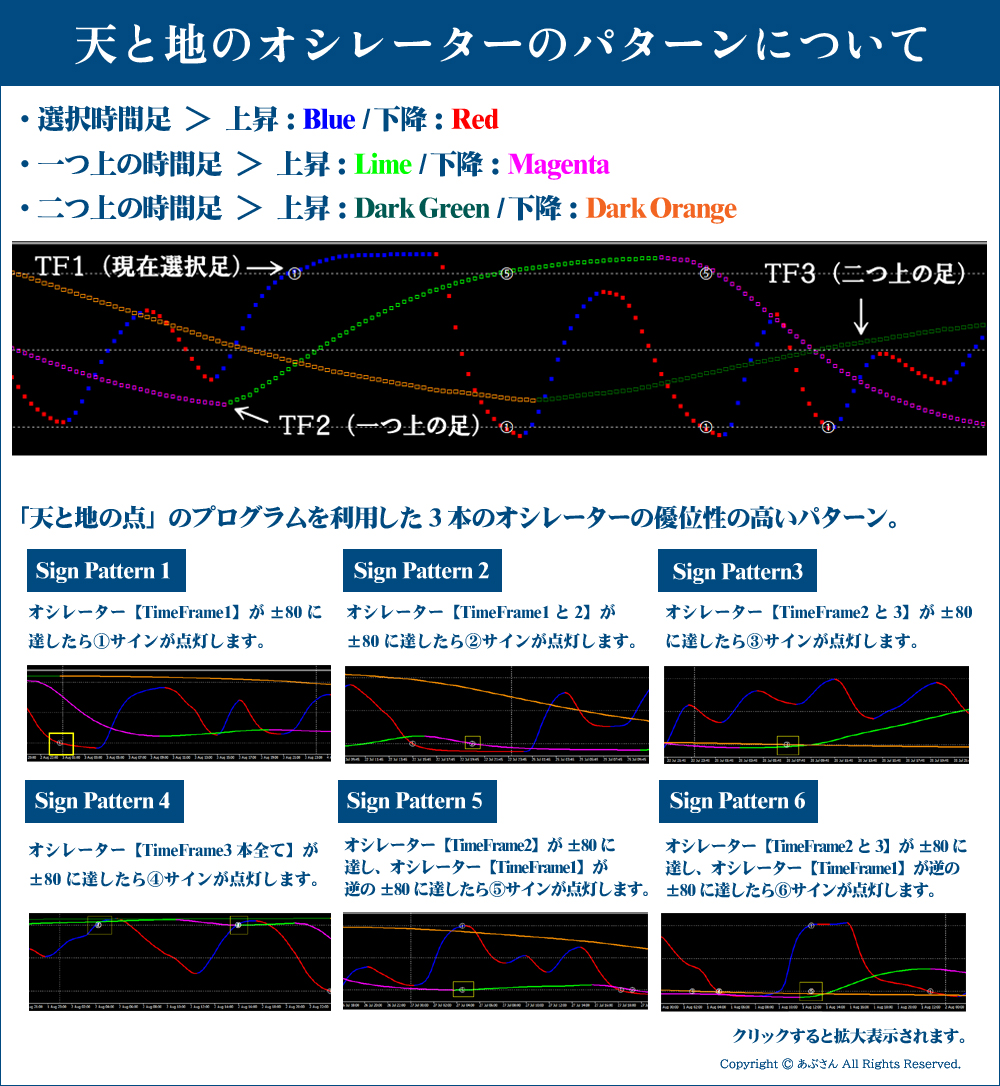
※Regarding specialized terms used in this blog,please refer to the below “Names of the parts of Tian and Di Indicator” and “Tian and Di Oscillator patterns”.If you have any other questions,you can largely understand by referring to the Tian and Di Indicator sales page.Already users should have no trouble by reading the user guide.
Now, I would like to move on to the verification.
Thank you very much!
※ All images can be enlarged by clicking.

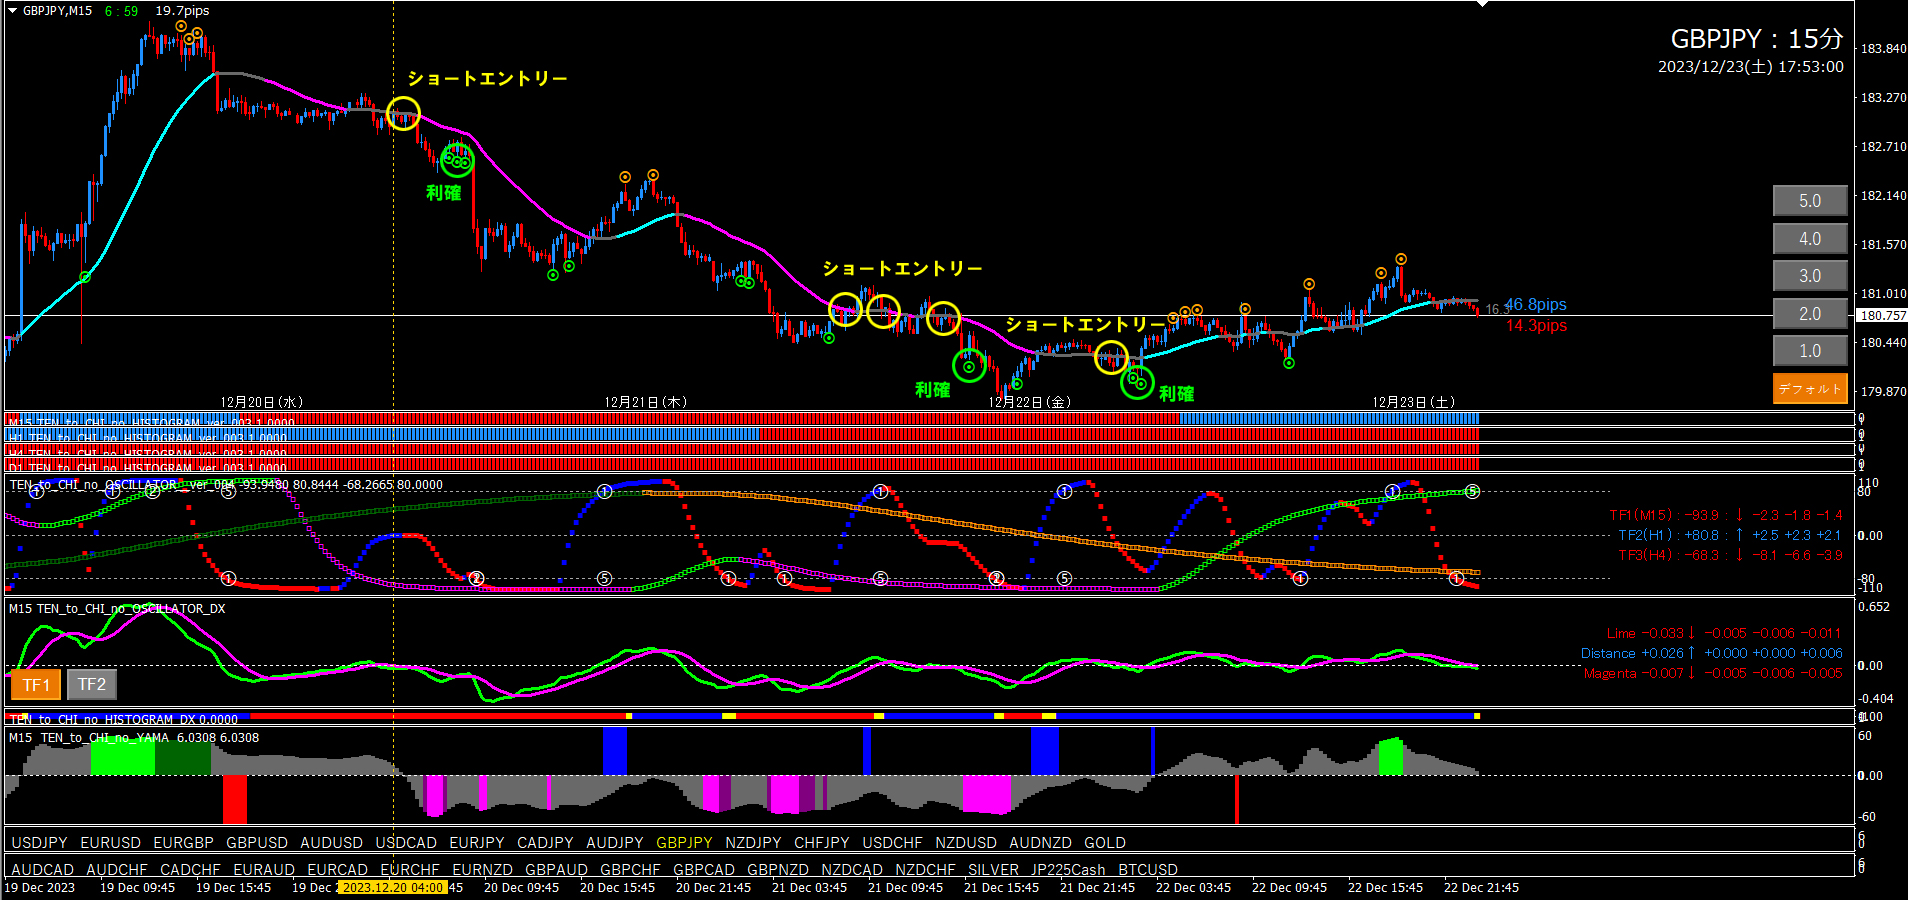
PON/JPY15-minute + 4-hour Backtest (from December 19, 2023 to present)
※ Please see the yellow vertical line. There is also a yellow vertical line at the 15-minute chart (using the LINK LINE).
■ 4-hour chart (environment recognition)
The yellow vertical line marks the point judged as downtrend.
We would like to determine a short entry when the short entry sign + Oscillator TF2 is trending downward, but Oscillator DX is still open, so to ensure reliability we wait a moment. At the yellow vertical line the Oscillator DX finally contracts, so we judged it as downtrend here.
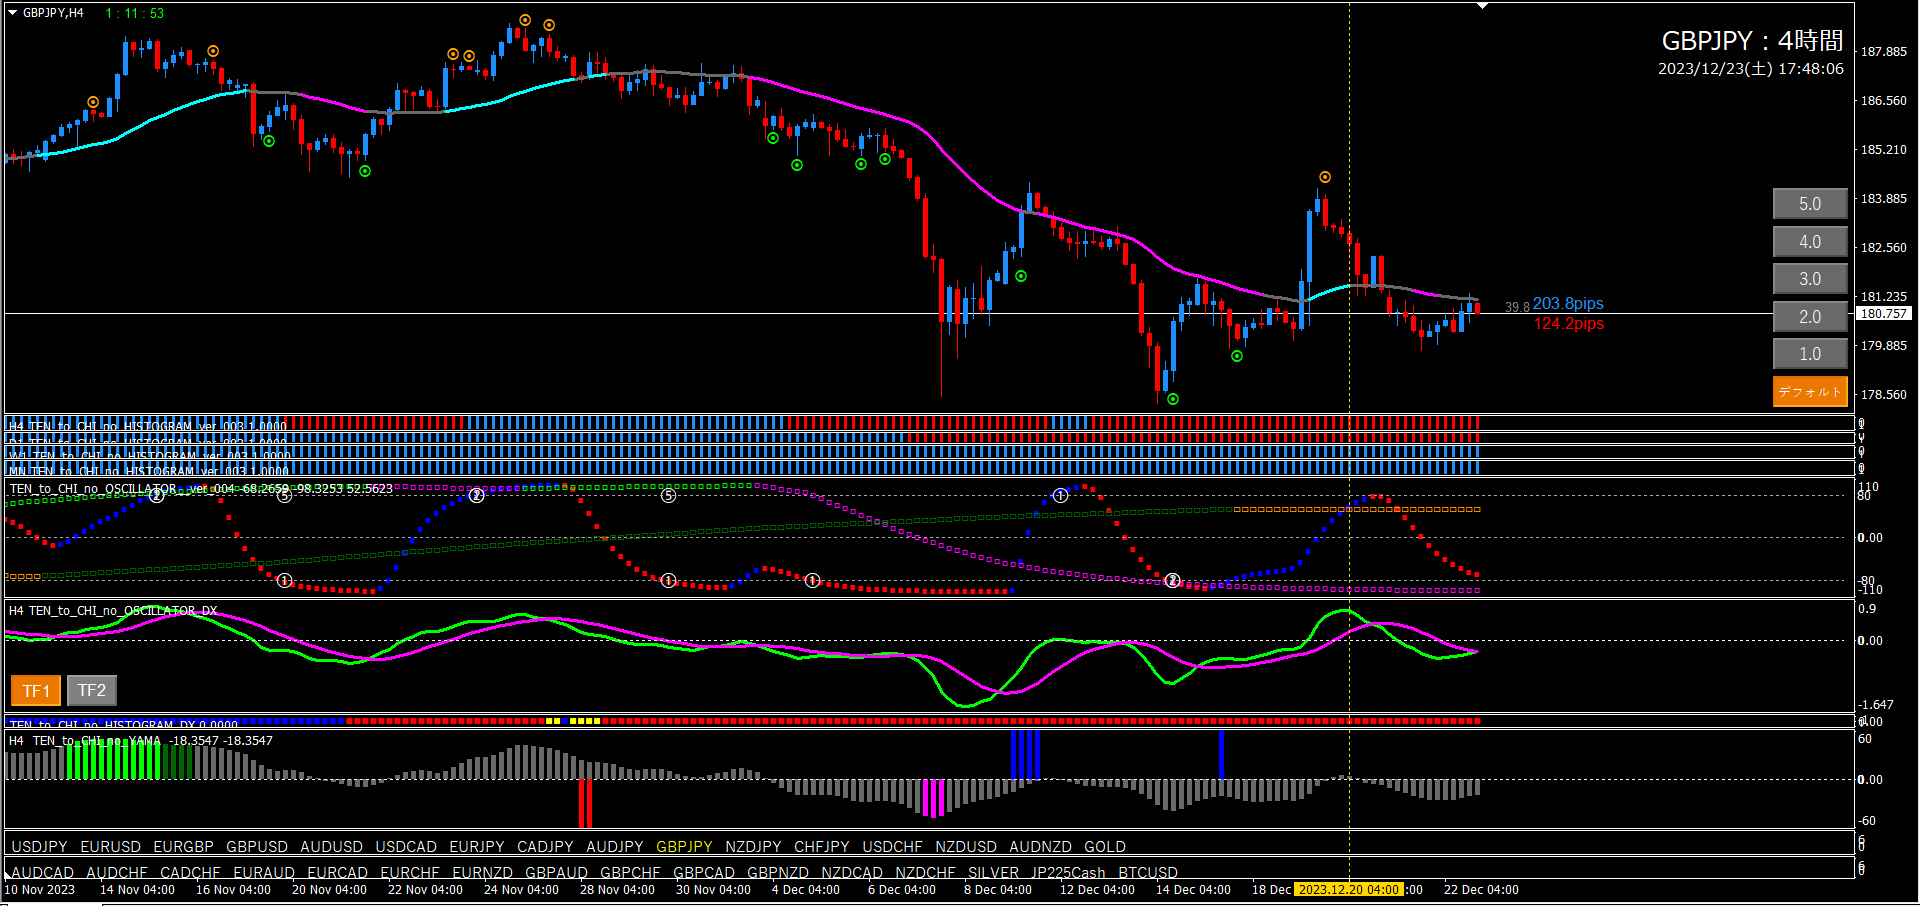
The yellow vertical line is the point judged as downtrend on the 4-hour chart.
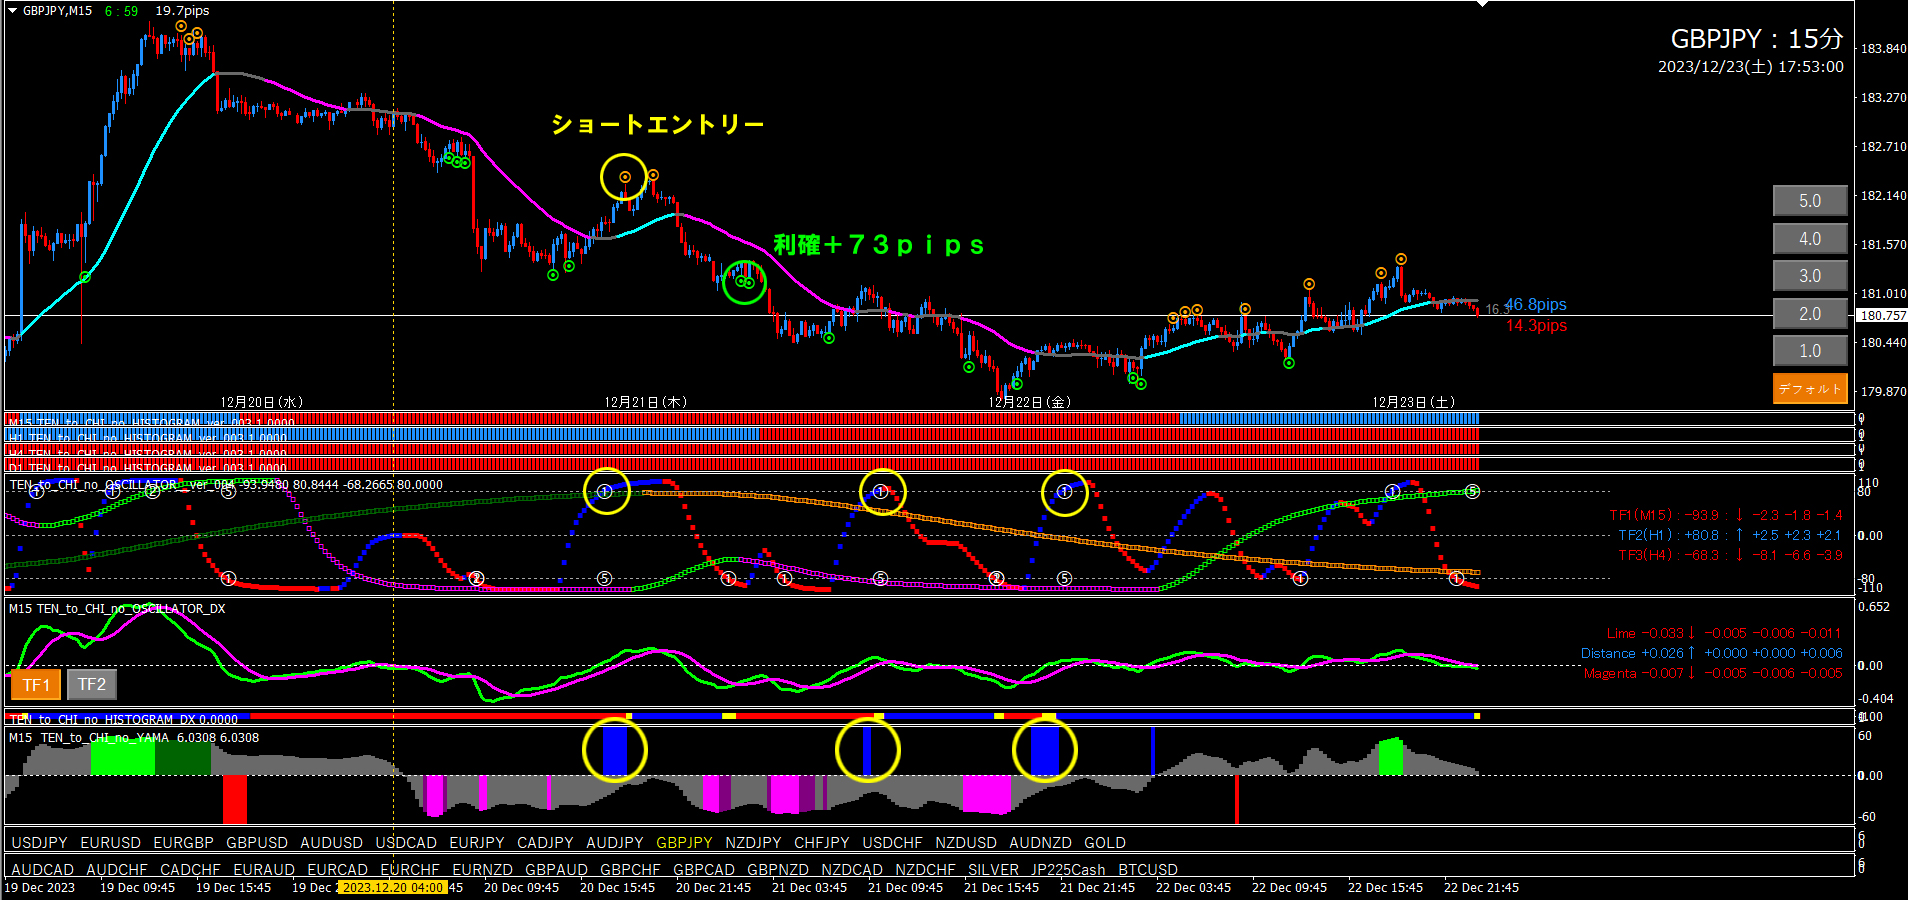
Yellow circle is the short entry point. Green circle is the point where profit was taken based on a long-entry signal.
While the TF2 is descending, a short entry signal, or Oscillator signal of type ⑤, or a Short valley can serve as an entry trigger.
EA Pattern ⑦
【Entry Filter】
・Oscillator TF2 color is magenta (ON/OFF toggle available)
・Line color is magenta or gray (ON/OFF toggle available)
【Entry Trigger】※ Entry count can be configured
・Candles touch and confirm the line
・Or after breaking from top to bottom confirmed
【Take Profit, Stop Loss】
・Appearance of long-entry signal.
・Line color turns lime.
・Oscillator TF2 turns lime.
Of course, you can use this method manually without EA Pattern ⑦. Please give it a try.

That is all.
We hope this will be of some help to everyone.
