

Utilization of "Visualization Indicator" (Part 126)
"Visualization Indicator" utilization (part126)
1. Further evolving the "28 Currency Pairs List Indicator" into an indicator
"8CP Visualization Indicator to draw AUDJPYon chart
"8CP Visualization Indicator" includesOceania version,London version,NewYork version,AnyCP version. This time, we used theOceania version.
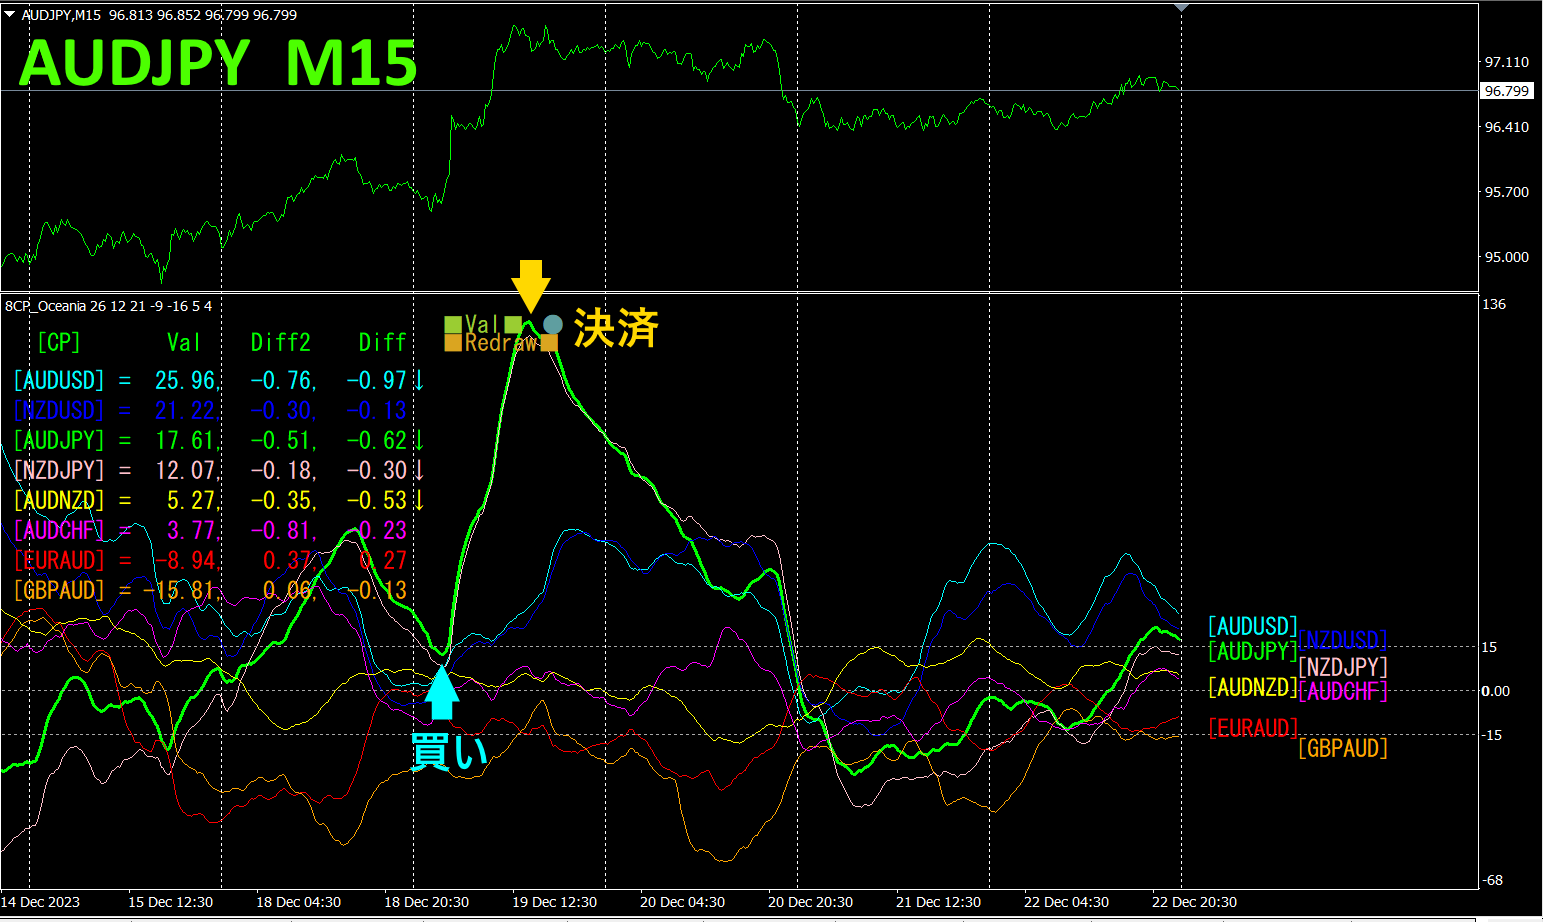
The upper half is a 15-minute chart ofAUDJPY. The lower half is from the "8CP Visualization Indicator". The green thick-line graph corresponds toAUDJPY.
On Tuesday,AUDJPY rose above the group of charts, so we entered a buy. We will exit when it tops out and reverses on the same day.Approximately160 pips of profit was made.With the "8CP Visualization Indicator", by simply focusing on the greatest moving currency pair, you can trade efficiently.
2. Best Select Try the Indicator
The figure below is a screenshot taken on2023 year12 month19 day19:43 (JST)
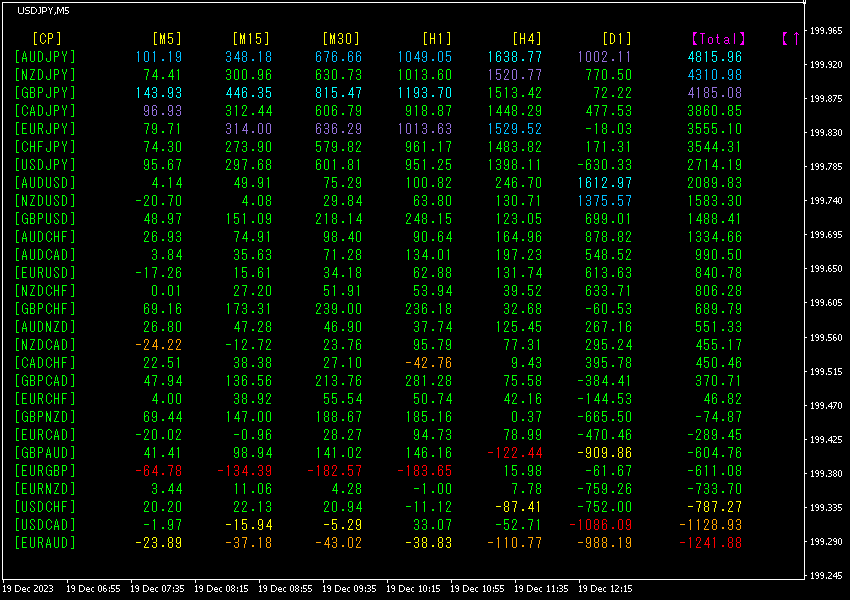
Total The rows are sorted in descending order of Total. The top row isAUDJPY, showing blue display colors across all timeframes, and the Total value is +4815.96, indicating a large positive number.AUDJPY is indicating a strong upward trend.
Now, let's look at the chart ofAUDJPY.
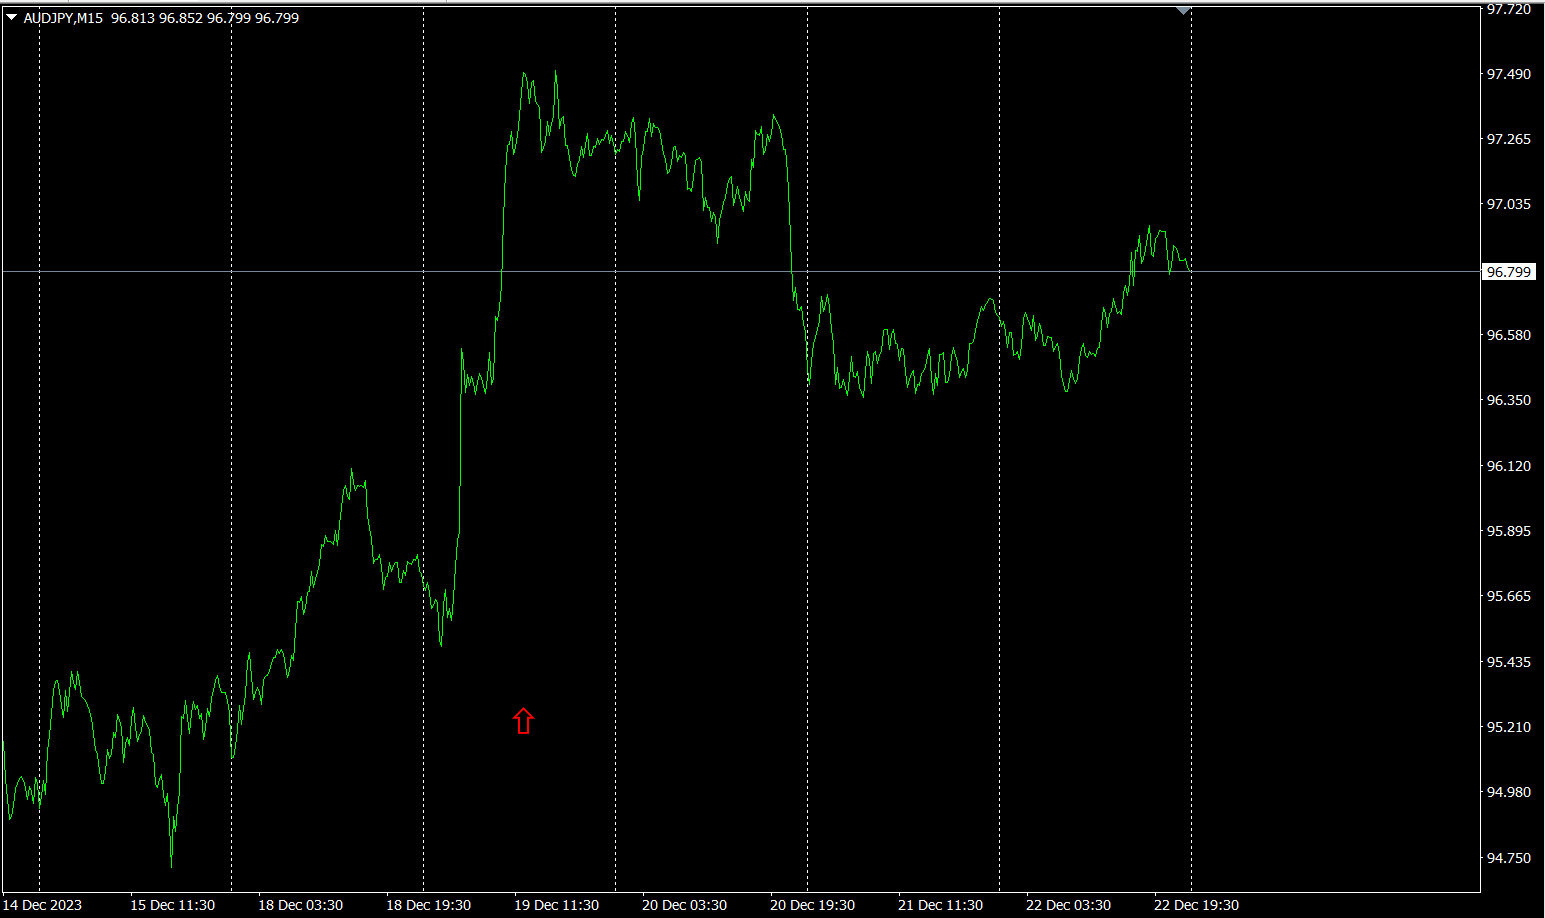
The red arrows indicate the point at which the screenshot was taken, capturing a sharp rise.
"28 currency pairs Best Select Indicator allows you to easily identify which currency pair among 28 is currently exhibiting the strongest trend. It also tells you, with numbers and colors, whether you should trade now. It’s an excellent indicator for assessing all currency pairs at a glance.
"28 currency pairs Best Select Indicator
https://www.gogojungle.co.jp/tools/indicators/35128

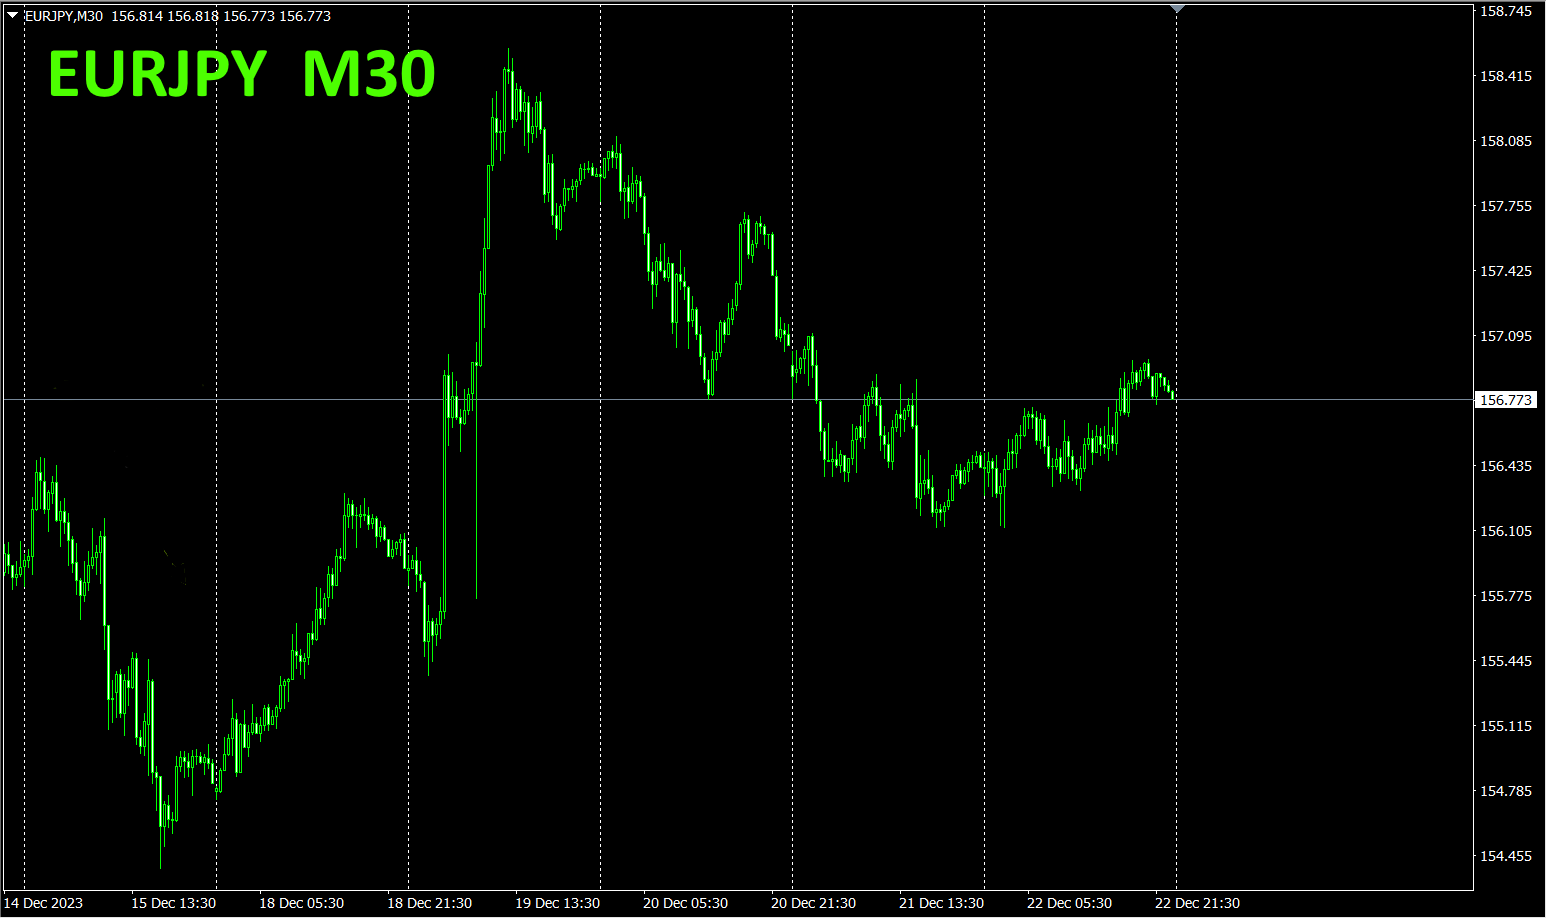
3. How has EURJPY moved since May of the year before last?
Since May year 2021, May. We are monitoring EURJPY., suggests tracking the behavior of
To view the overall trend, a 30-minute chart showing the most recent about3 weeks is drawn.
Last time, we wrote the following.
Both are pointing downward. EUR appears to be angled downward more thanJPY. In the future, is expected to trend downward somewhat, but a clear direction has not emerged.
30
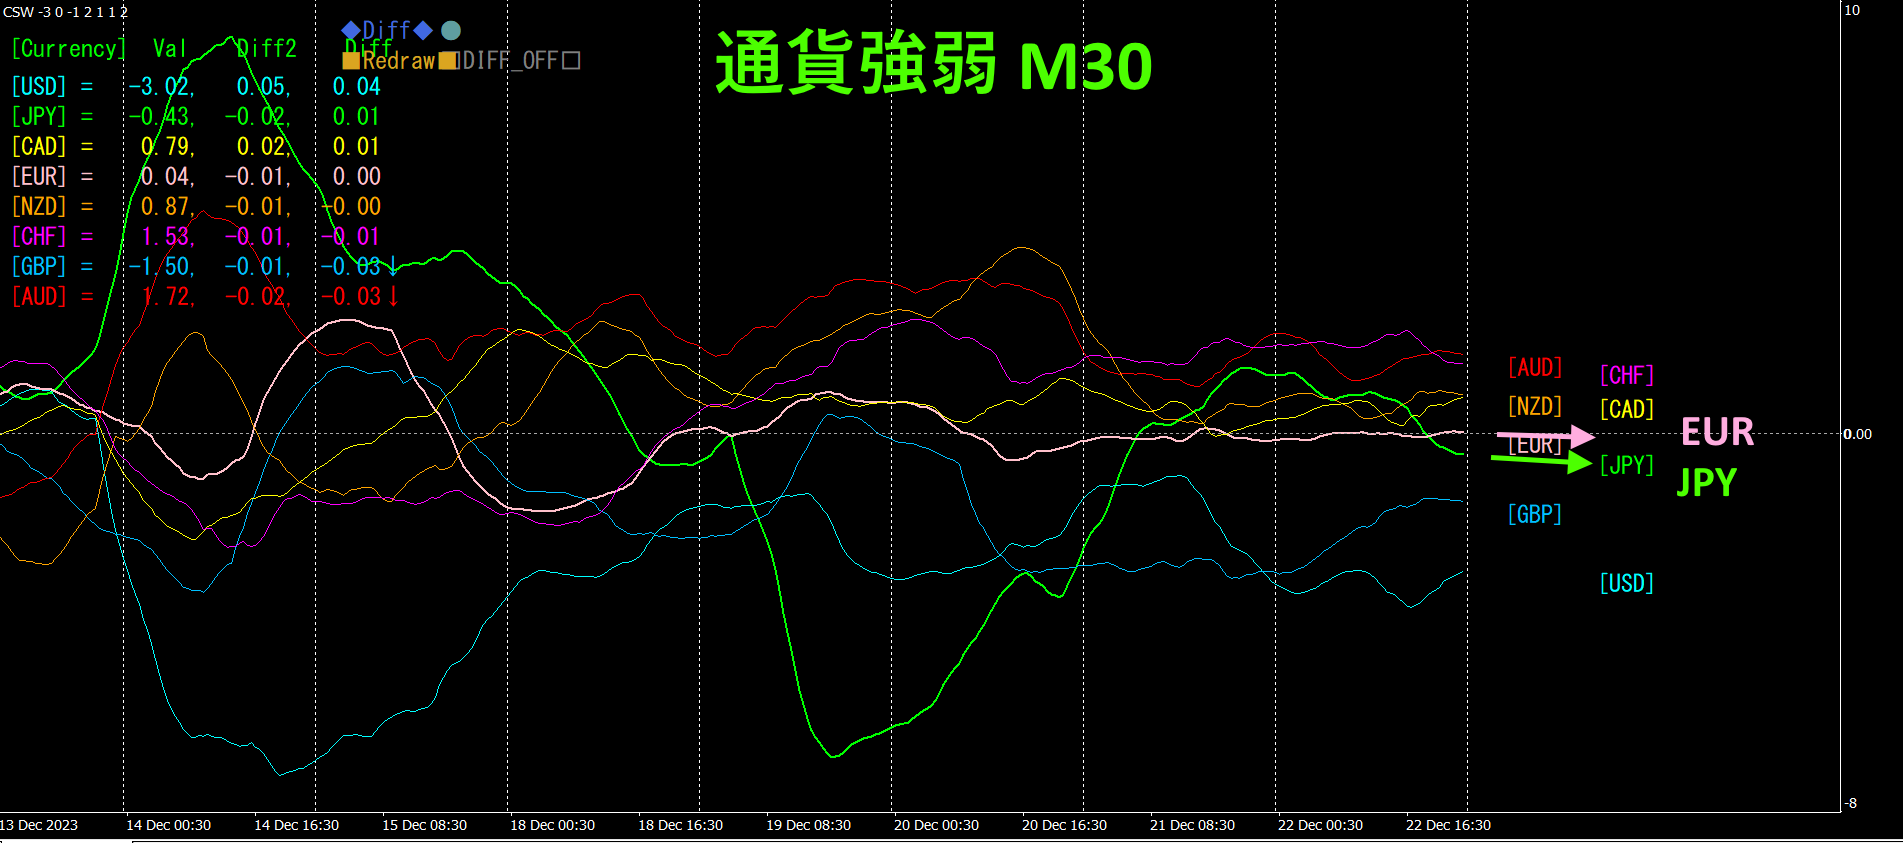
Pink indicatesEUR, green indicatesJPY. Both are mostly flat. Compared,JPY appears to have a slightly larger downward angle thanEUR. Future shows no clear directional bias.
4. Identify tops and bottoms from all currency pairs and build a trend strategy (target isNZDCHF)
2505 "Tops and Bottoms Search Indicator", used to select the currency pair located at the bottom, namelyNZDCHF. We aim for a rebound from the bottom.
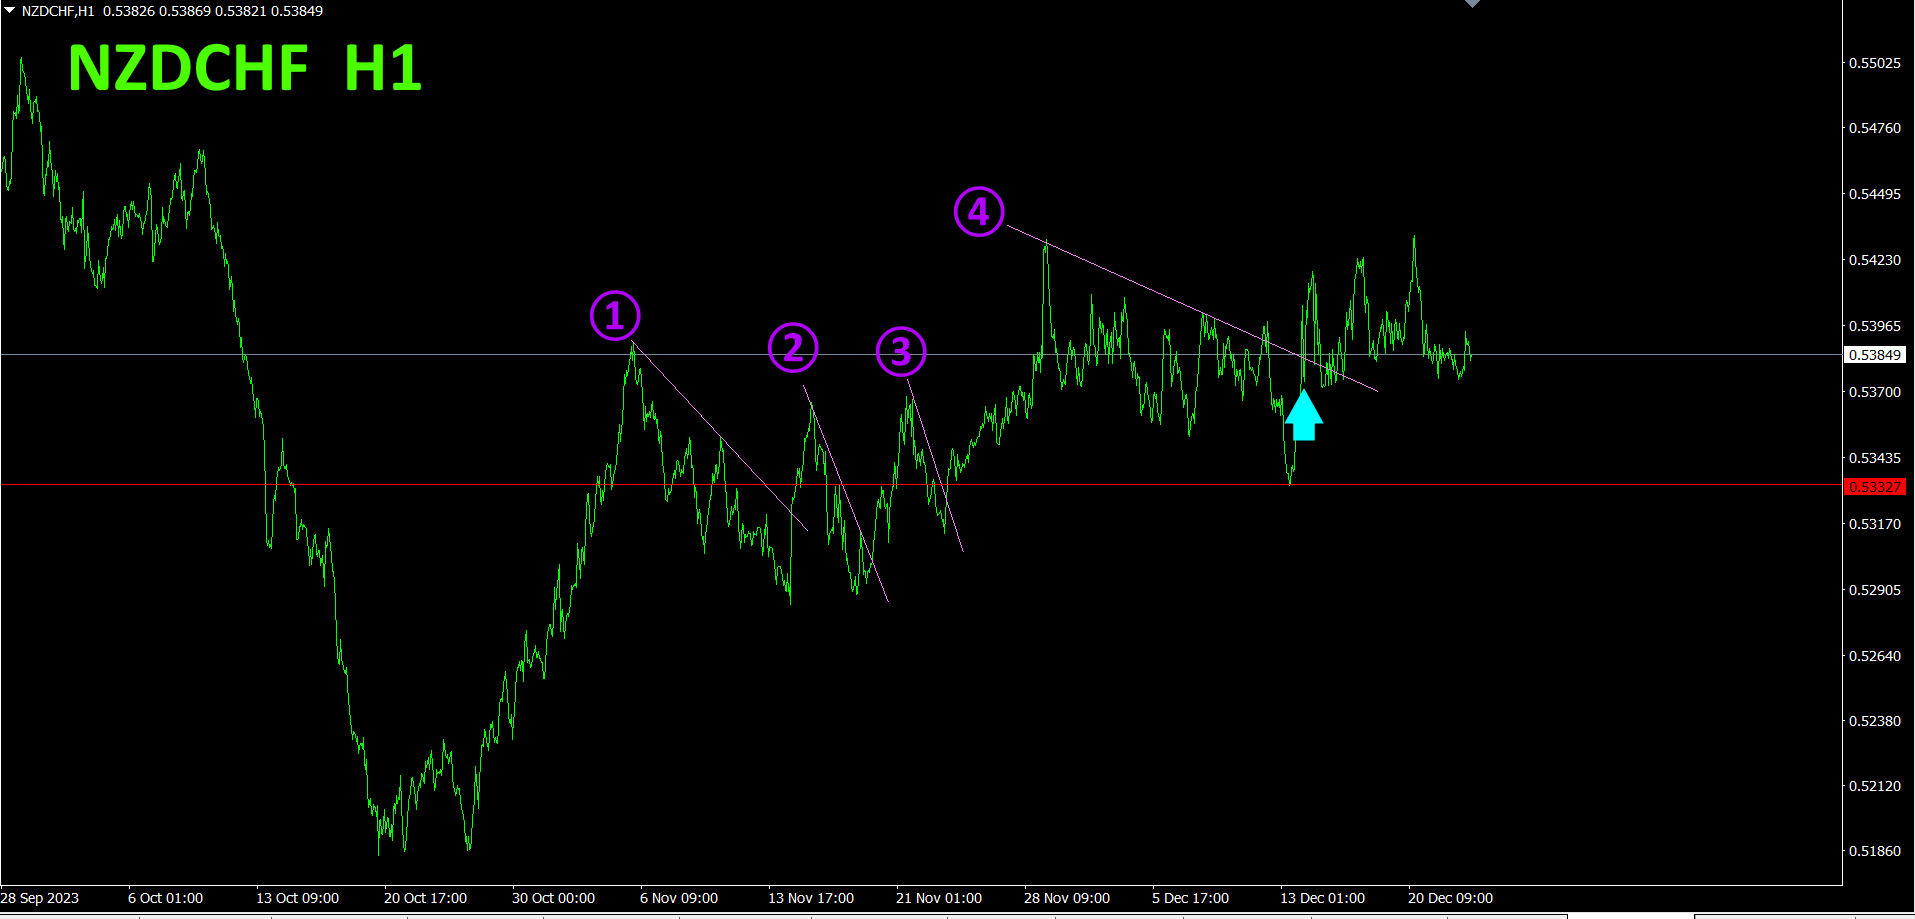
1., 2., 3., 4. If the price breaks above the downward-sloping lines, we buy; if it breaks below the rising trend line, we close. This yielded 40pips in ①, 60pips in ②, 58pips in ③, totaling158pips of profit.
When the line in ④ was broken upward, I placed a buy position with a light blue arrow, but it subsequently fell, so I closed at the entry price. I will continue to look for buying opportunities, but will stay on the sidelines for a while.
Refer to the 4-hour currency strength chart.
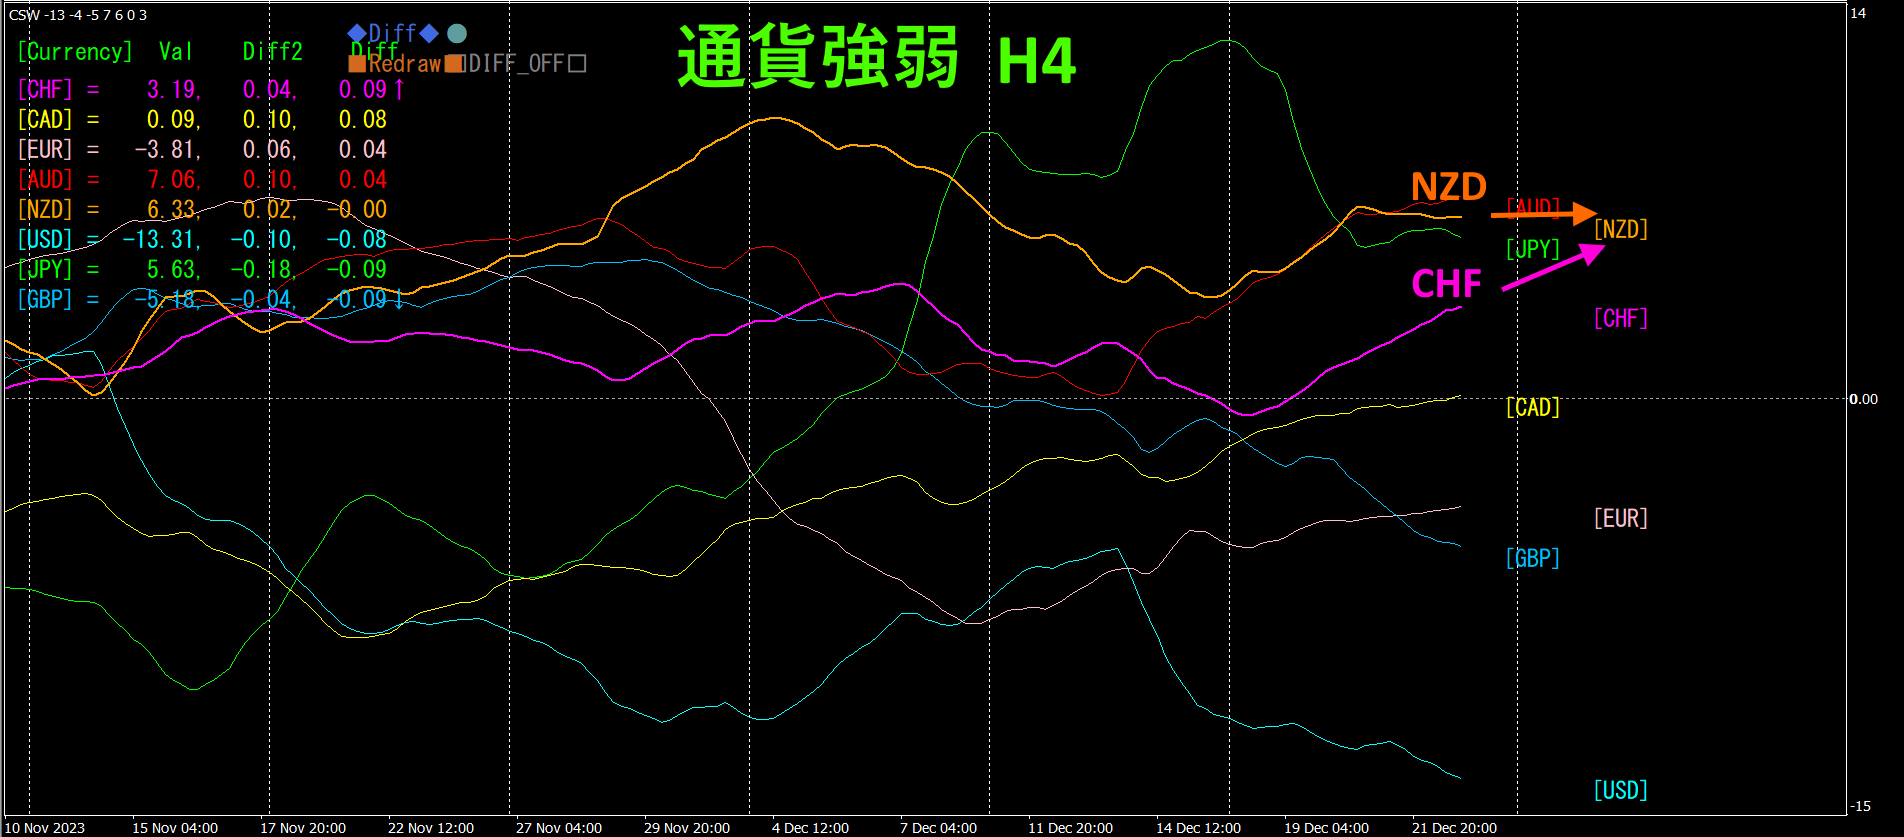
Red-violet isCHF, orange isNZD. CHF has a slight upward tilt. Meanwhile, is horizontal. Going forward, is expected to be slightly downward-biased.
With a semi-automaticEA, the "" lets you draw an oblique downward line; if it breaks upward, it automatically buys, and if it breaks above, it automatically closes—hands-off trading.
※""

https://www.gogojungle.co.jp/tools/indicators/42257
"8C Currency Strength Visualization Indicator" interest? Please refer to the page below.
MT4 version https://www.gogojungle.co.jp/tools/indicators/39150
MT5 version https://www.gogojungle.co.jp/tools/indicators/39159
【My listed products】


