

Utilizing the "Visualization Indicator" (Part 125)
“Visualization Indicators” usage (part125)
1. By further evolving the “28 Currency Pairs List Indicator,”
“8CP Visualization Indicator”to drawUSDJPY.
The “8CP Visualization Indicator” includesOceania版London版NewYork版AnyCP版. This time, we used theLondon版.
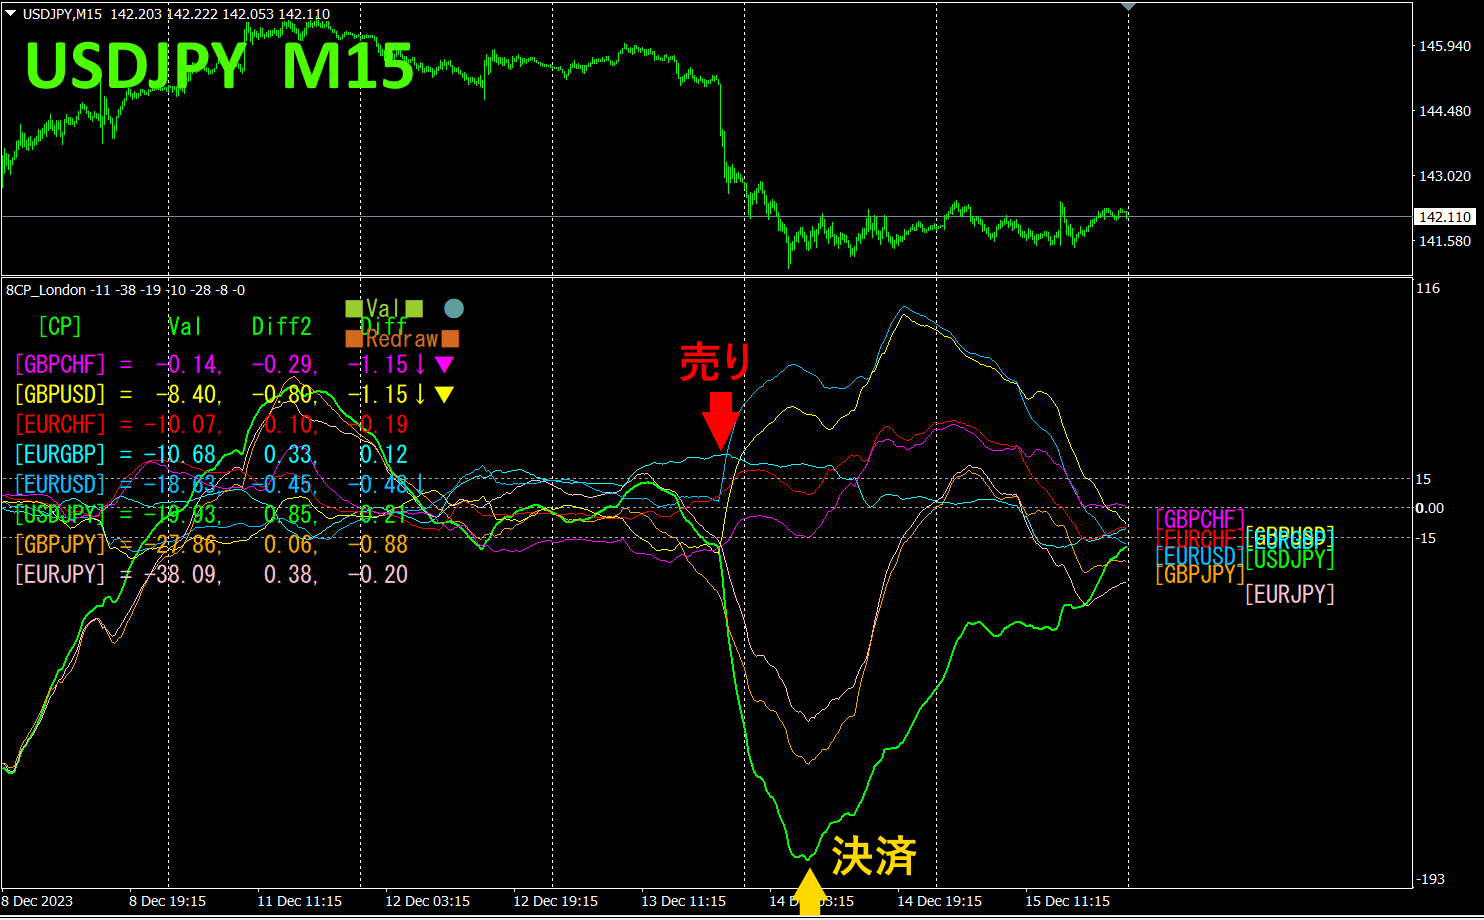
The upper half is aUSDJPY 15-minute chart. The lower half is from the “8CP Visualization Indicator.” The green thick-line graph corresponds toUSDJPY.
On Wednesday,USDJPY fell below the graph group, so we enter a sell. The next day, at the point of a bottom and reversal, we exit.Approximately250pips of profitwas obtained. With the “8CP Visualization Indicator,” you can conduct efficient trading simply by focusing on the movement of the most volatile currency pair.
2. Best SelectTry the Indicator
The diagram below is a screenshot taken on2023 year12 month14 day 04:13 (JST)
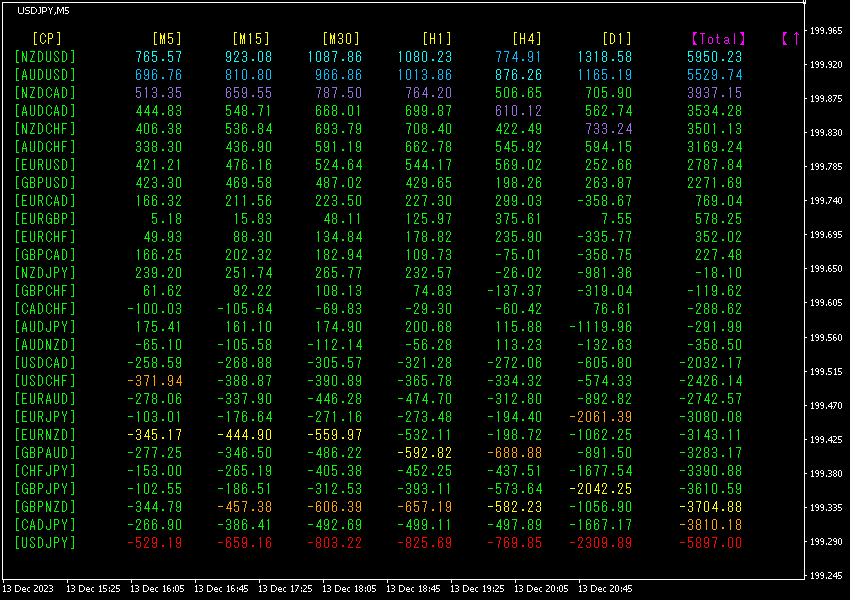
TotalNumbers are sorted in descending order. The topmost row,NZDUSD is blue across all timeframes,Totalvalue is +5950.23 indicating an extremely large positive figure.NZDUSD shows an extreme uptrend.
Now, let's look at theNZDUSDY chart.
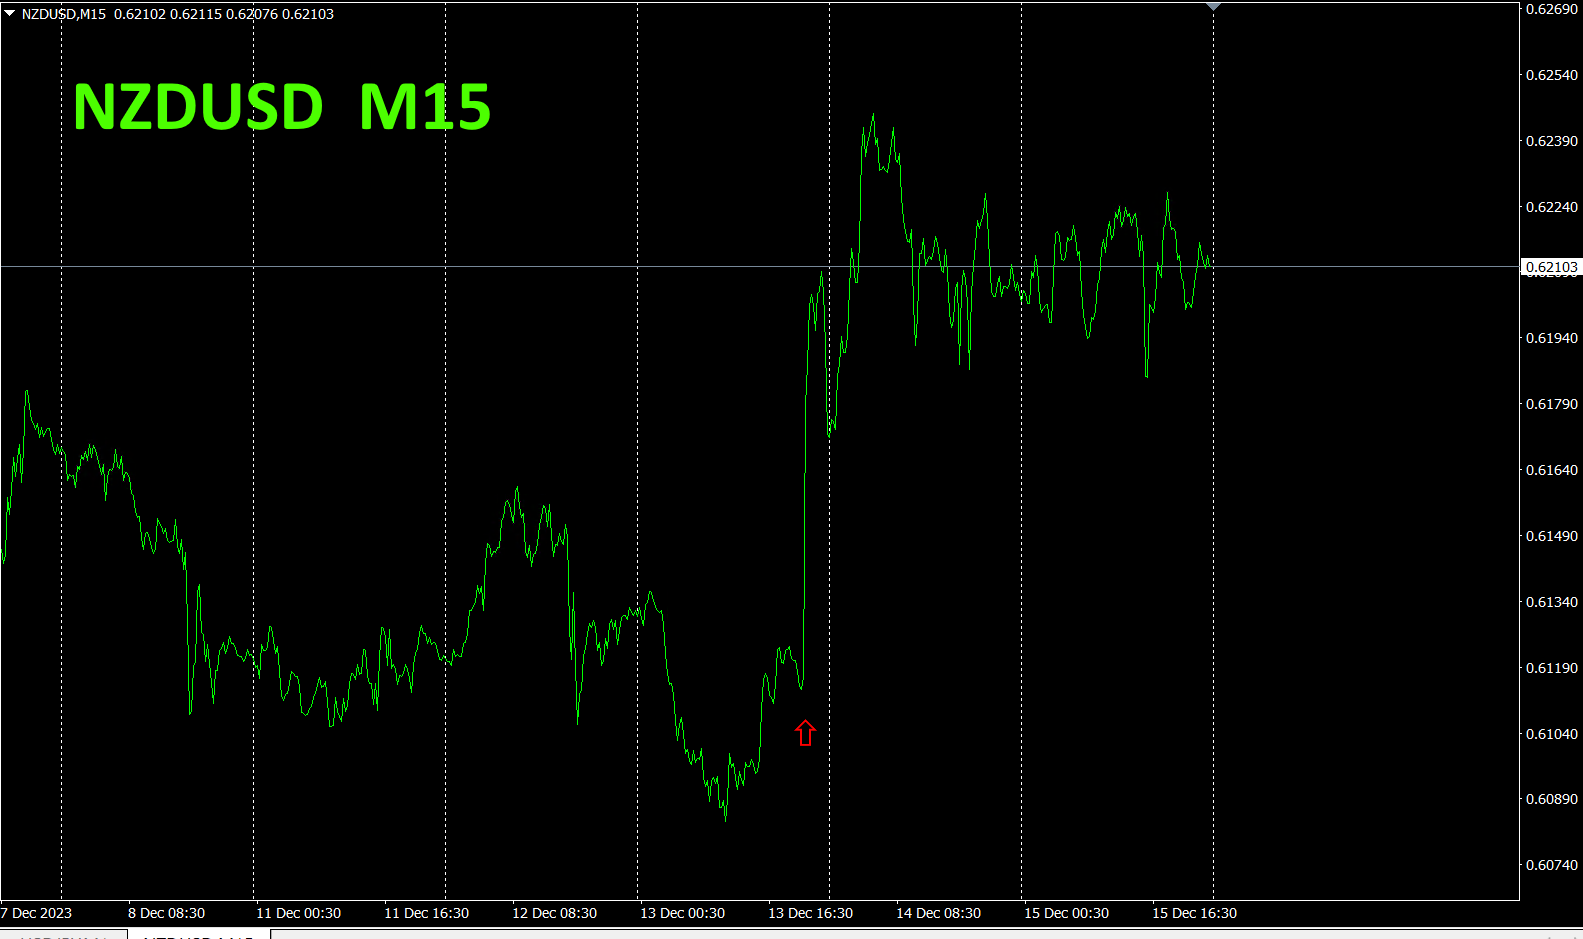
The red arrow marks where the screenshot was captured. It captures the rapid rise. If you had bought here and exited the next day, you would have earned about120pips in profit.
“28 Currency Pairs Best Select allows you to easily identify which currency pair among 28 is currently showing the strongest trend. It also tells you whether to trade now via numeric and color cues. It’s an excellent indicator for quickly assessing all currency pairs at a glance.
“28 Currency Pairs Best Select Indicator”
https://www.gogojungle.co.jp/tools/indicators/35128

3. What happened to EURJPY, tracked since last year’s May5?
Since May2021 the movement ofEURJPY has been tracked.
To view the overall trend, a30-minute chart has been drawn covering roughly the past3 weeks.
Last time I wrote the following.
JPY andEUREURJPY is expected to rise.
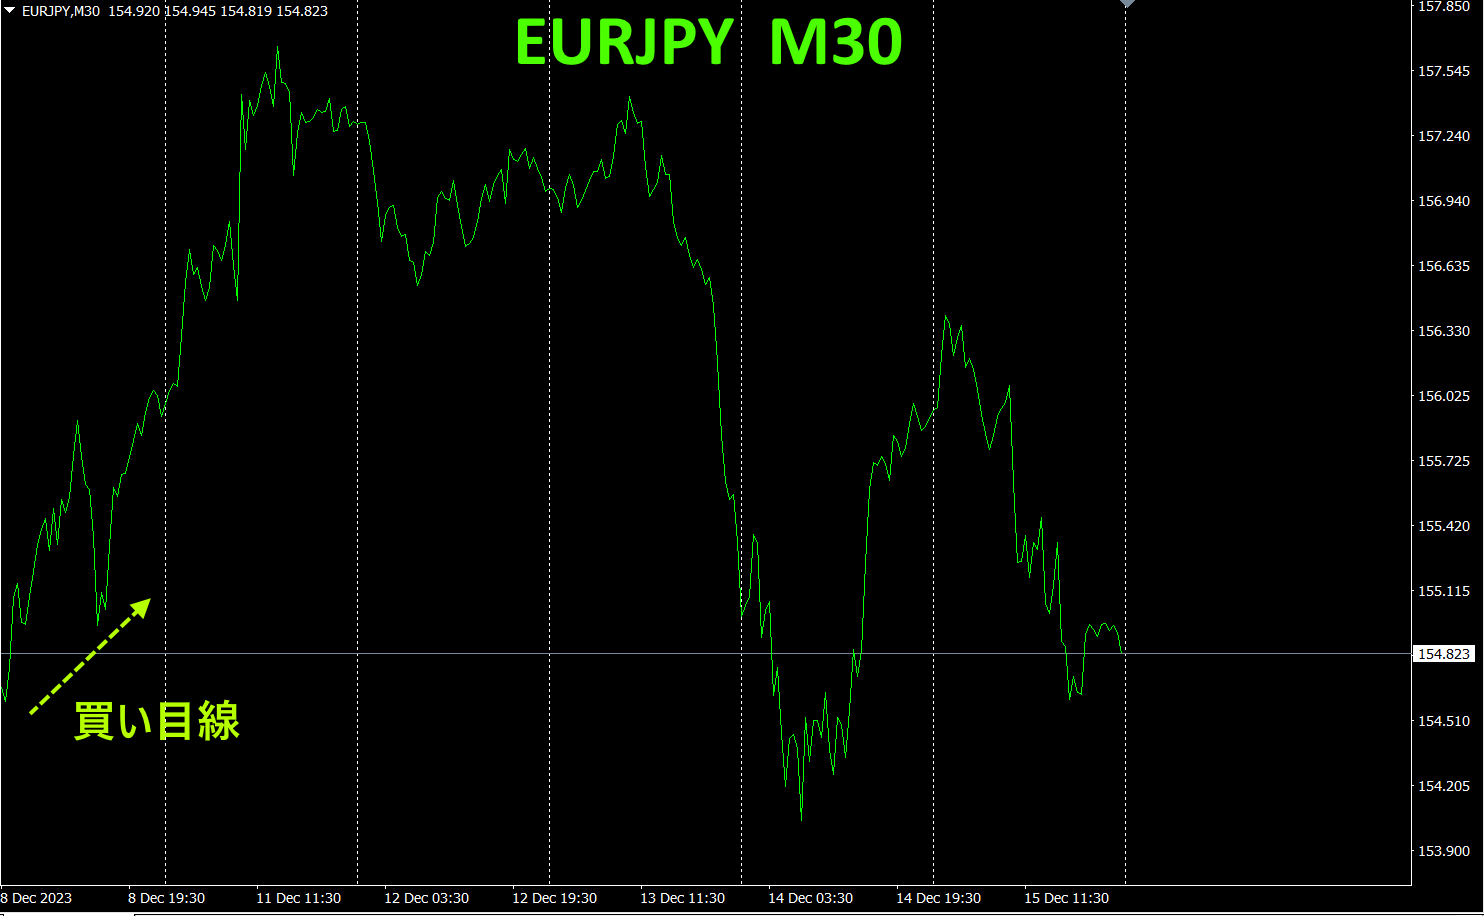
As predicted, it rose on Monday. From Monday morning to noon, about160pips profit was earned.
30-minute currency strength chart.
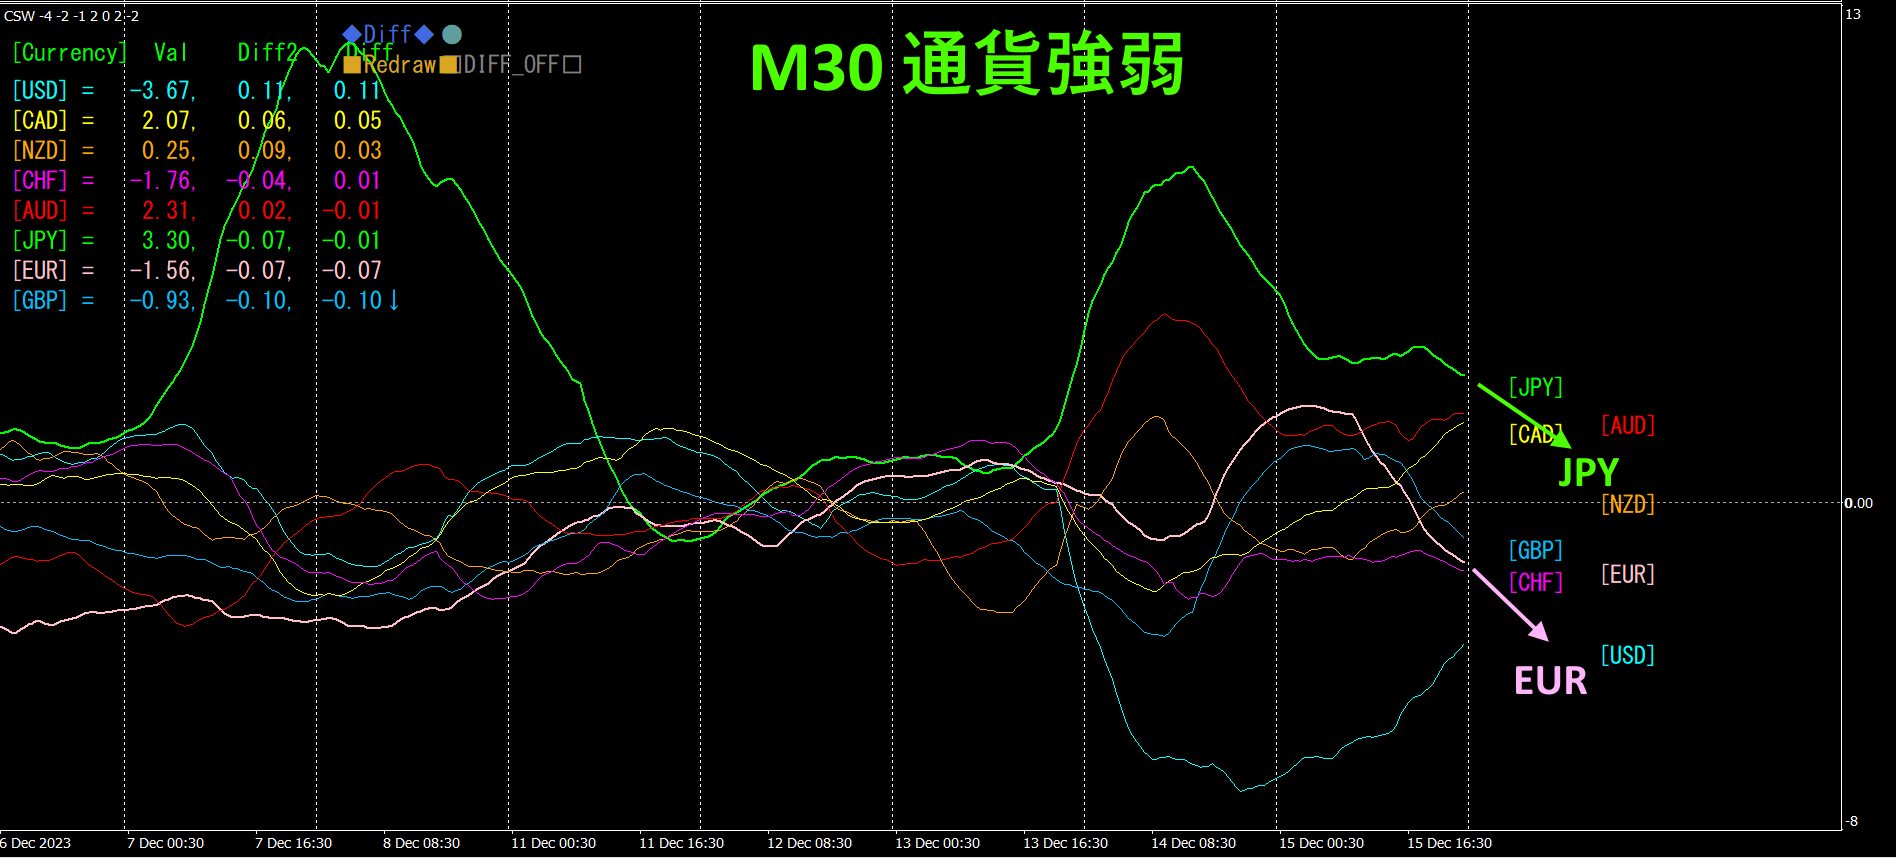
Pink showsEUR, green showsJPYEURJPYEURJPY is expected to be slightly downward, but a clear direction is not yet established.
4. Identify tops and bottoms across all currency pairs and build a trend strategy (target:NZDCHF)
2505“Top/Bottom Search Indicator” was used, selectingNZDCHF as the bottom-positioned currency pair. The goal is to rise from the bottom.
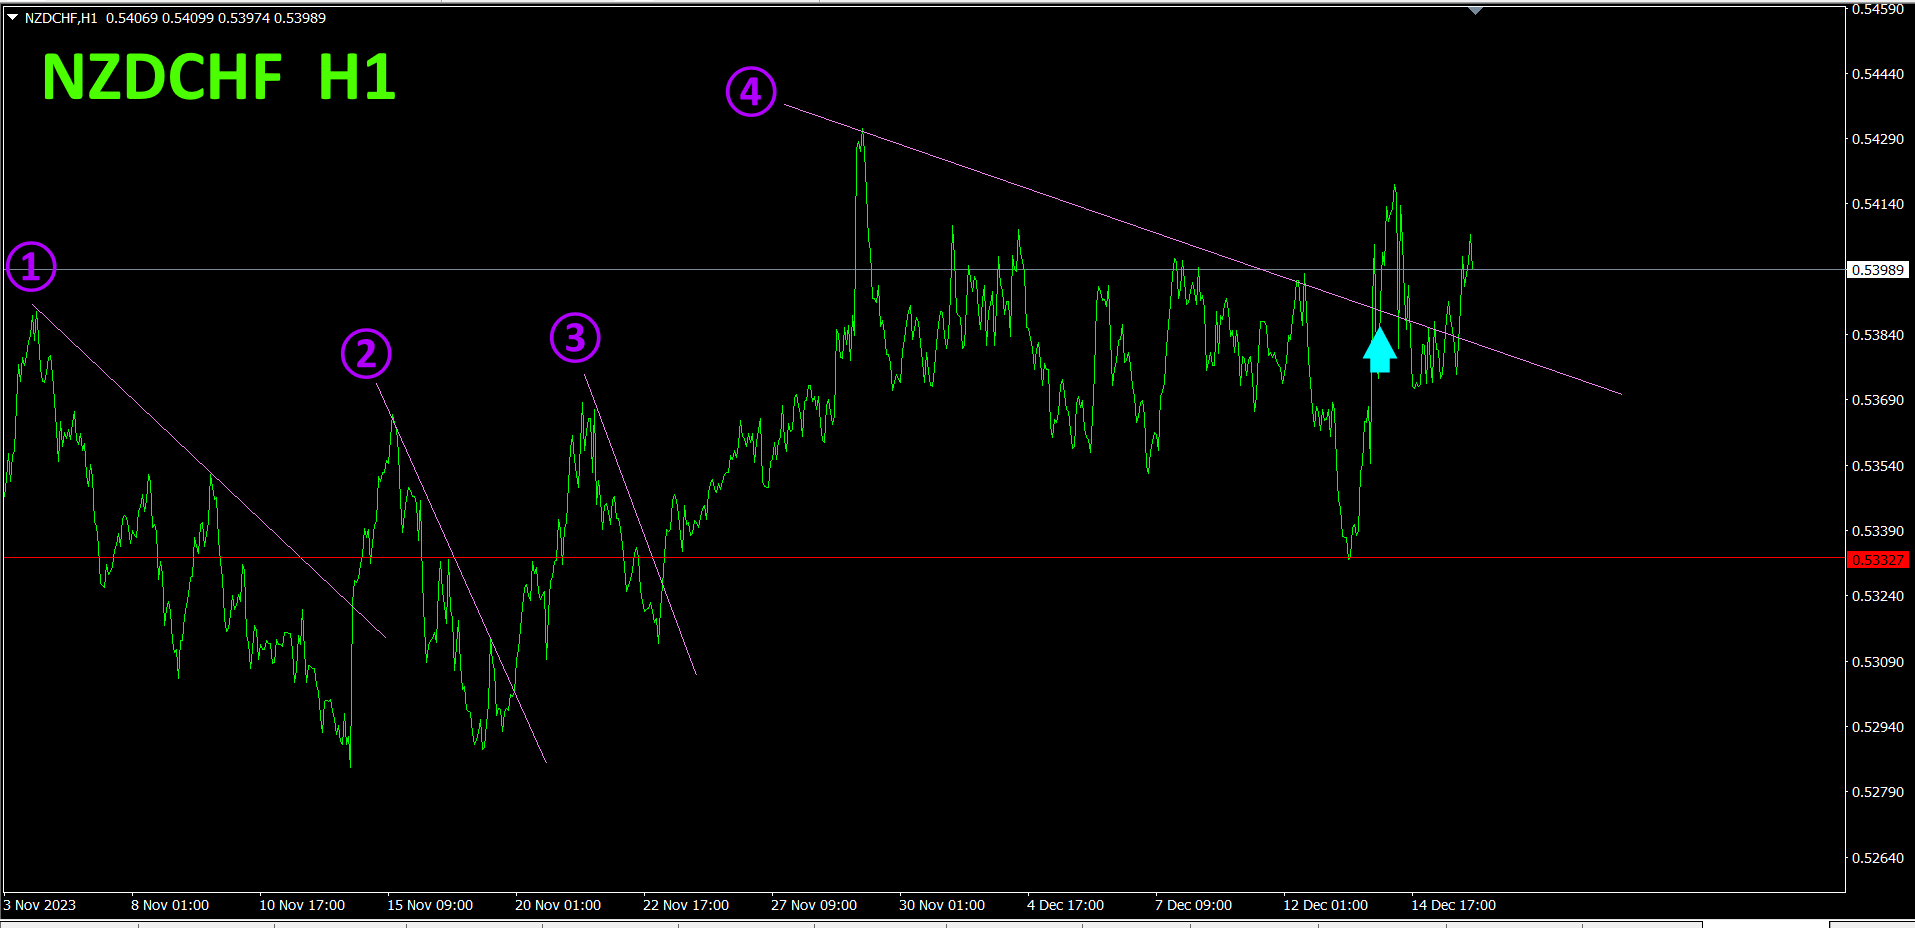
If ①, ②, ③, ④ breakout of the descending lines occurs, buy, and if the rising trend line is broken, exit. At ①,40pips, at ②60pips, at ③58pips, totaling158pips profit.
Because the breakout of the ④ descending line occurred, I placed a buy position with a light blue arrow. The red horizontal line is a resistance line. It is unlikely to move below this. Going forward, continue to focus on buying and trade accordingly.
Refer to the 4-hour currency strength chart.
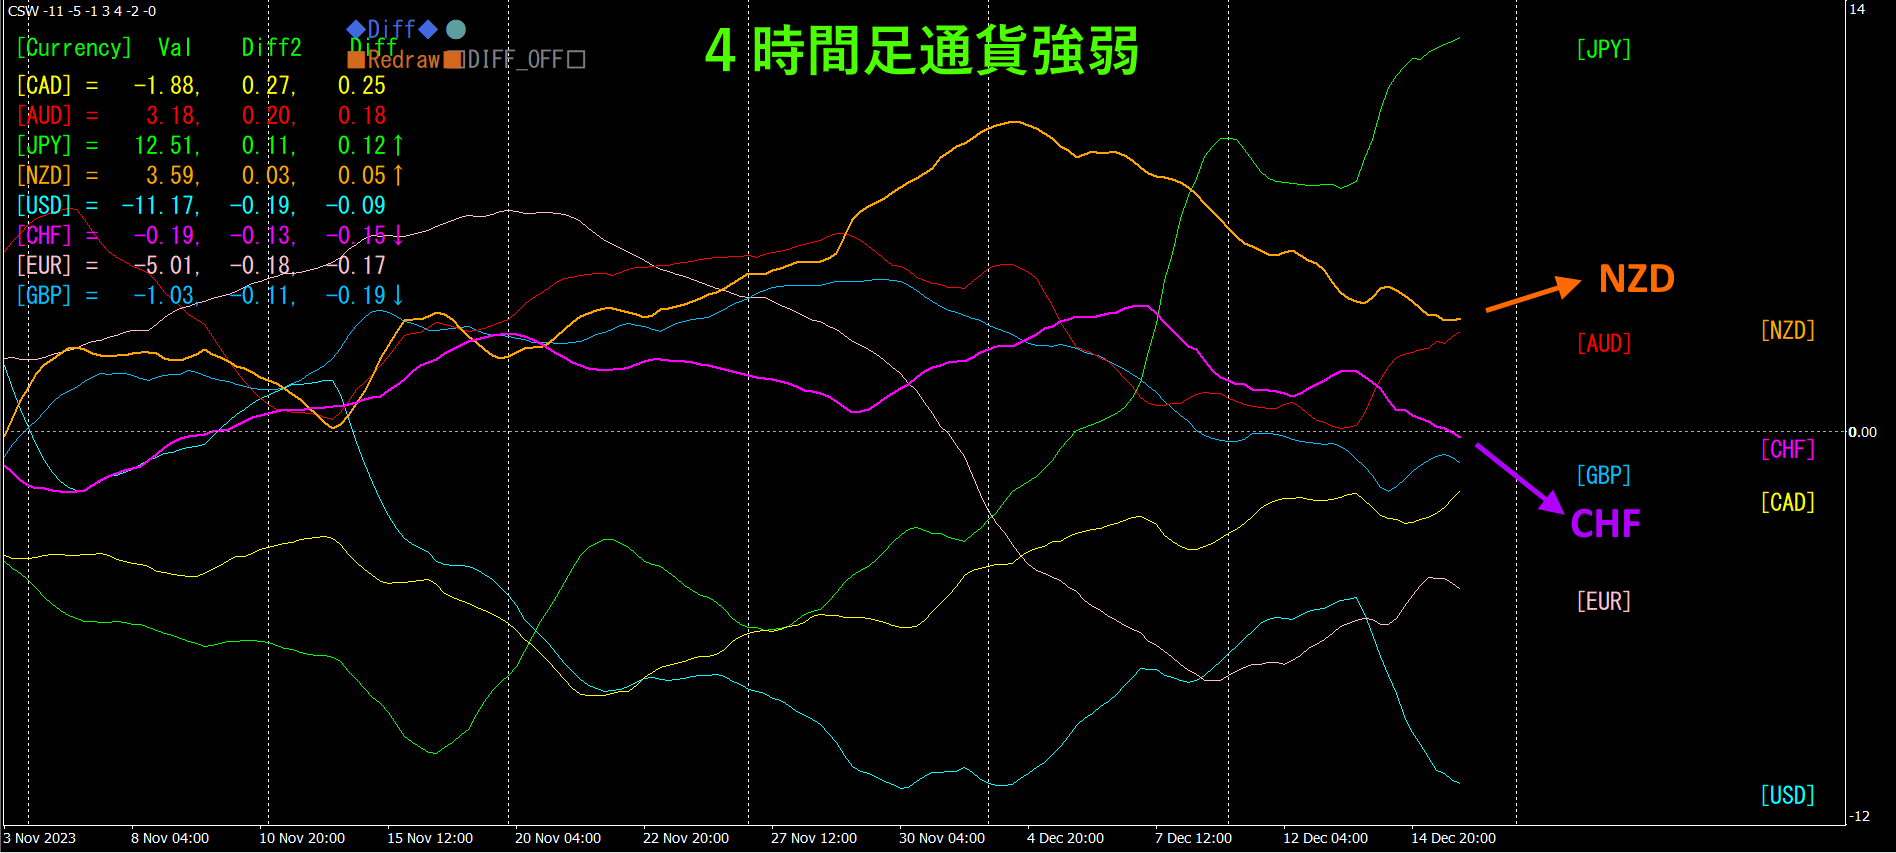
Red-purple isCHF, orange isNZD.NZDCHFNZDCHF
With a semi-automaticEA, the “Trend Line EX” allows you to draw slanted descending lines and automatically buy when broken, and automatically exit when the rising line is broken, enabling a hands-off trading style.
“Trend Line EX

https://www.gogojungle.co.jp/tools/indicators/42257
“8C Currency Strength Visualization Indicator”
MT4 version https://www.gogojungle.co.jp/tools/indicators/39150
MT5 version https://www.gogojungle.co.jp/tools/indicators/39159
【My listed products】


