

Utilization of the "Visualization Indicator" (Part 124)
“Visualizing Indicators” usage (part124)
1. Advance and develop the “28 Currency Pair List Indicator” into an indicator
“8CPVisualizing Indicator” to plotGBPJPY.
The “8CPVisualizing Indicator” hasOceania edition,London edition,NewYork edition,AnyCP edition. This time, we used theLondon edition.
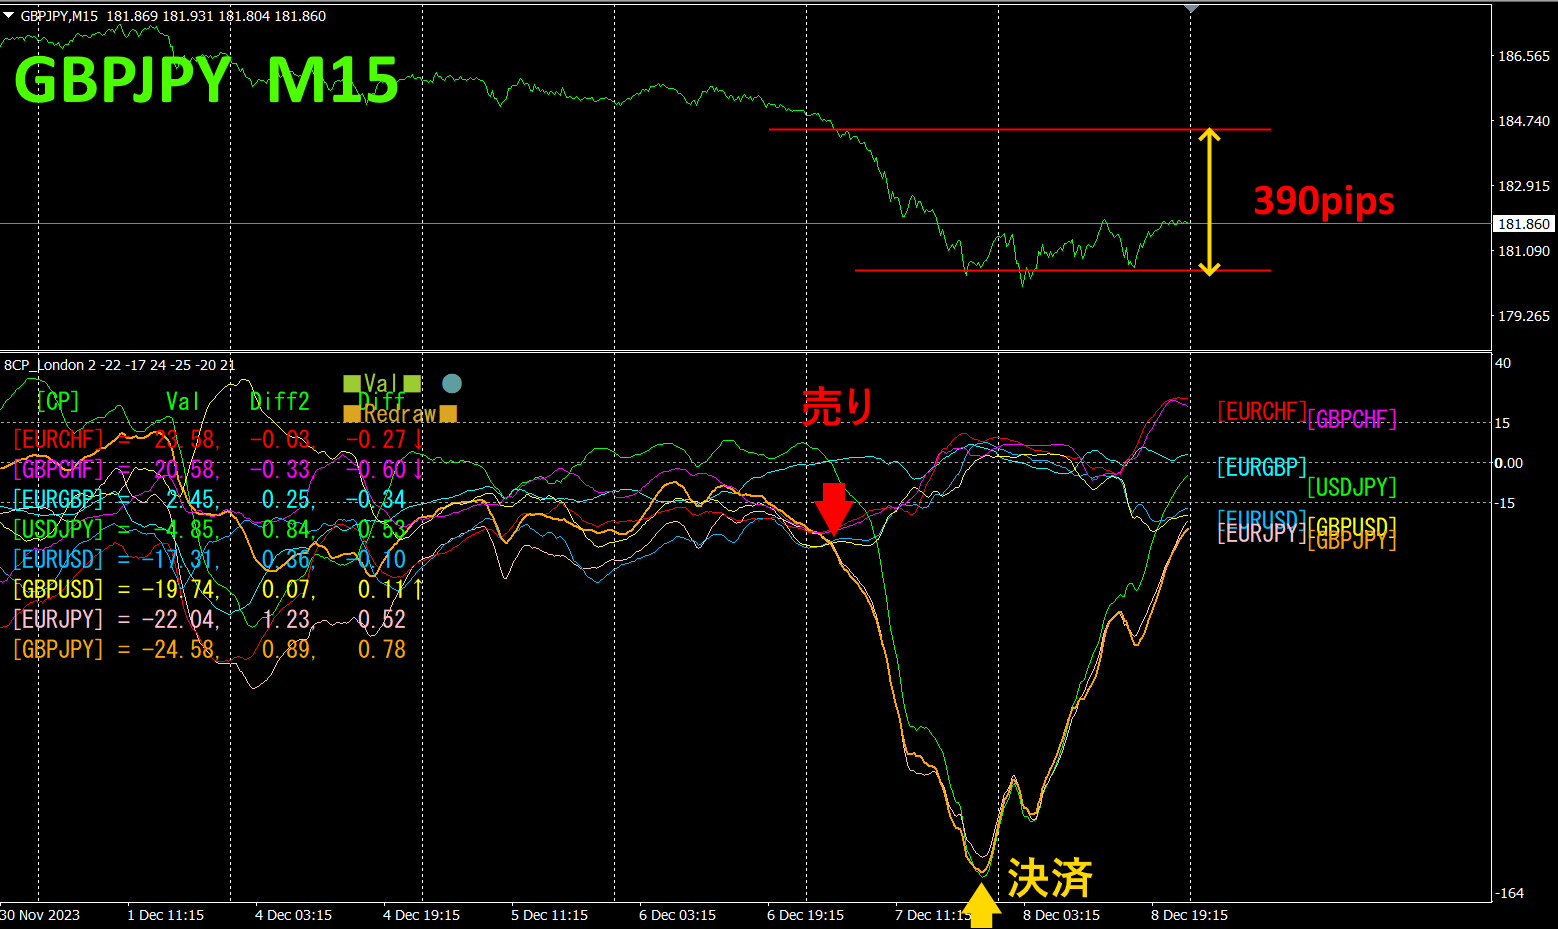
The upper half is a 15-minute chart ofGBPJPY. The lower half is from the “8CPVisualizing Indicator.” The orange thick line graph corresponds toGBPJPY.
On Thursday,GBPJPY broke below the cluster of graphs, so I entered a sell. I will exit when it bottoms and reverses that day.Approximately390pips of profit was obtained. With the “8CPVisualizing Indicator,” by focusing only on the most volatile currency pair, you can trade efficiently.
2. Best SelectTry the Indicator
The following is a screenshot from2023 year12 month7 day23:41JST
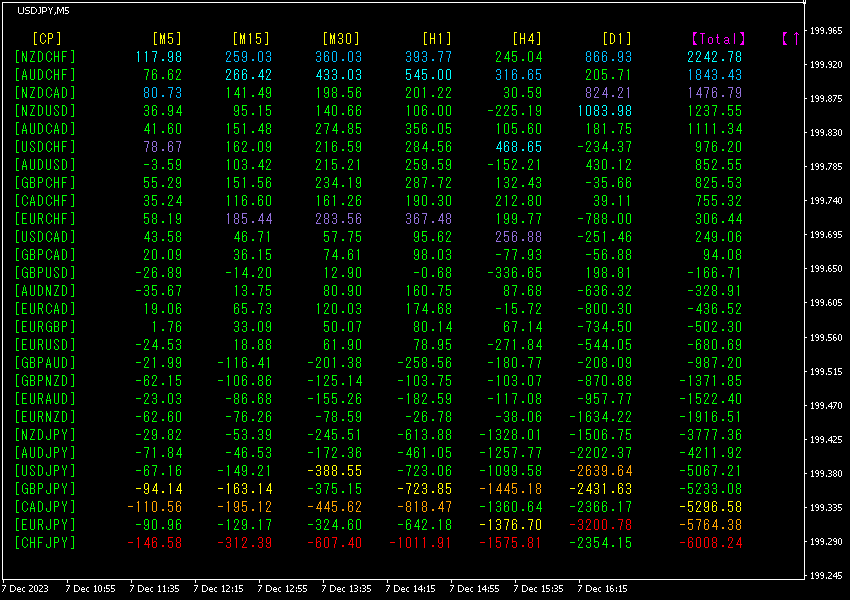
Totalnumbers are sorted in descending order. The bottom line showsCHFJPY,D1 is excluded for all timeframes and theTotal value is-6008.24, indicating an extremely large negative figure.CHFJPY is in a sharp decline trend.
Now, let's look at theCHFJPY chart.
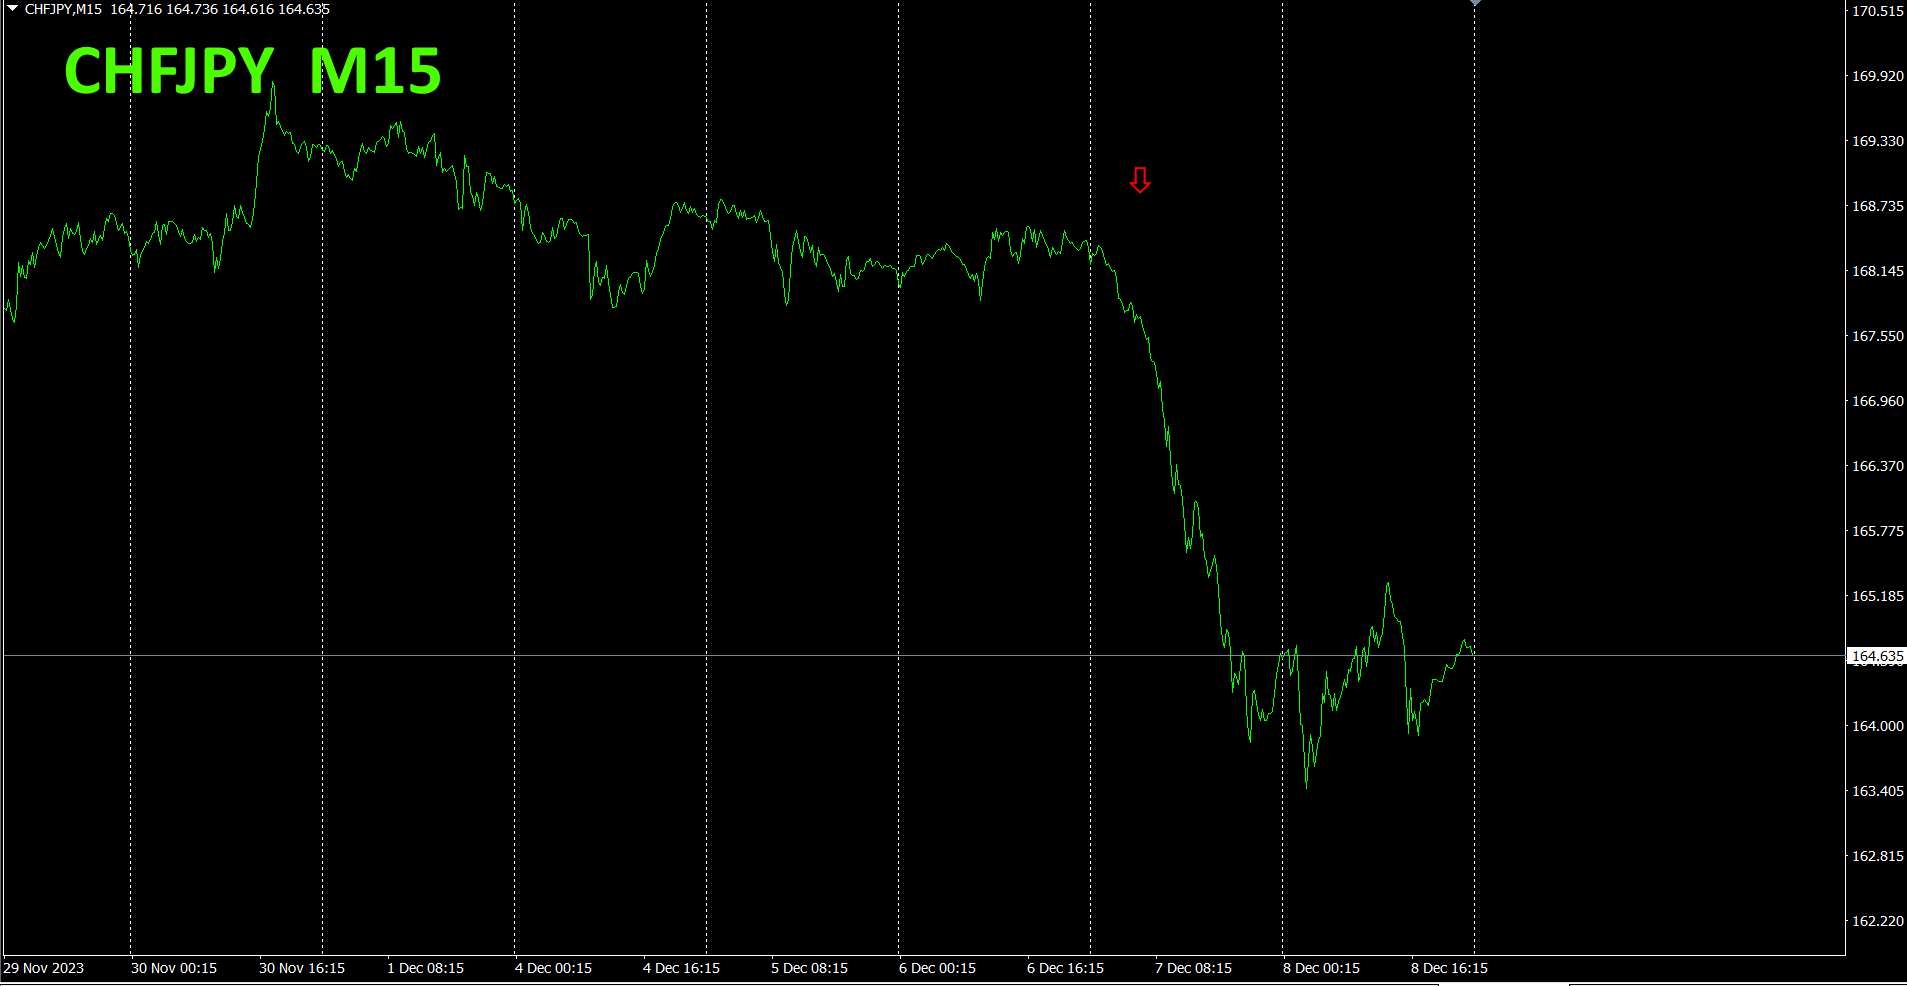
The red arrows indicate the captured screenshot location. It captures a steep drop in the middle of a downtrend. If you short here and close at the bottom, you could gain about430pips of profit.
“28 currency pairsBest Select indicator allows you to easily identify which of the 28 currency pairs is showing the strongest trend. It also tells you, in numbers and colors, whether you should trade now. It lets you judge all currency pairs at a glance.
“28 currency pairsBest Select indicator
https://www.gogojungle.co.jp/tools/indicators/35128

3. Since May of the year before last, what happened with EURJPY?
From year5 month, has been tracked.
To view the overall trend, we draw about the last30 minutes over roughly3 weeks.
Last time, I wrote the following.
If the direction of the currency strength chart continues, EURJPY is likely to fall further.
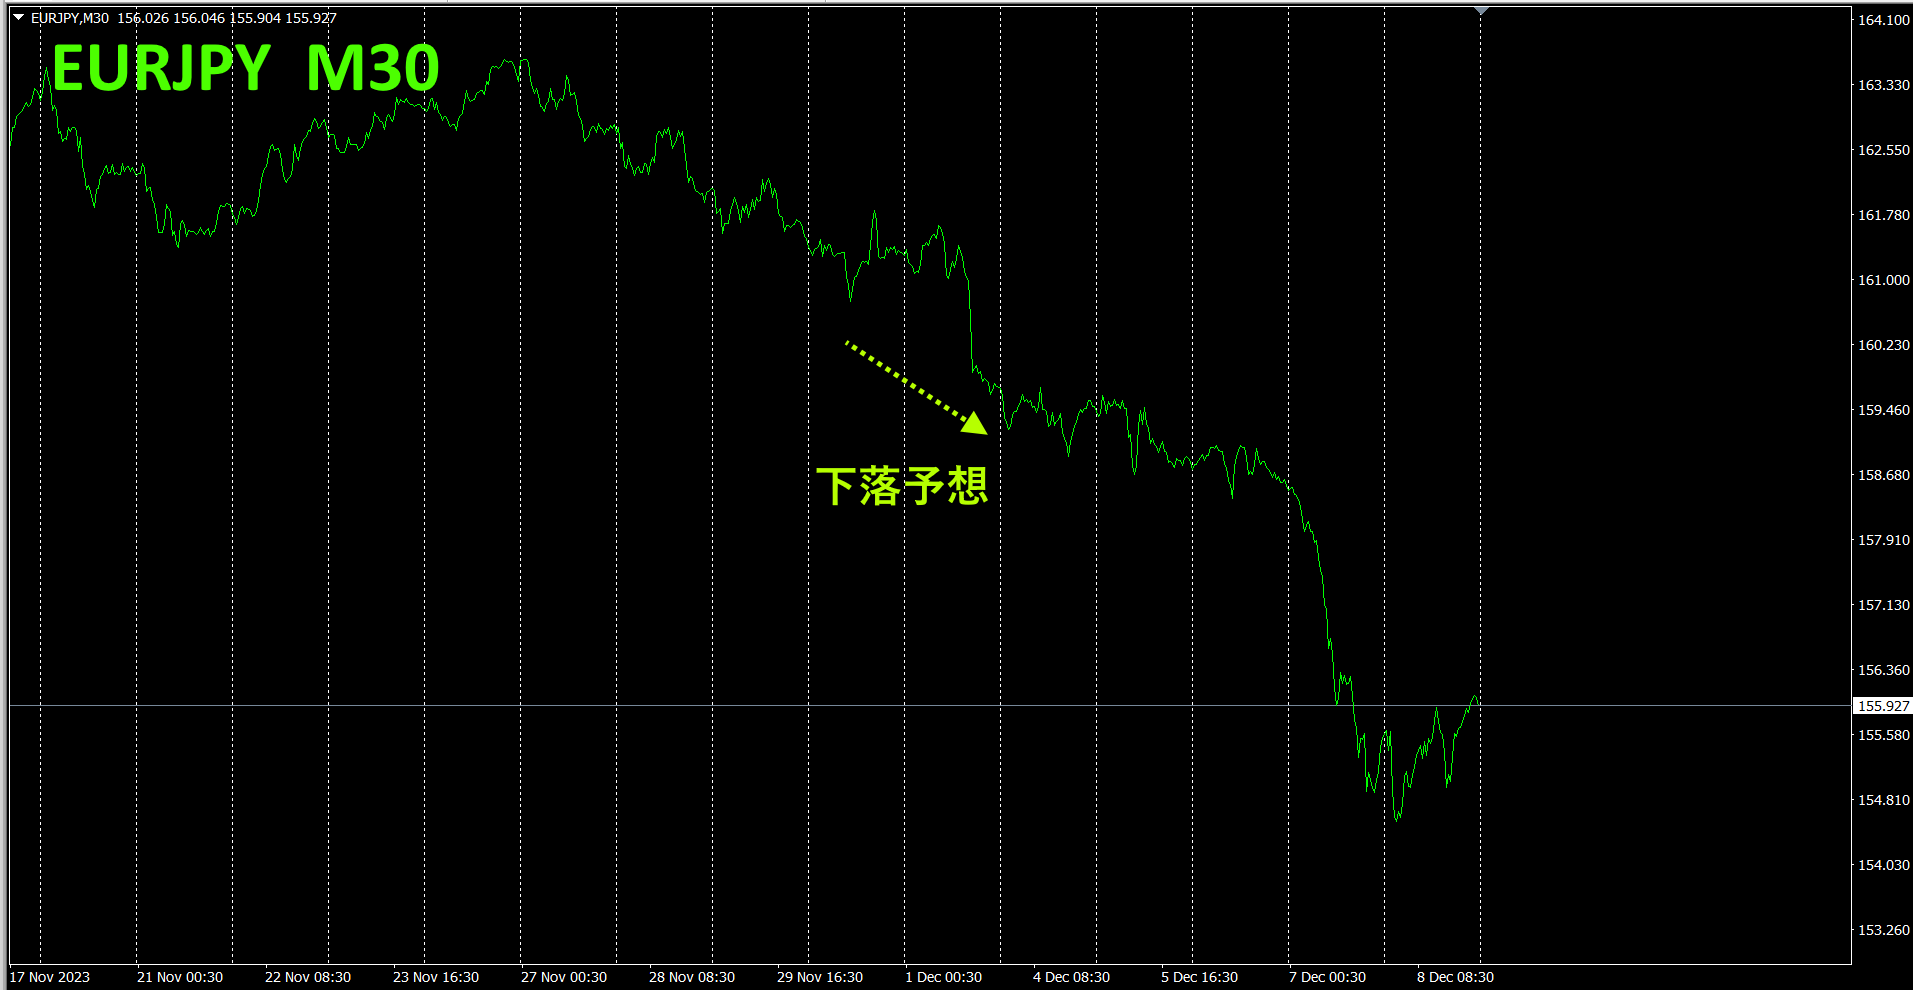
As predicted, it fell.
30 minutes chart of currency strength
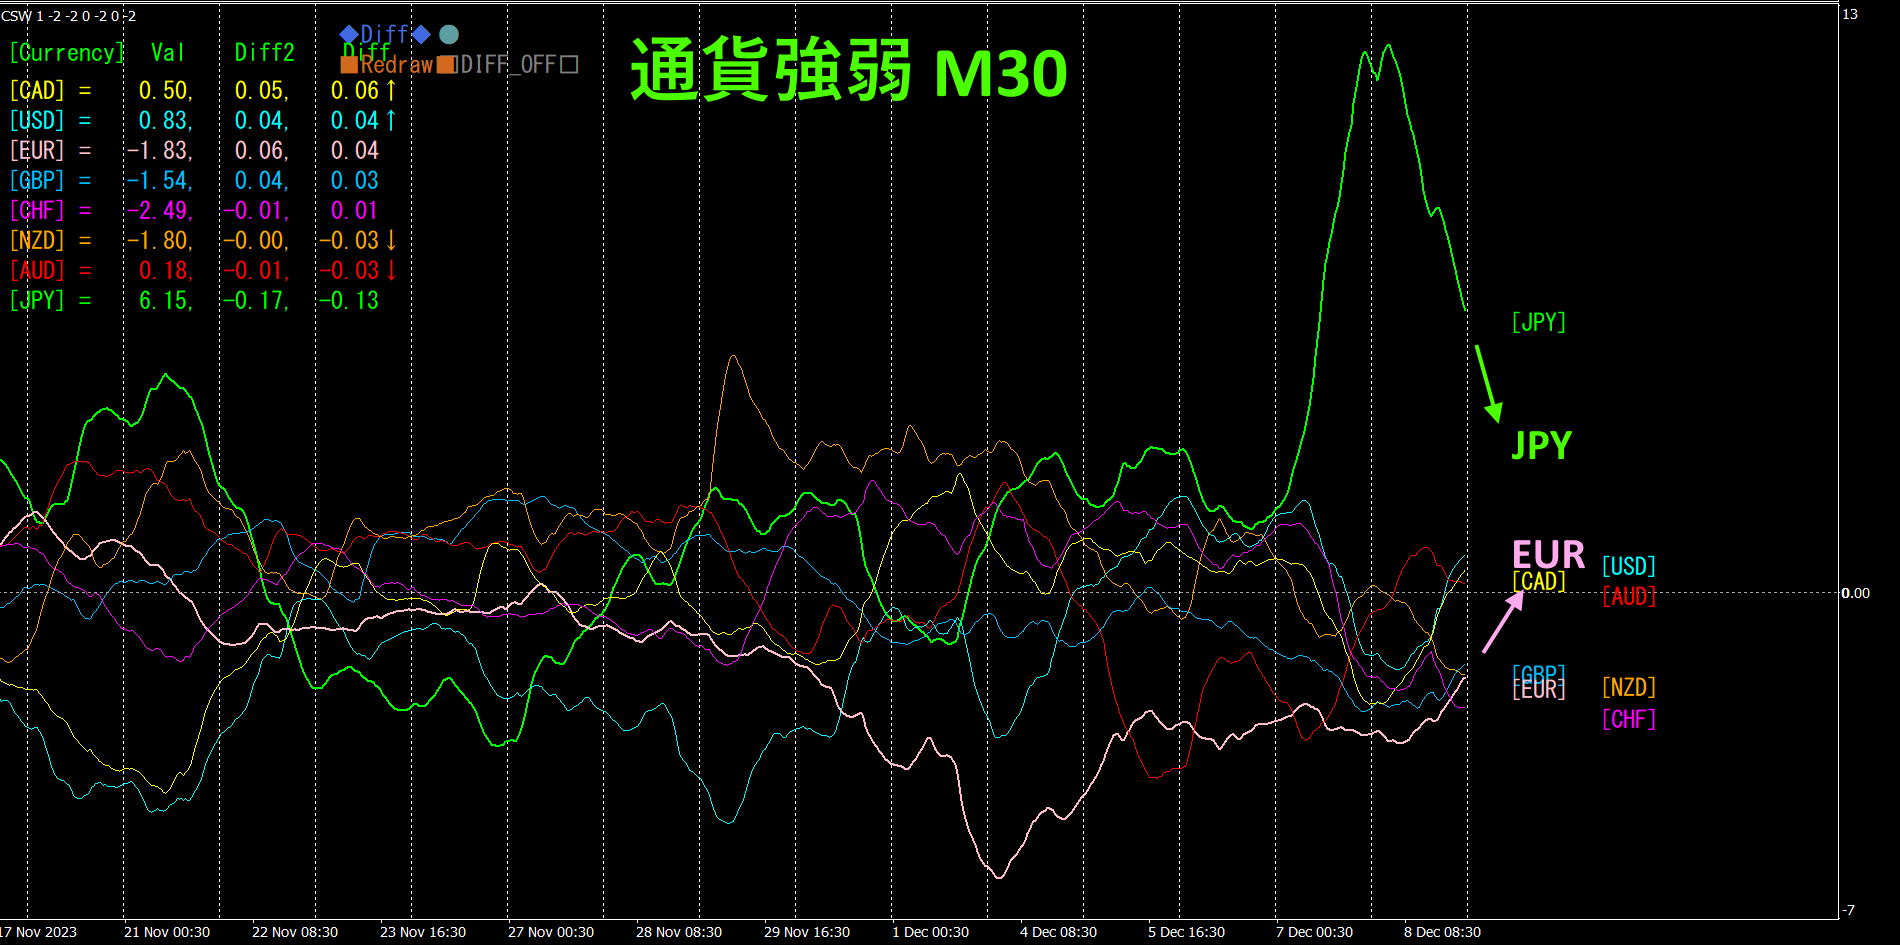
Pink indicatesEUR, green indicates shows a large upward deviation.JPY.JPYJPY andEUR are moving toward convergence, so EURJPY is expected to rise.
4. Search for all-pairs tops and bottoms to formulate a trend strategy (target isNZDCHF).
2505“Top-BottomSearchIndicator was used to select NZDCHF as the bottom-position currency pair. We aim for a rise from the bottom.
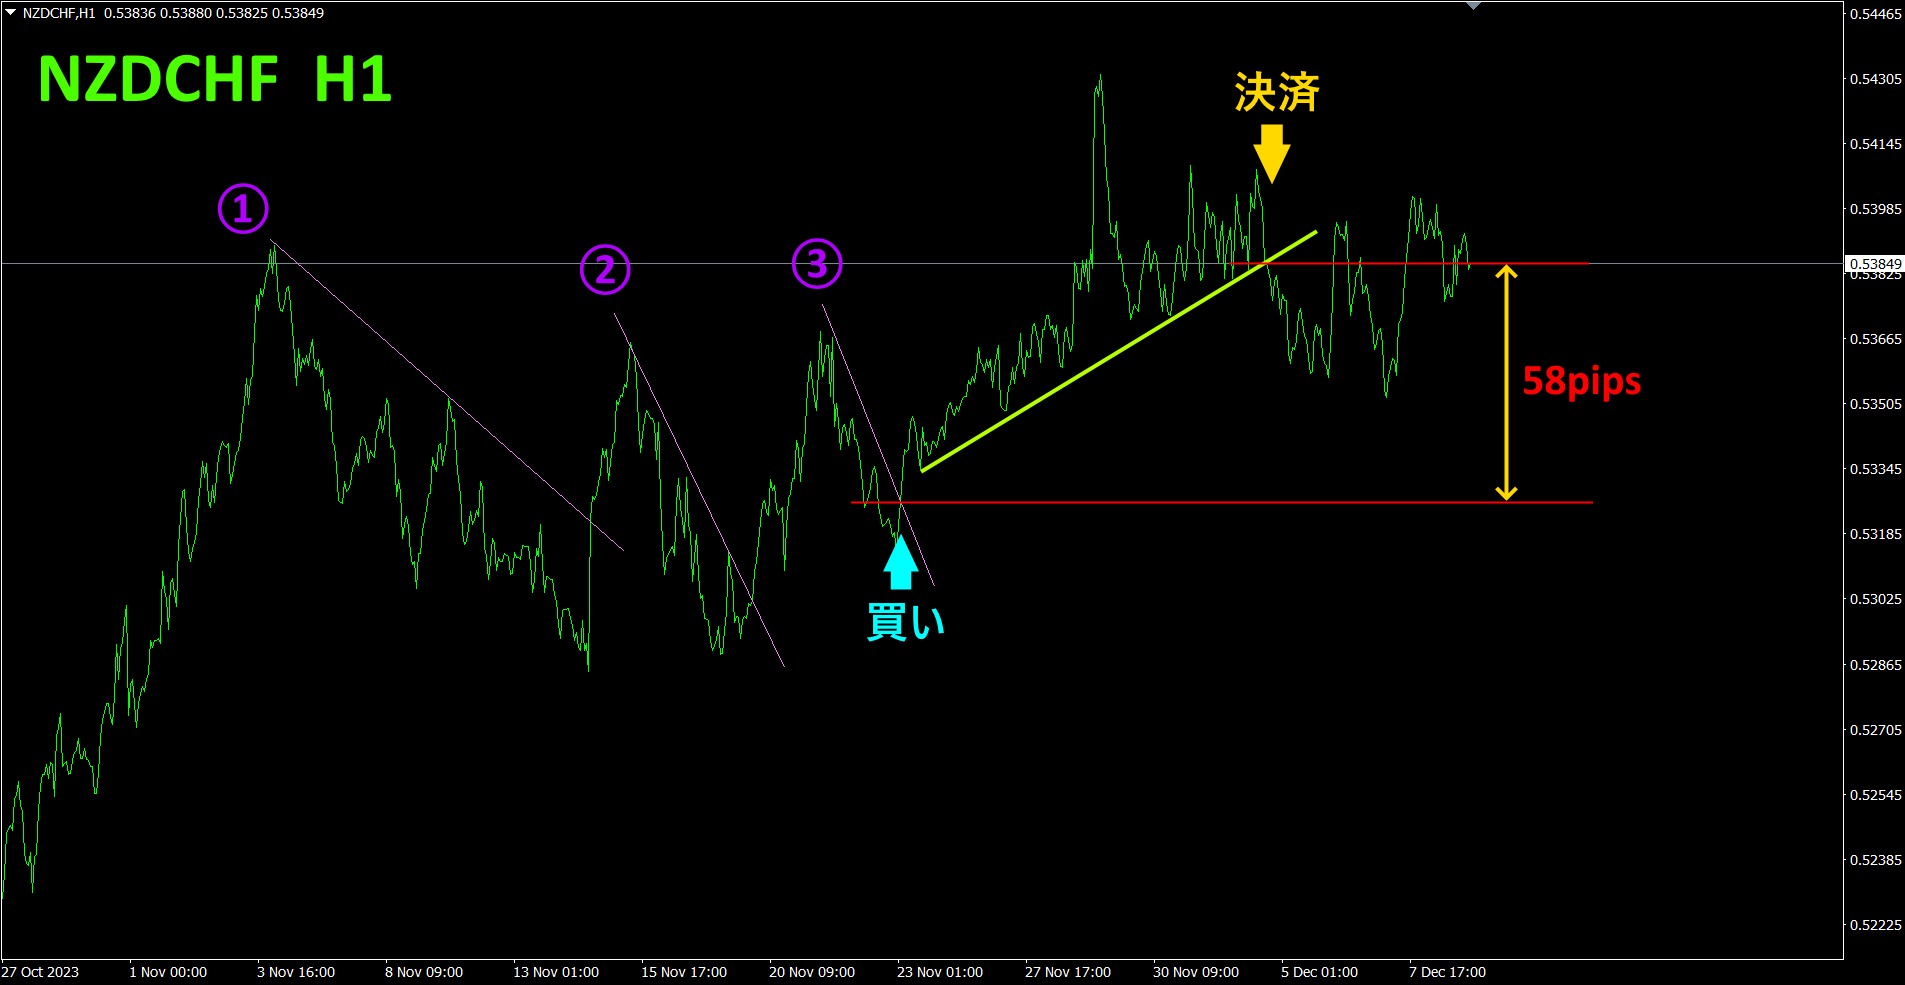
When you break above lines ①, ②, and ③, you buy, and if you break below the rising trend line, you exit; we have repeatedly done this. At ①, we gained40pips, at ②60pips, totaling100pips in profit. The position bought at ③ was exited when the rising trend line was breached. Realized profit is58pips.
Going forward, continue focusing only on buying opportunities and keep trading.
Refer to the four-hour currency strength chart.
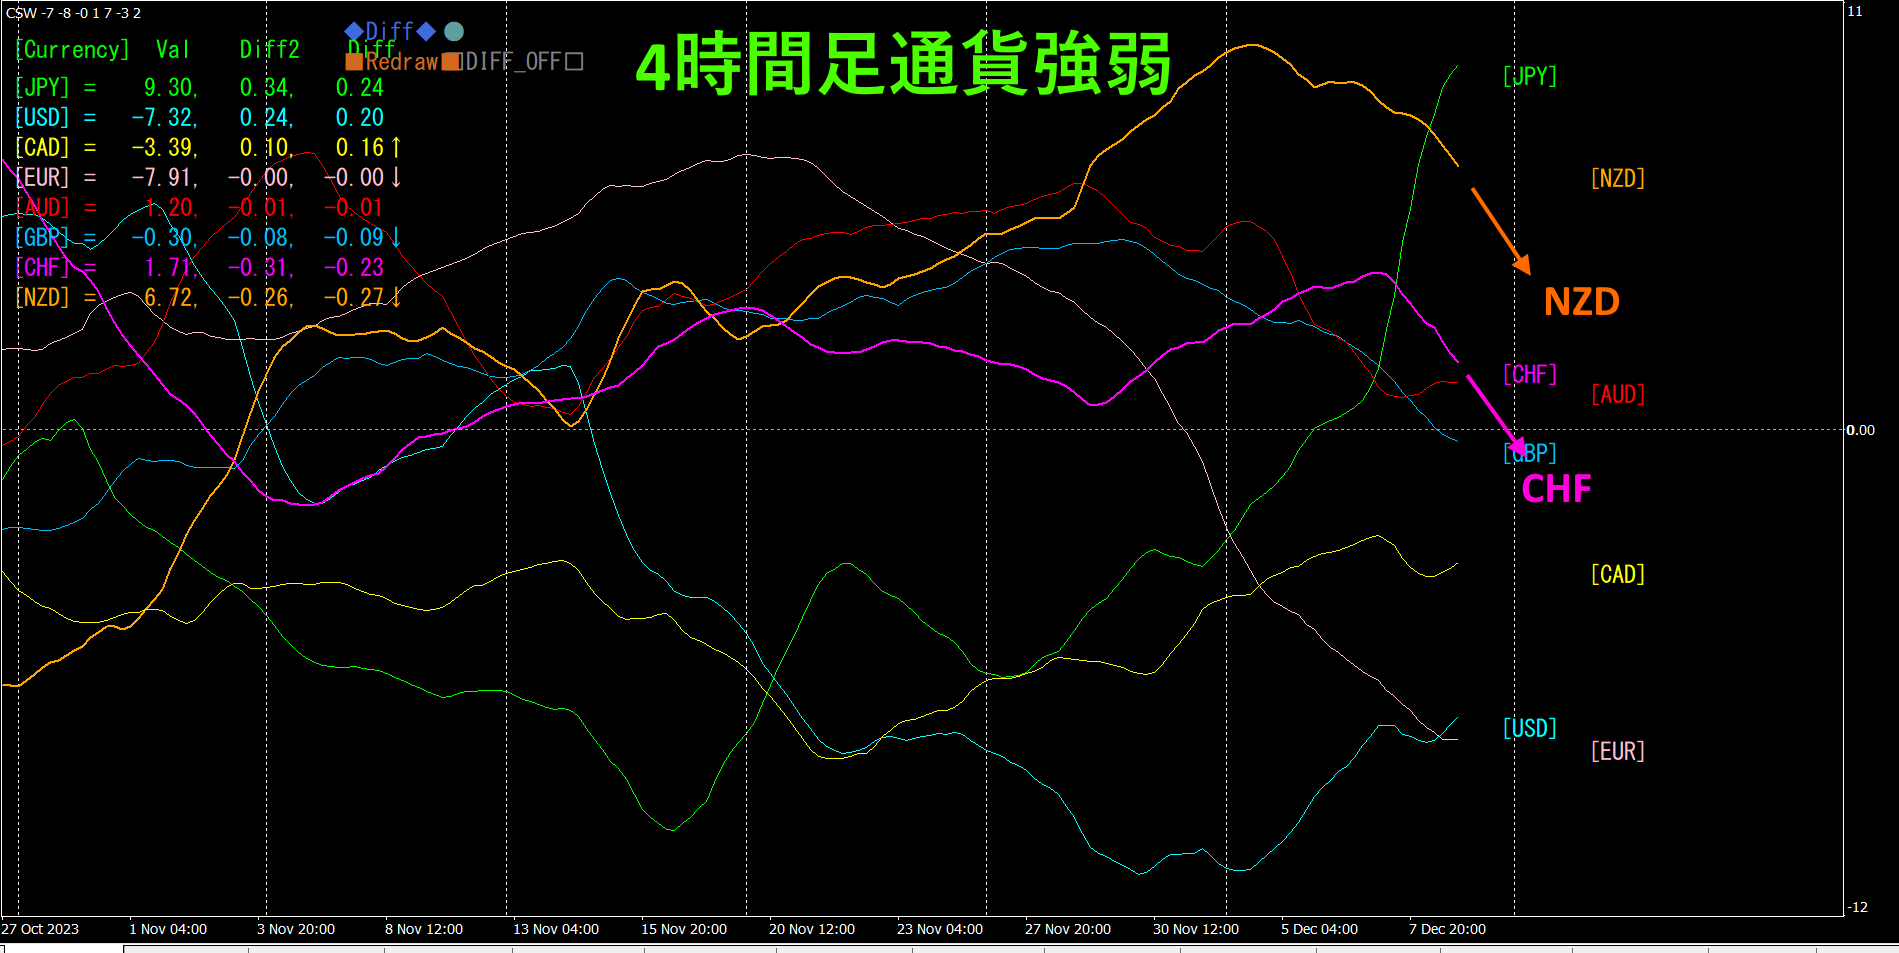
Red-purple indicatesCHF, orange indicatesNZD.NZD andCHF are both downward, butNZD shows a stronger downtrend thanCHFNZDCHF rises and declines, is expected to drift downward slightly. However, going forward, as is anticipated to rise.
Semi-automaticEA has the “” to draw an inclined downward line; when it breaks above this line, it automatically buys, and if it breaks above the rising line, it automatically closes the trade, enabling hands-off trading.
※“Trend Line EX”

https://www.gogojungle.co.jp/tools/indicators/42257
If you are interested in the “8C currency strength visualization indicator
MT4 version https://www.gogojungle.co.jp/tools/indicators/39150
version https://www.gogojungle.co.jp/tools/indicators/39159
【My listed products】


