

【December 7, 2023】Past validation using the indicators of Heaven and Earth (Gold)
This time, a perfect point appeared in gold, so I’d like to introduce it. In the first half of this week there weren’t many good 4-hour structure (environment recognition) candles, but in the latter half several good structures began to appear. Next week looks promising.

・This article primarily focuses on past verifications using「Heaven and Earth Indicator」.
・The content is based on using the most accurate among this tool「15-minute chart + 4-hour chart simultaneous monitoring method」.
・This tool is a groundbreaking trading tool that can be used without understanding any of the so-called FX theories(Elliott Wave, Dow Theory, Granger’s Law, cycle theory, price action, Fibonacci, support/resistance, channels, etc.).

Heaven and Earth Indicator is a trading method using my original indicator released in February 2022, developed by Abusan.
Thanks to everyone's support,「GogoJungle Award 2022」
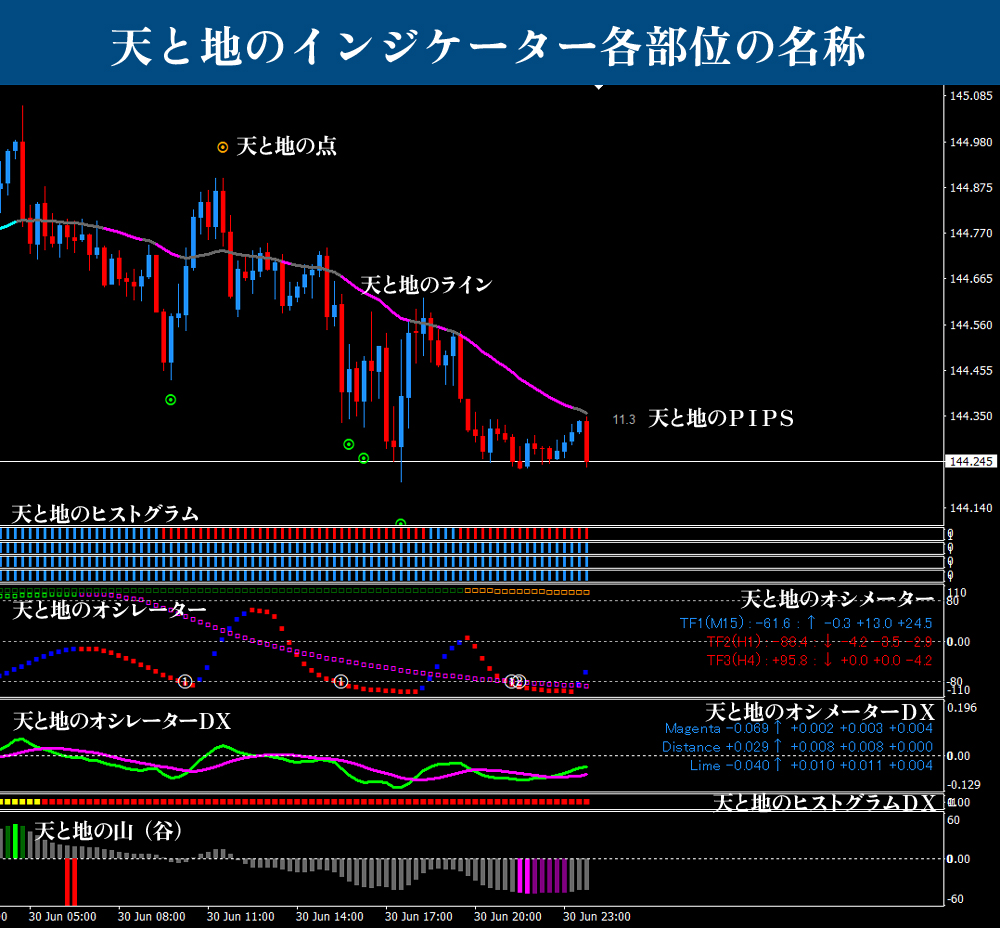
■ Heaven and Earth Indicator
https://www.gogojungle.co.jp/tools/indicators/35780
■ Heaven and Earth Mountain
https://www.gogojungle.co.jp/tools/indicators/37744
■ Heaven and Earth EA ~ Semi-Discretionary Auto Trading System ~
https://www.gogojungle.co.jp/tools/indicators/43213
■ Heaven and Earth Dashboard
https://www.gogojungle.co.jp/tools/indicators/46257
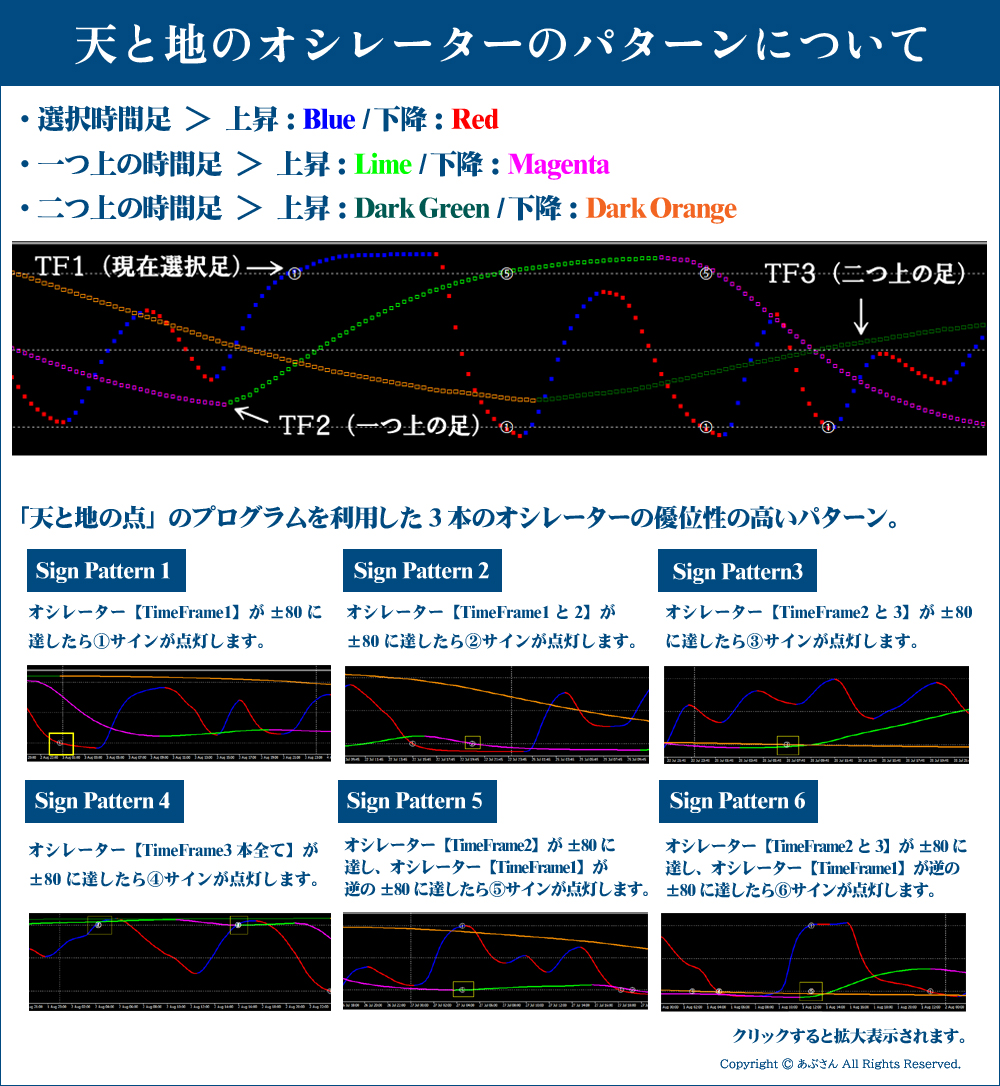
※ For the terminology used in this blog, please refer to the sections below “Names of the parts of Heaven and Earth Indicator” and “Oscillator patterns of Heaven and Earth.” If you have any other questions, please refer to the Heaven and Earth Indicator sales page for a general understanding. Existing users should have no issue by reading the manual.Please note, if you have any questions, you can refer to the Heaven and Earth Indicator sales page. If you are already a user, just reading the manual should suffice.
Now, I would like to move on to the verification.
Thank you in advance!
※ All images enlarge when clicked.

Gold15-minute chart + 4-hour chartPast verification(From December 6, 2023 to present)
※ Please see the yellow vertical line. The same location on the 15-minute chart also has a yellow vertical line. (UsingLINK LINE)
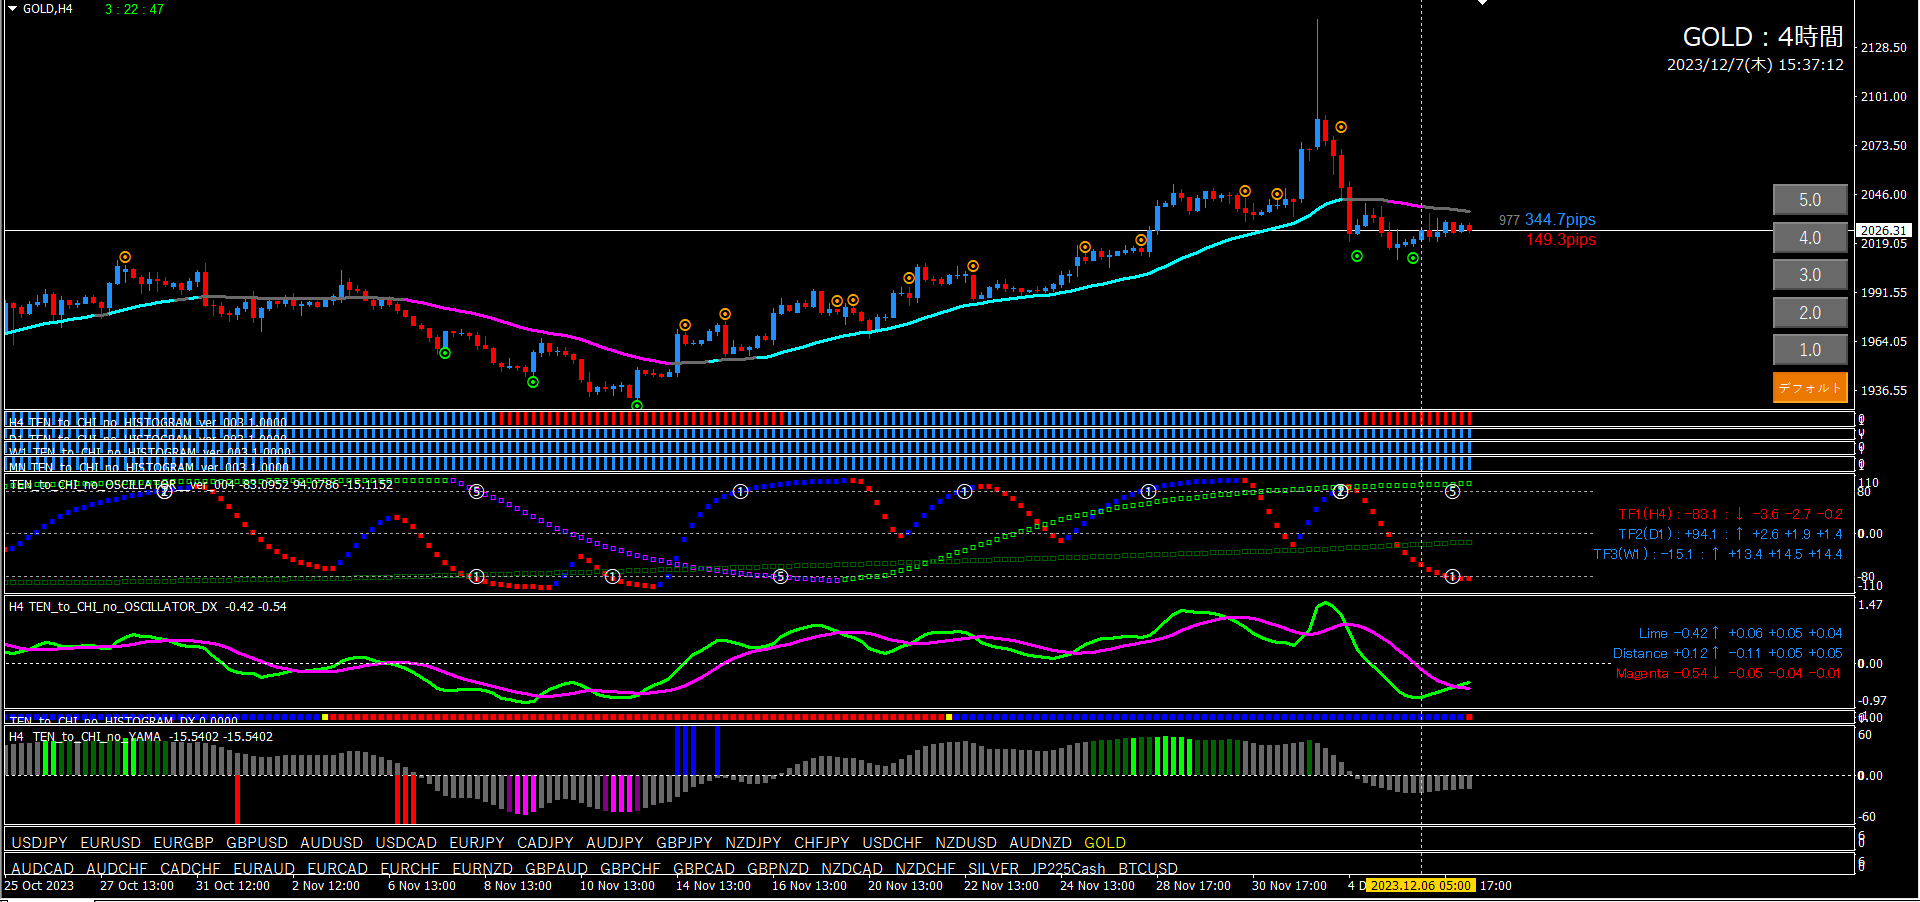
■ 4-hour chart (environment recognition)
The yellow vertical line indicates the location where the uptrend was determined.
Oscillator TF2 is rising, indicating a long entry point. This is the basic combination. There are two long entry signals, but the first is after a downward cross of Oscillator DX, so it cannot be used. The position of TF1 is also poor. The second long entry signal shows Oscillator DX starting to contract, and TF1 is almost at -80. It is at this point that an uptrend judgment can be made.
■ 15-minute chart (entry trigger)
The yellow vertical line is the location where the uptrend was judged on the 4-hour chart.
The yellow circle is the long entry point. The green circle is the point where profit was taken according to a short signal.
Three long-entry signals appeared just before, but the leftmost long-entry signal cannot be used because Oscillator DX crossed downward just after it. The second long-entry signal is acceptable to enter. The third long-entry signal shows Oscillator Signal 1 and Oscillator DX contracting. Of the three, this is the most optimal entry point.
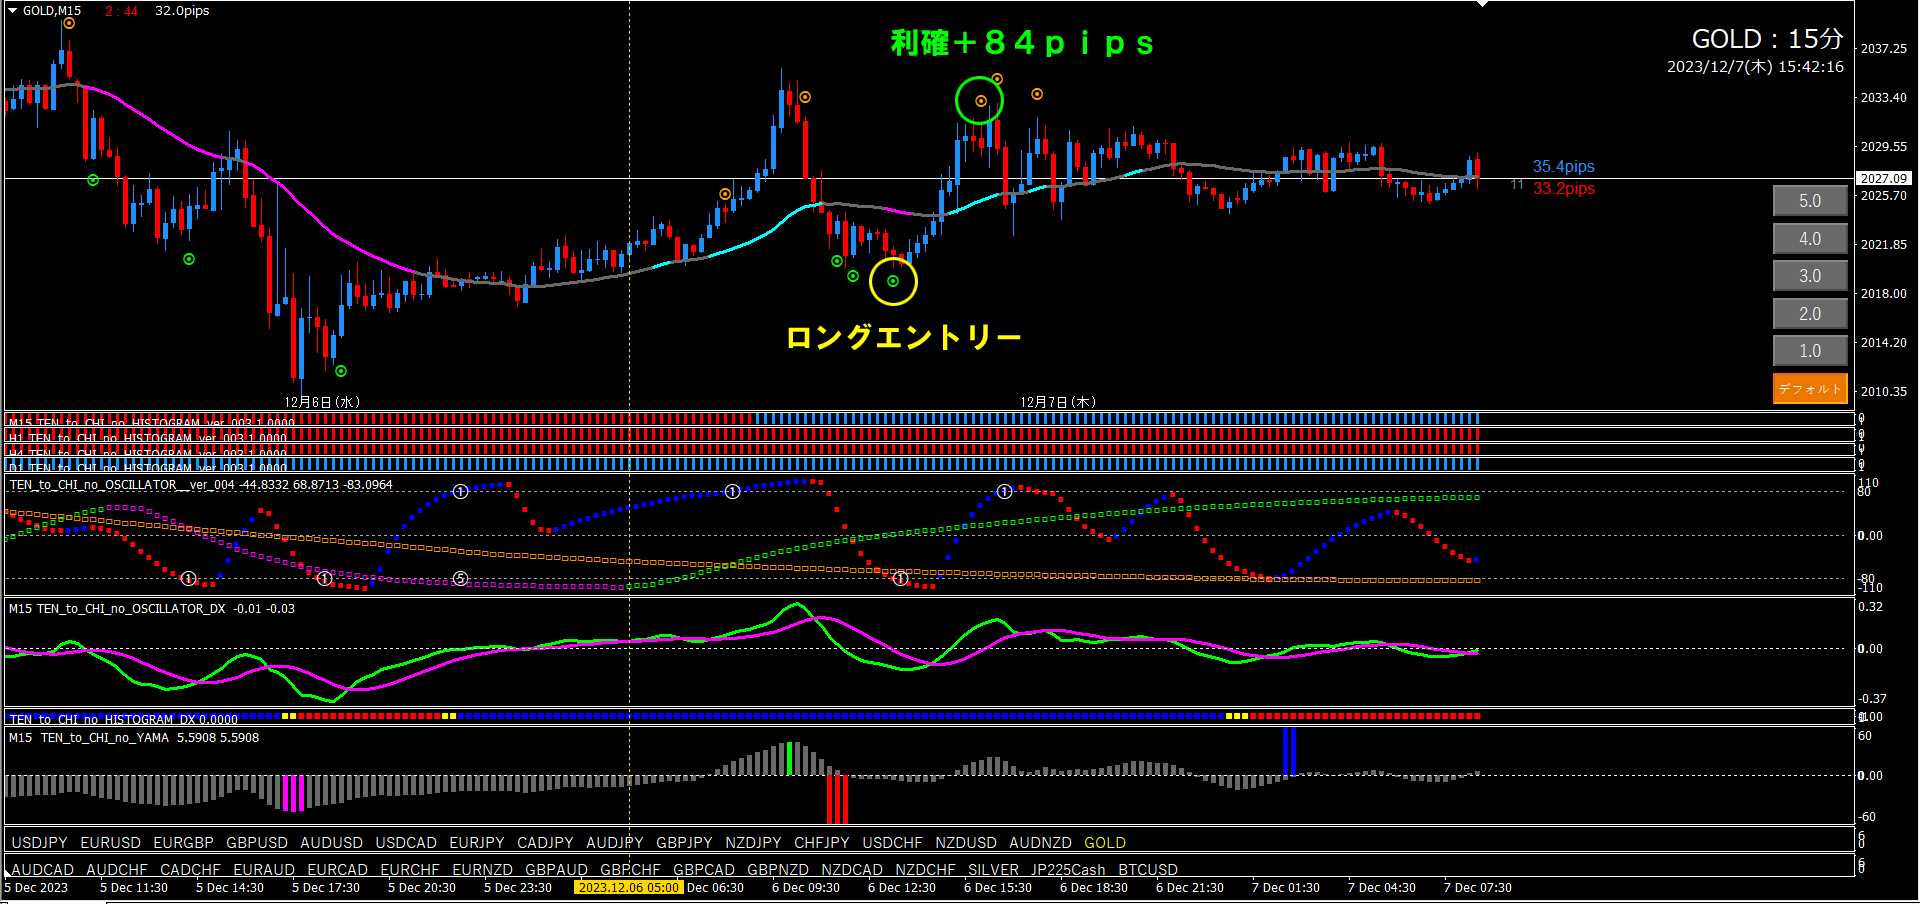
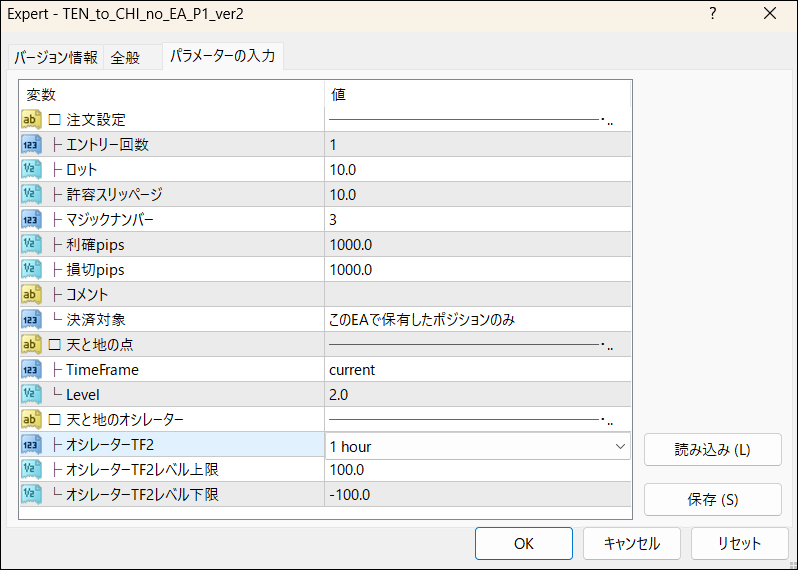
If the 4-hour chart indicates an uptrend (environment recognition), confirm TF2 rising and set EA Pattern ①. After EA is set, it will be completely discretionary-free, so it will auto-enter on the least advantageous of the three long-entry signals. Looking at the result, it is clear that discretionary judgment is strongest. This fine-grained discretionary part cannot be achieved with the EA. Even so, +62 pips are achieved, which is completely fine.

That is all.
I hope this is helpful to everyone in some small way.
