

[December 4, 2023] Historical verification using the Heaven and Earth indicators (GBP/CAD)
Yesterday's chart analysis article covered the follow-up validation for GBP/CAD where I was waiting for a long entry.
Since it was the only good formation in yesterday's analysis, it moved in a satisfying way as expected.
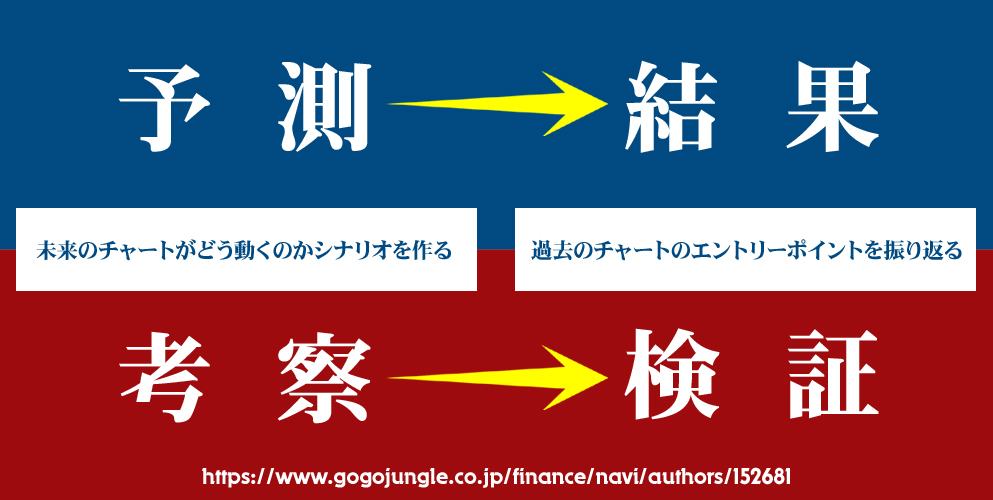
・This article primarily covers chart analysis and past verifications using the “Heaven and Earth Indicator” .
・The content is based on the use of the most accurate tool in this suite, the“15-minute + 4-hour simultaneous monitoring method”.
・This tool is a groundbreaking trading tool that can be used even if you do not understand any of the classic FX theories (Elliott Wave, Dow Theory, Grandilla’s Law, cycle theory, price action, Fibonacci, support/resistance, channels, etc.).

Heaven and Earth Indicator is a trading method that uses the original indicator I, A-B-S-U-A-N, developed in February 2022.
Thanks to everyone's support,“GogoJungle Award 2022 was awarded to us.
■ Heaven and Earth Indicator
https://www.gogojungle.co.jp/tools/indicators/35780
■ Heaven and Earth Mountain
https://www.gogojungle.co.jp/tools/indicators/37744
■ Heaven and Earth EA ~ Semi-discretionary Auto Trading System ~
https://www.gogojungle.co.jp/tools/indicators/43213
■ Heaven and Earth Dashboard
https://www.gogojungle.co.jp/tools/indicators/46257
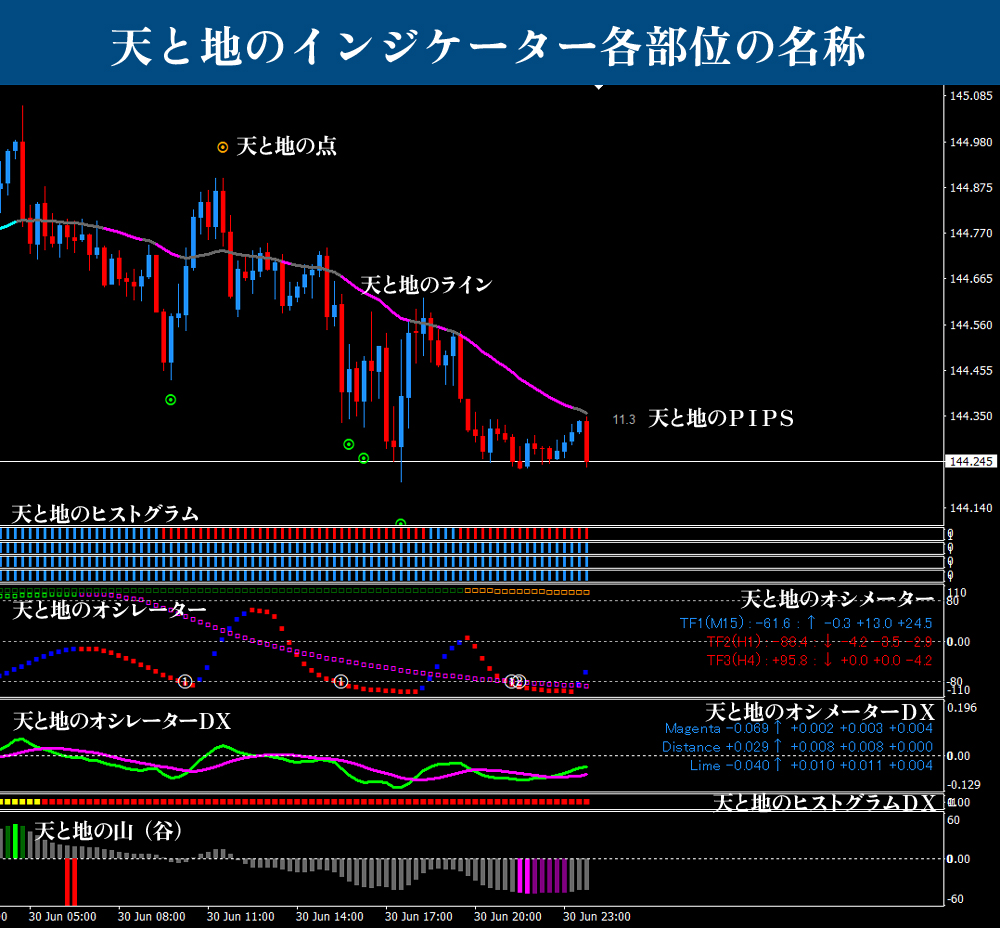
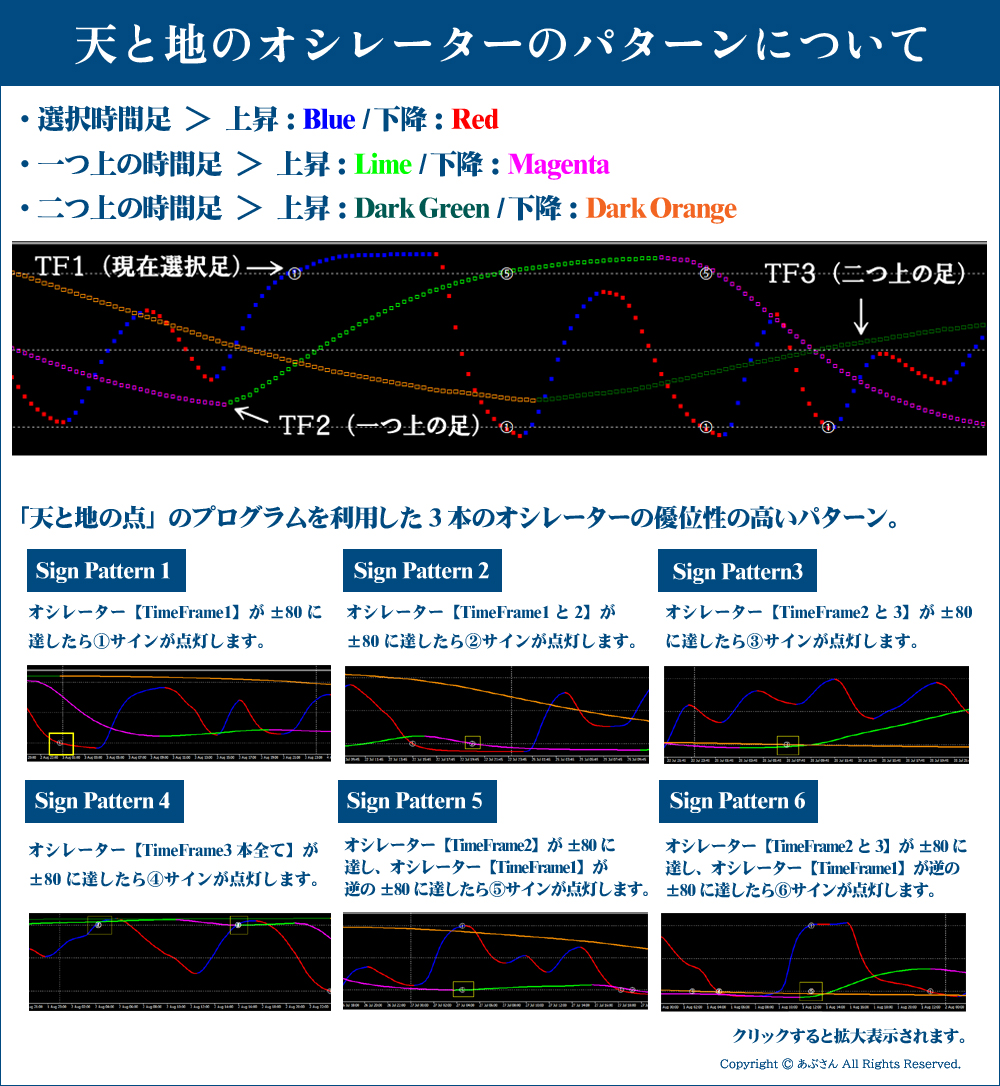
※ For terms used on this blog, please refer to the sections below: “Names of the parts of Heaven and Earth Indicator” and “Oscillator patterns of Heaven and Earth.” If you have any questions, you can usually understand by referring to the Heaven and Earth Indicator sales page. For existing users, just reading the manual is enough, right?
Now, I will move on to the verification.
Thank you in advance!
※ All images enlarge when clicked.

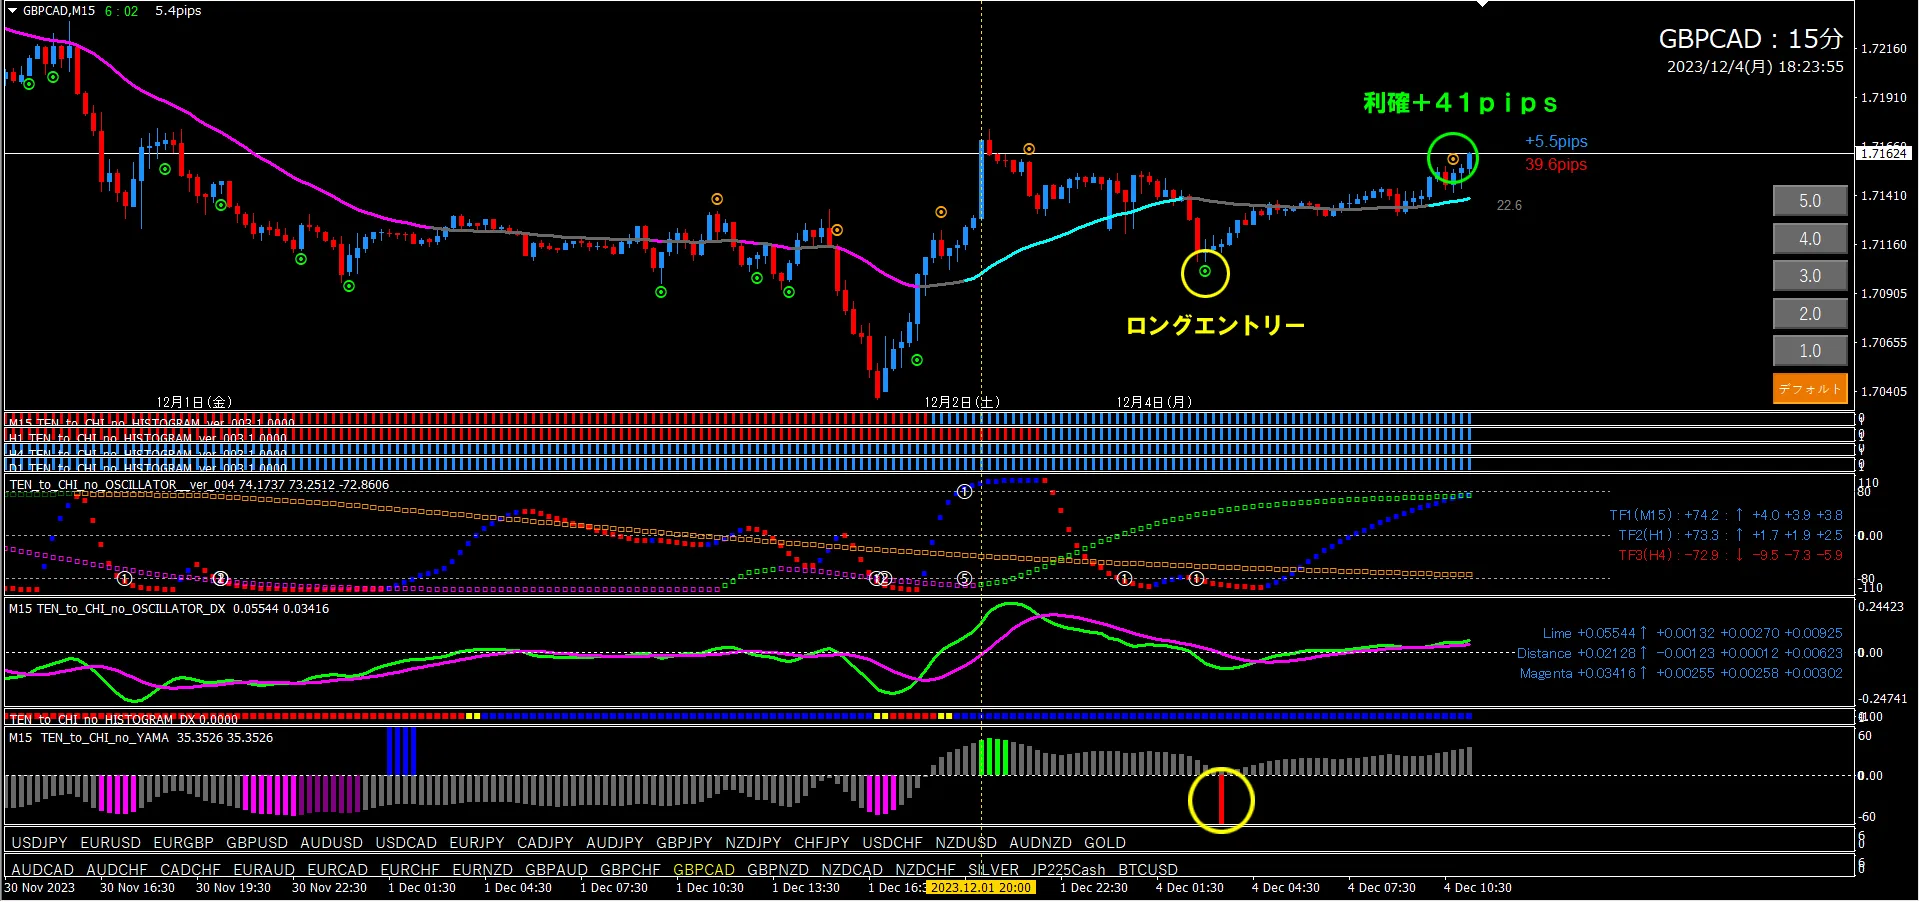
GBP/CAD15-minute + 4-hour past verification (from December 1, 2023 to present)
※ Please note the yellow vertical line. The 15-minute chart also has a yellow vertical line at the same place. (Using the LINK LINE)
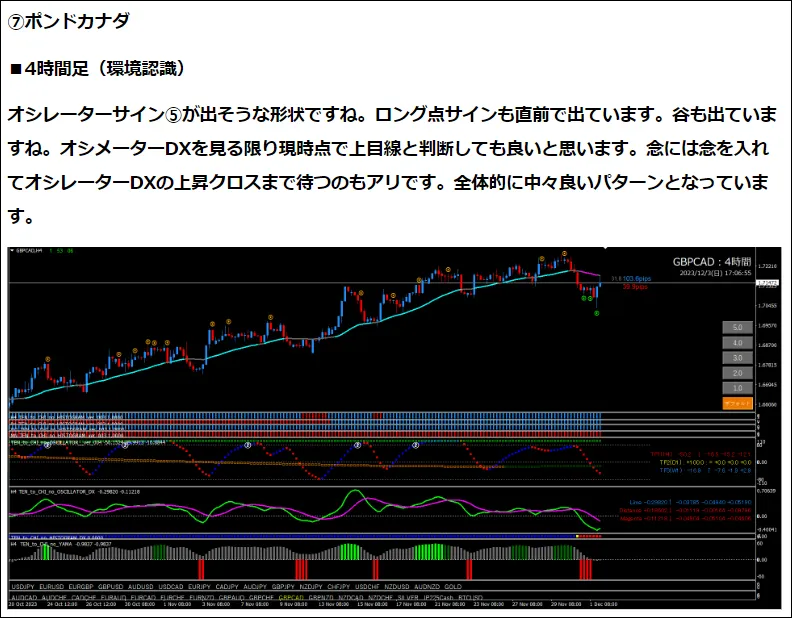
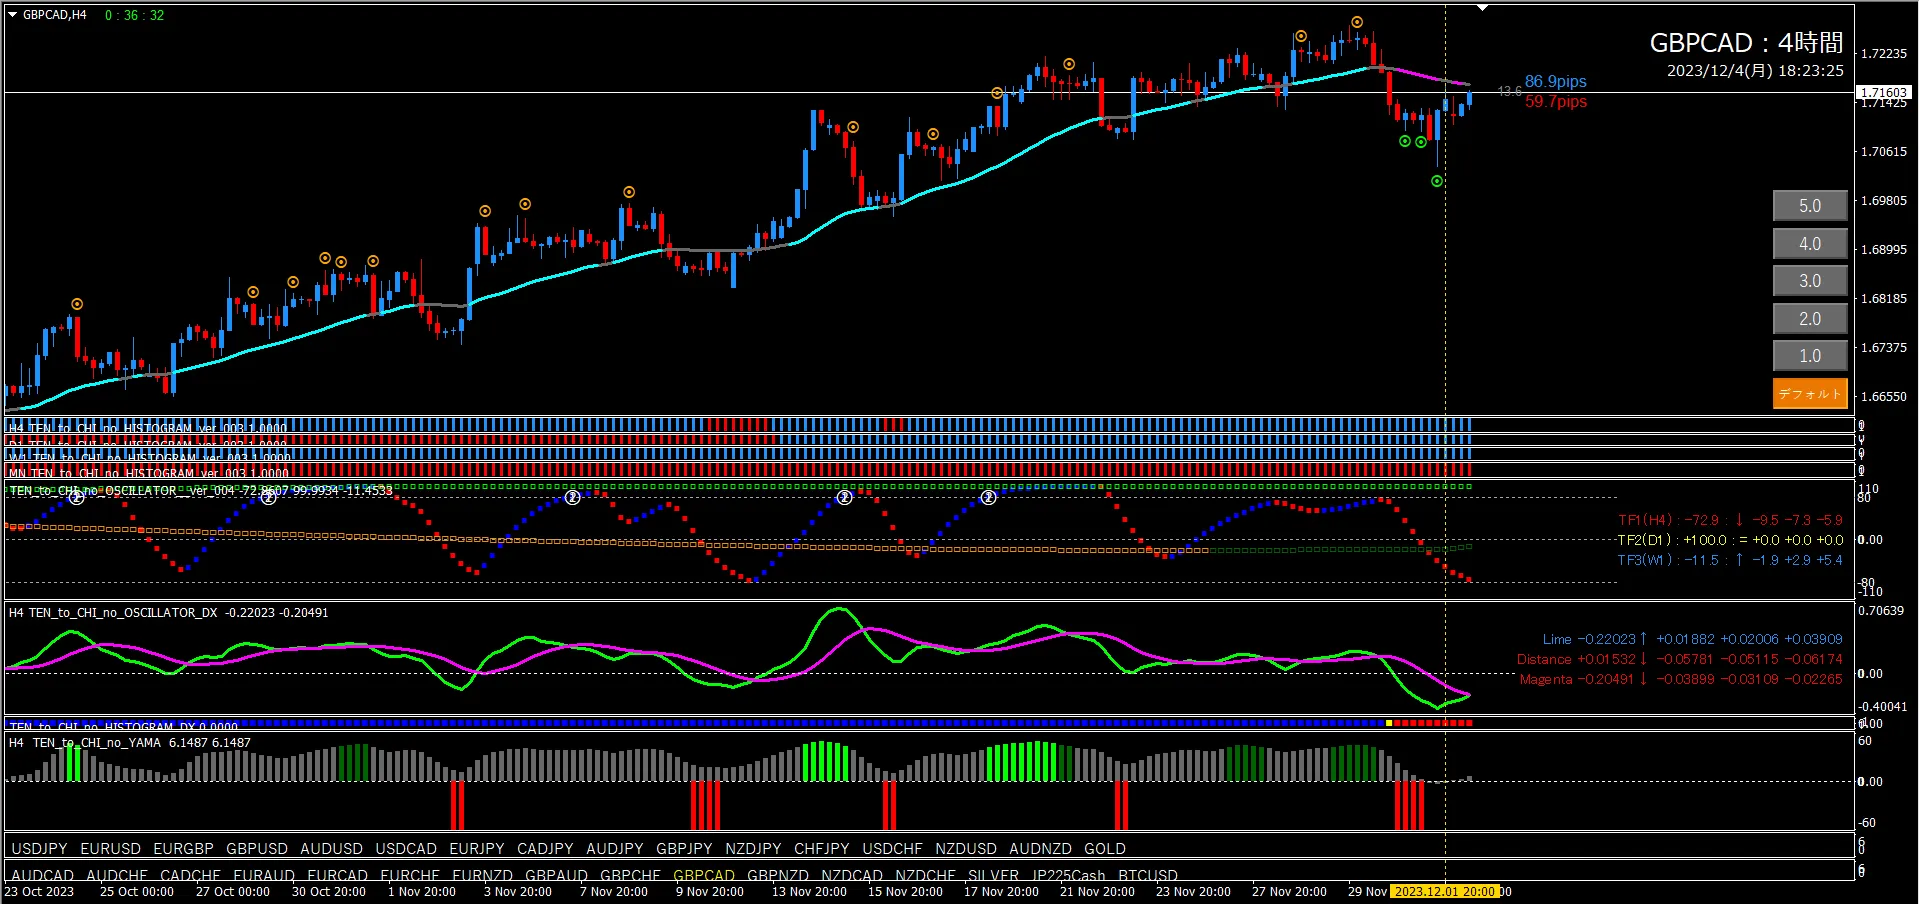
■ 4-hour chart (Context/Environment)
The top of the image shows the content of the previous article. The bottom shows the current chart.
The yellow vertical line on the current chart marks the location where we judged an uptrend in the previous article. (That is where I wrote the previous article.)
Since I judged it as uptrend at the time of writing the article, the scenario was simply to look for a long trigger on the 15-minute chart.

■ 15-minute chart (Entry trigger)
The yellow vertical line indicates the location where I judged an uptrend on the 4-hour chart.
Yellow circle is the long entry point. Green circle is the take profit point.
Oscillator TF2 rises nicely, the histogram and histogram DX are all blue. TF1 is in a good position as well. In this situation, do not miss the long-entry signal—set up notifications to secure the entry. Heaven and Earth Dashboard lets you turn on the point signals and TF2 (OscillatorChange) to alert you by shape and email. It's a very convenient feature.

That's all.
I hope this was at least a little helpful to everyone.
