

[December 3, 2023] Chart analysis using sky and ground indicators
This chart analysis covers a total of 8 currency pairs (EURUSD, AUDJPY, GBPJPY, CHFJPY, AUDCHF, GBPCHF, GBP CAD, and Nikkei 225). Due to indicators like the ISM data from the day before yesterday and Powell’s remarks, the overall chart patterns were not very favorable. It’s expected to form a better pattern around Wednesday again. This time I’ve selected potential analyses somewhat aggressively.
Table of Contents

・This article uses「Heaven and Earth Indicators」 for chart analysis and backtesting.
・The content is based on the use of the most precise tool,「15-Minute + 4-Hour Simultaneous Monitoring Method」.
・This tool is a revolutionary trading tool that can be used without understanding (Elliott Wave, Dow Theory, Reminiscence of Granville’s Rule, Cycle Theory, Price Action, Fibonacci, S/R, Channels, etc.).

Heaven and Earth Indicators is a trading method using an original indicator developed by me, Abusan, released in February 2022.
Thanks to everyone's support,「GogoJungle Award 2022」
■ Heaven and Earth Indicator
https://www.gogojungle.co.jp/tools/indicators/35780
■ Heaven and Earth Mountain
https://www.gogojungle.co.jp/tools/indicators/37744
■ Heaven and Earth EA ~ Semi-Discretionary Auto Trading System ~
https://www.gogojungle.co.jp/tools/indicators/43213
■ Heaven and Earth Dashboard
https://www.gogojungle.co.jp/tools/indicators/46257
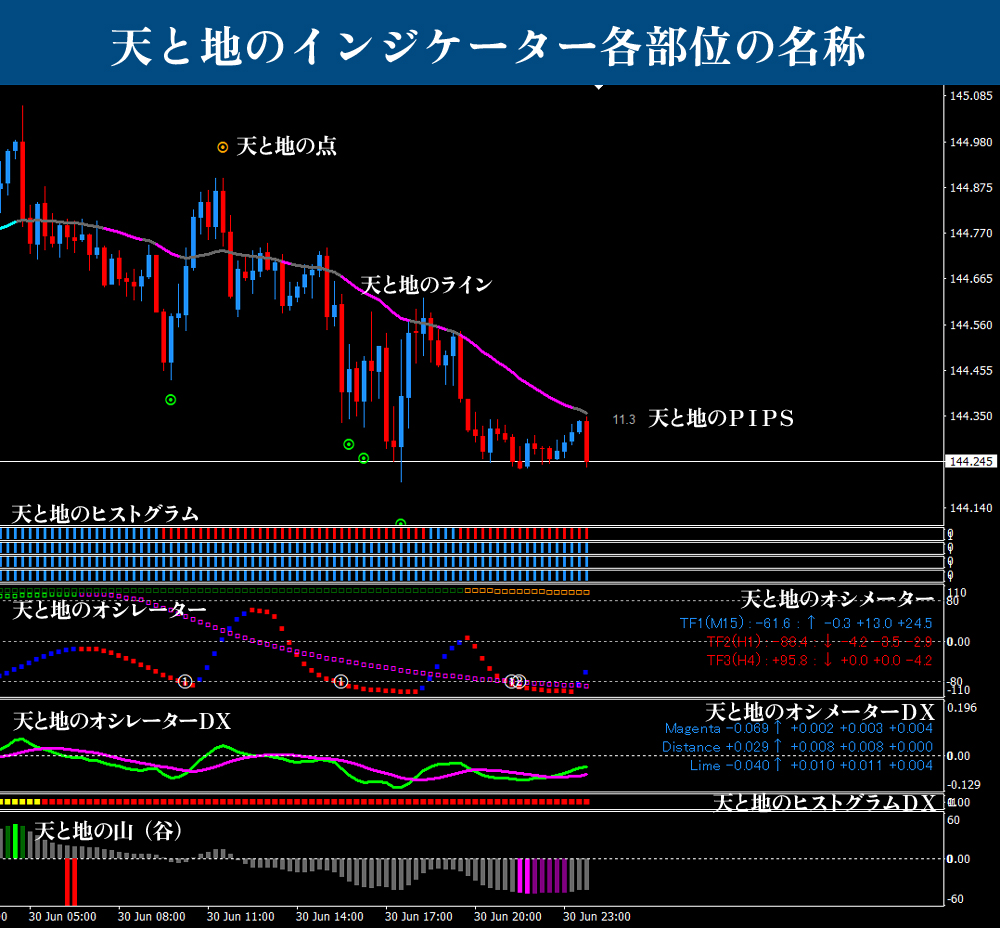
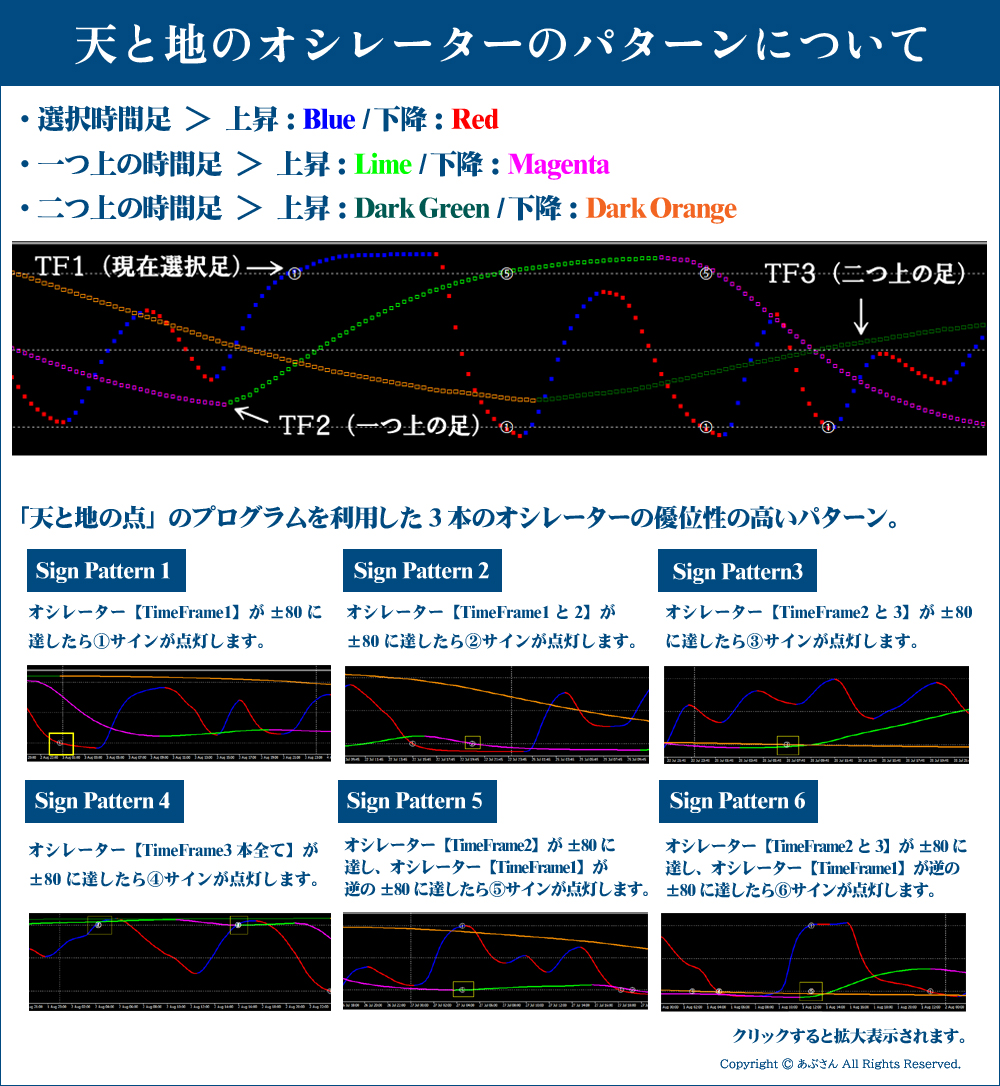
※ For terminology used in this blog, please refer to below “Names of parts of Heaven and Earth Indicators” and “Patterns of Heaven and Earth Oscillators.” If you have any questions, you can usually understand by referring to the Heaven and Earth Indicator sales page. For existing users, reading the manual should suffice.
Now, let’s move on to the analysis.
Thank you in advance!
※ All images enlarge when clicked.

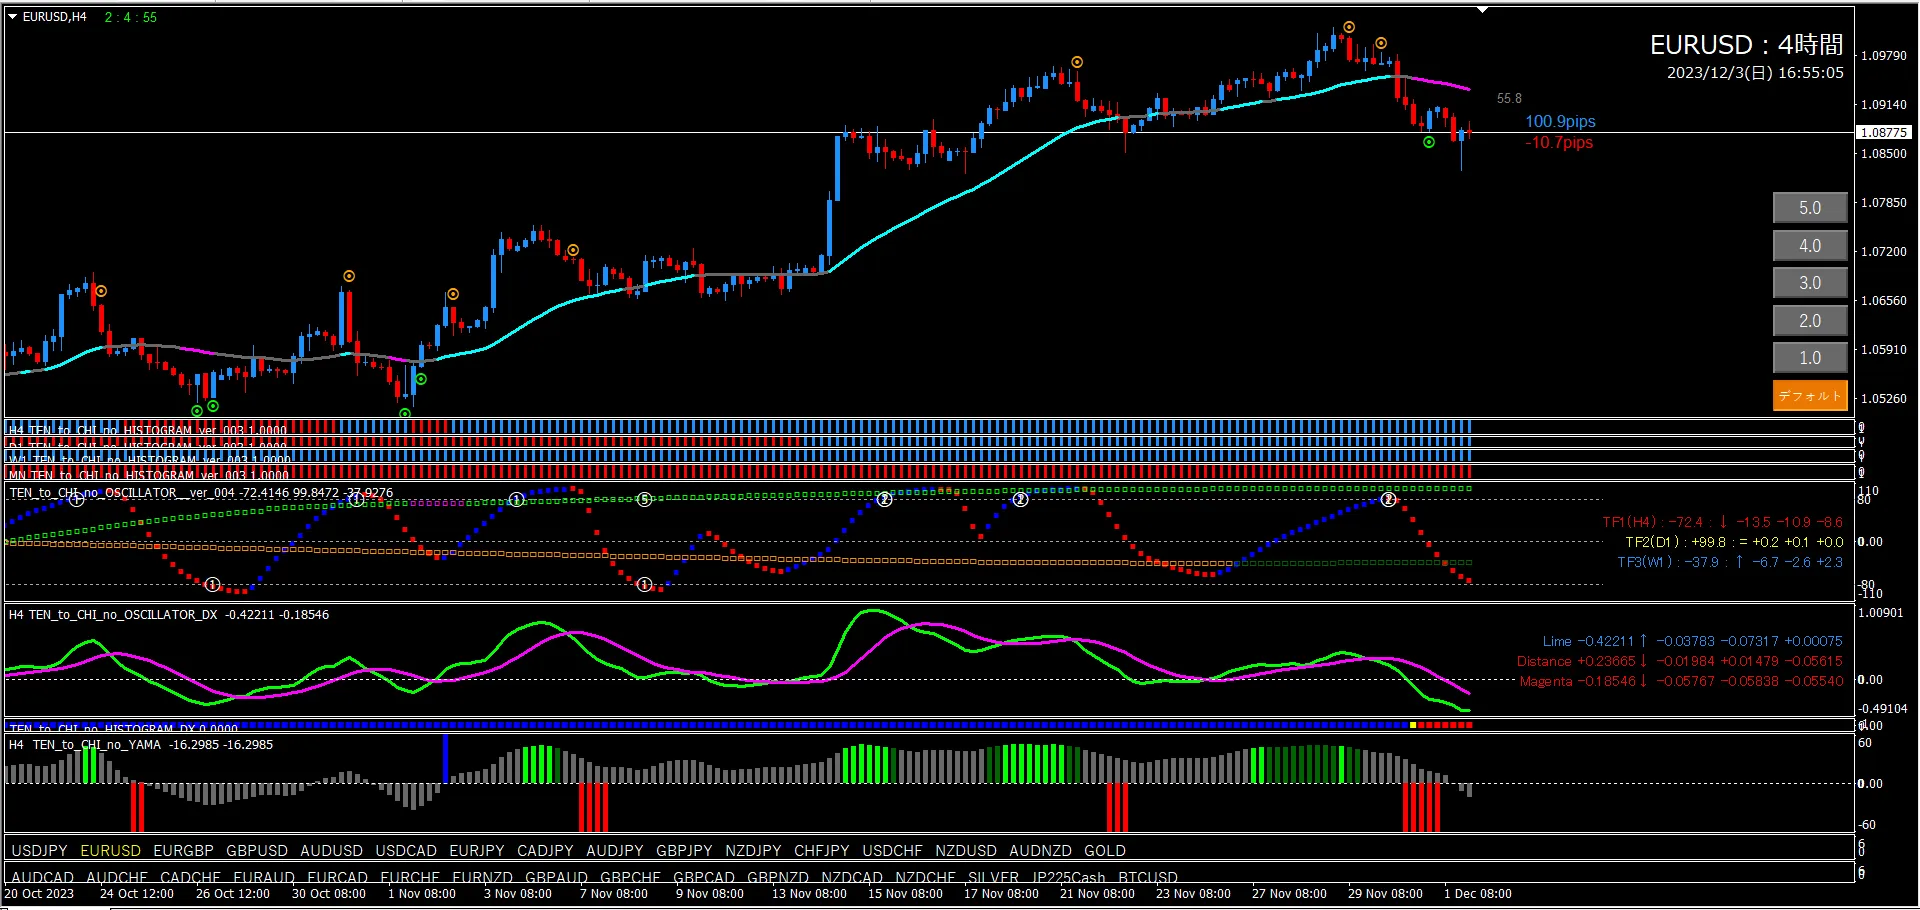
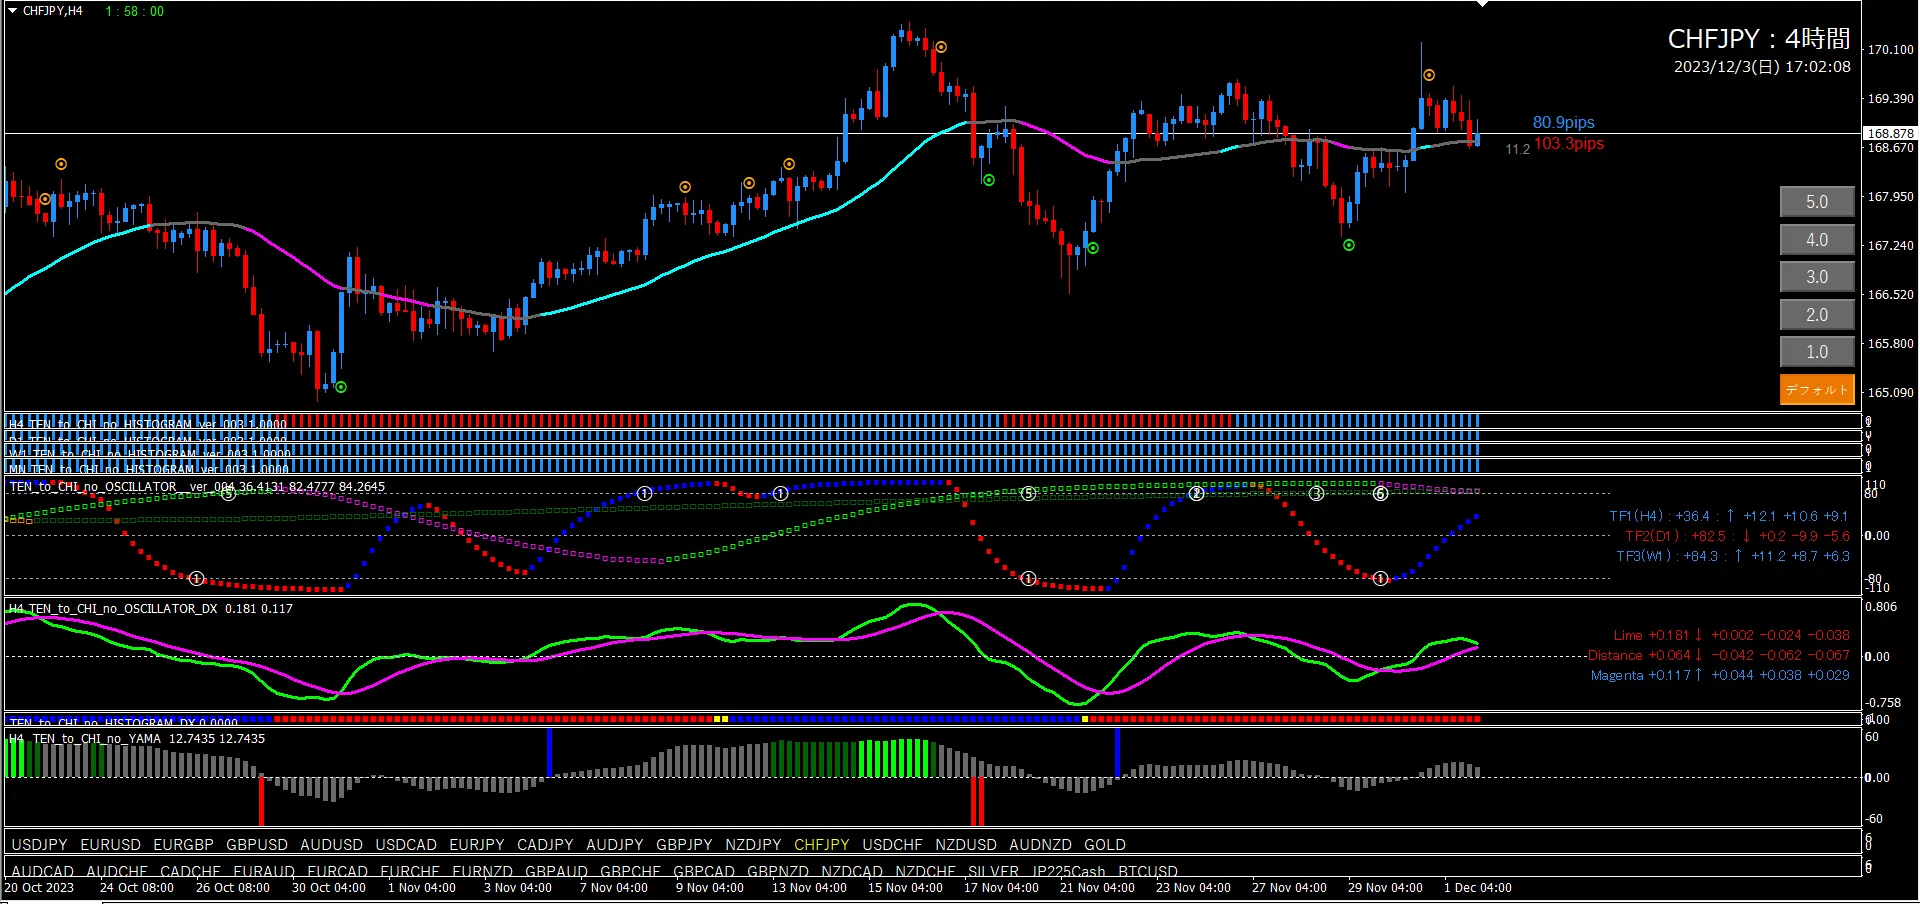
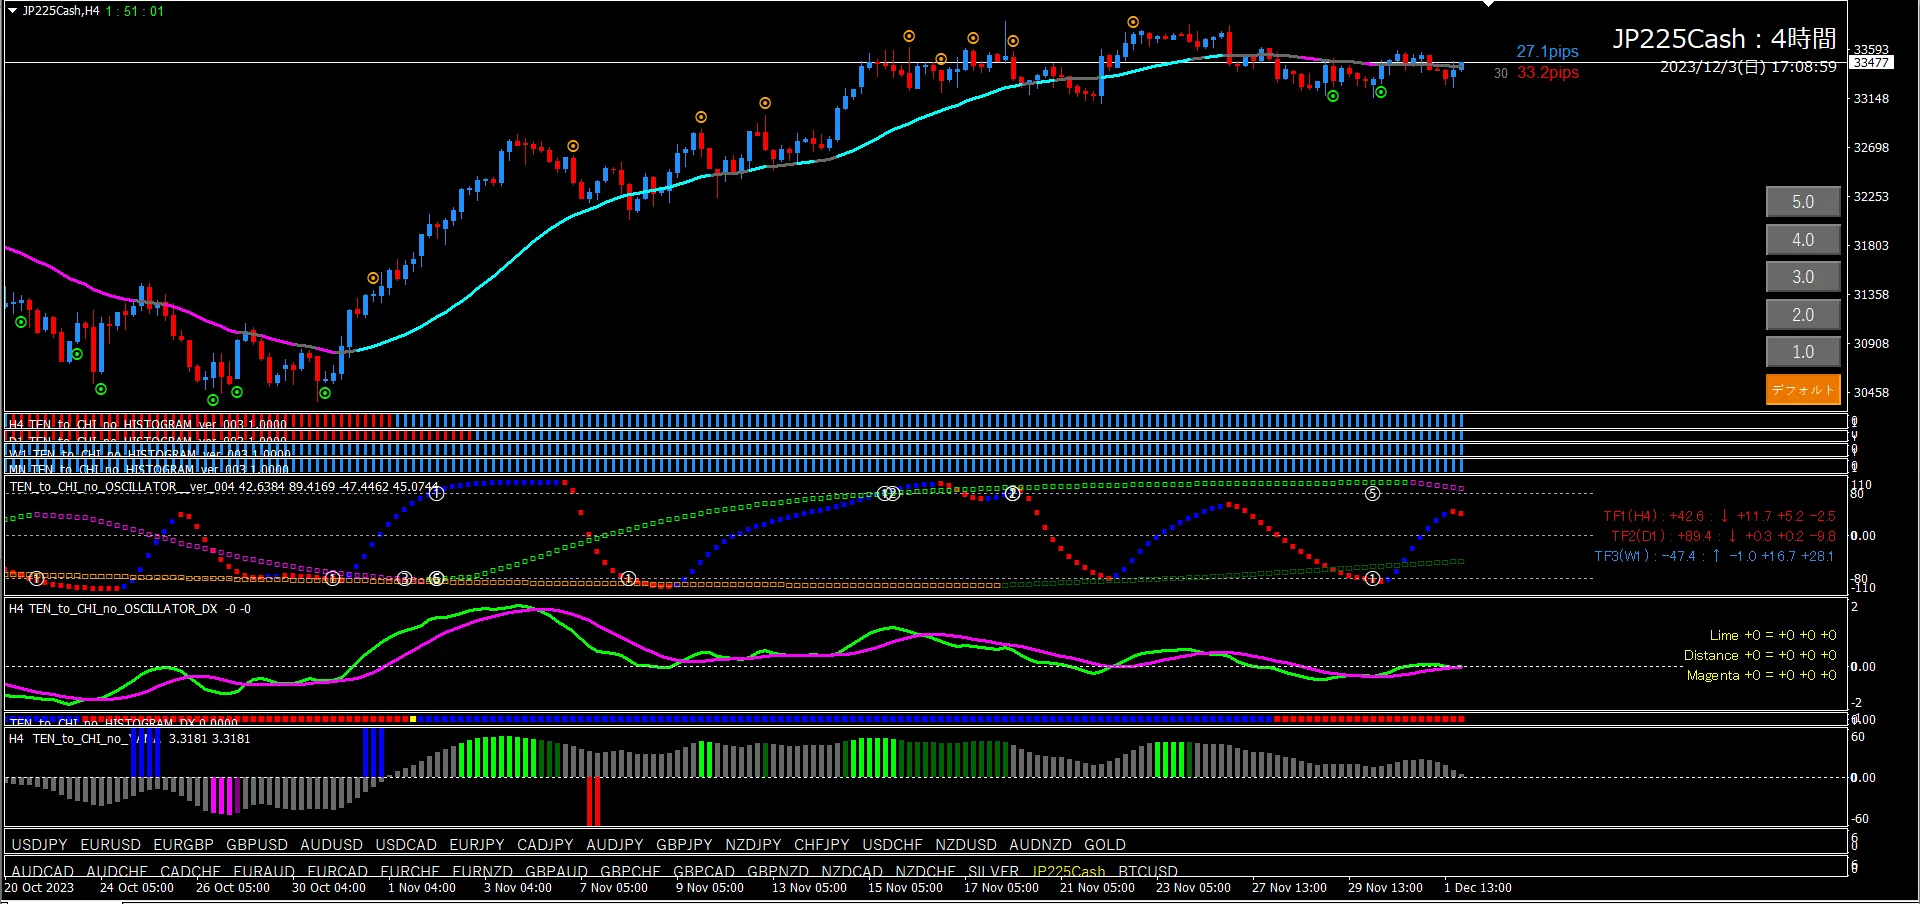
■ 4-Hour Time Frame (Context)
First, look at the oscillator TF2, which is sticking to the top. TF1 has just reached -80, and this is a basic pullback buying pattern. A valley is also present. The long-entry signal is about 10.7 pips higher, after which I will have an up-bias. Consider the contraction of Oscillator DX as well.
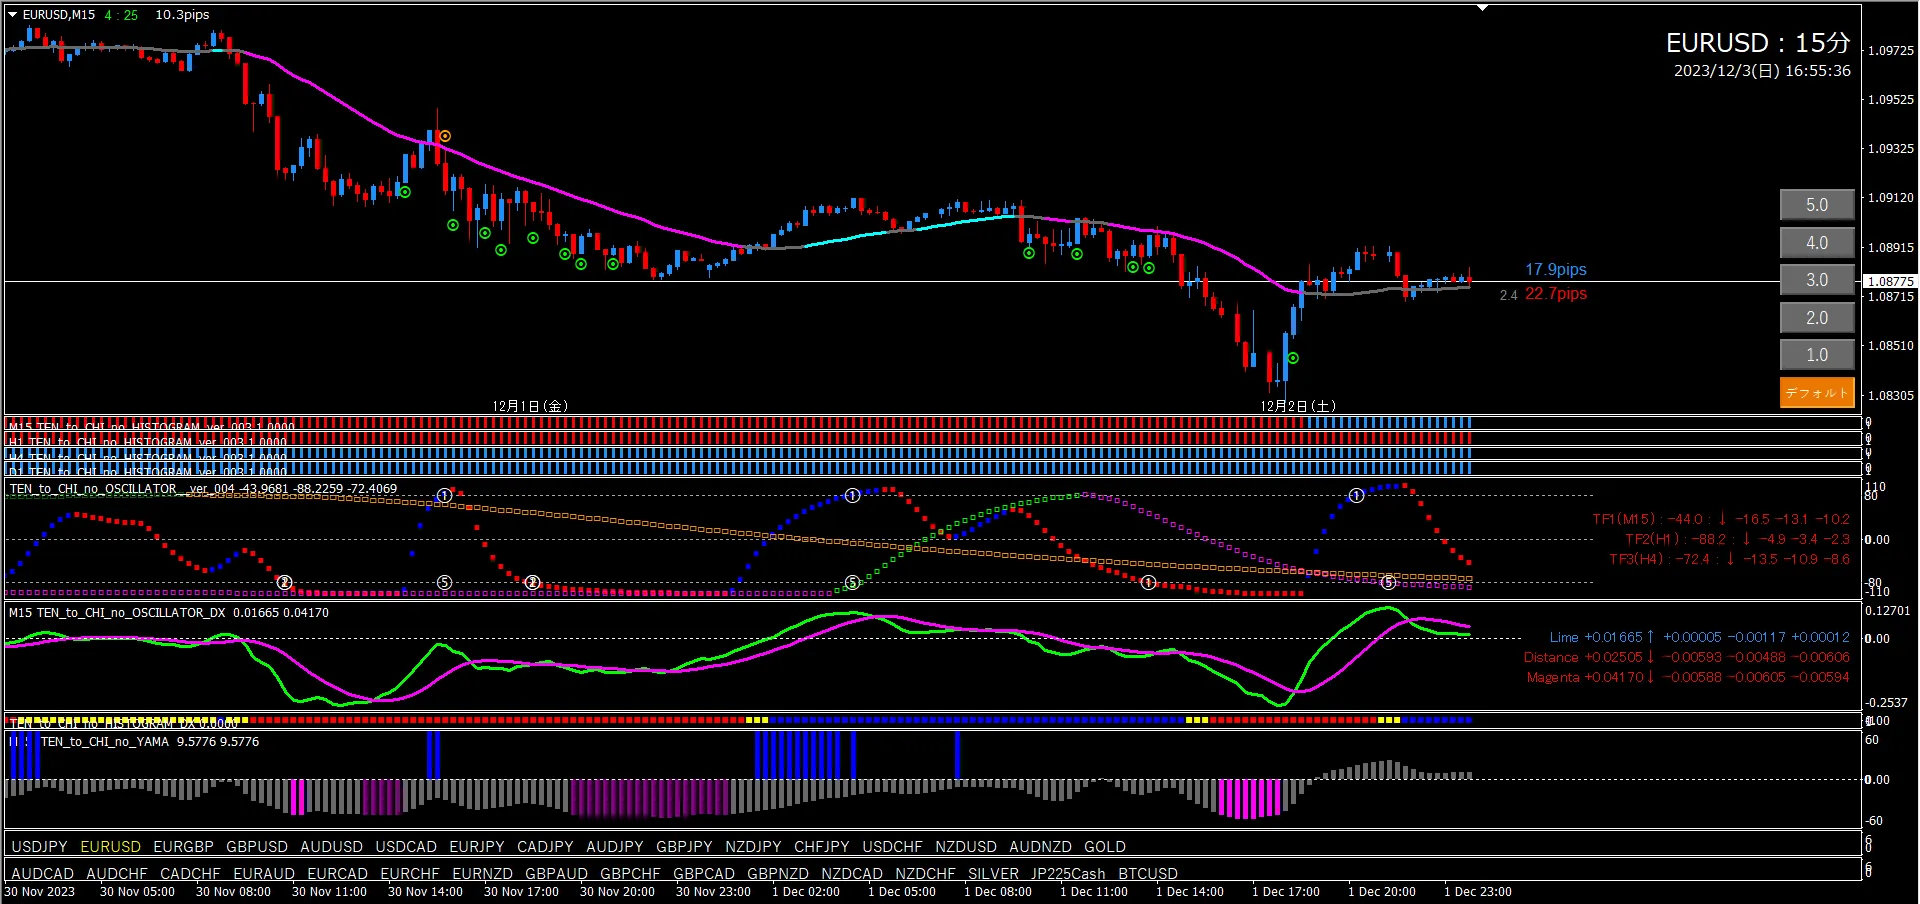
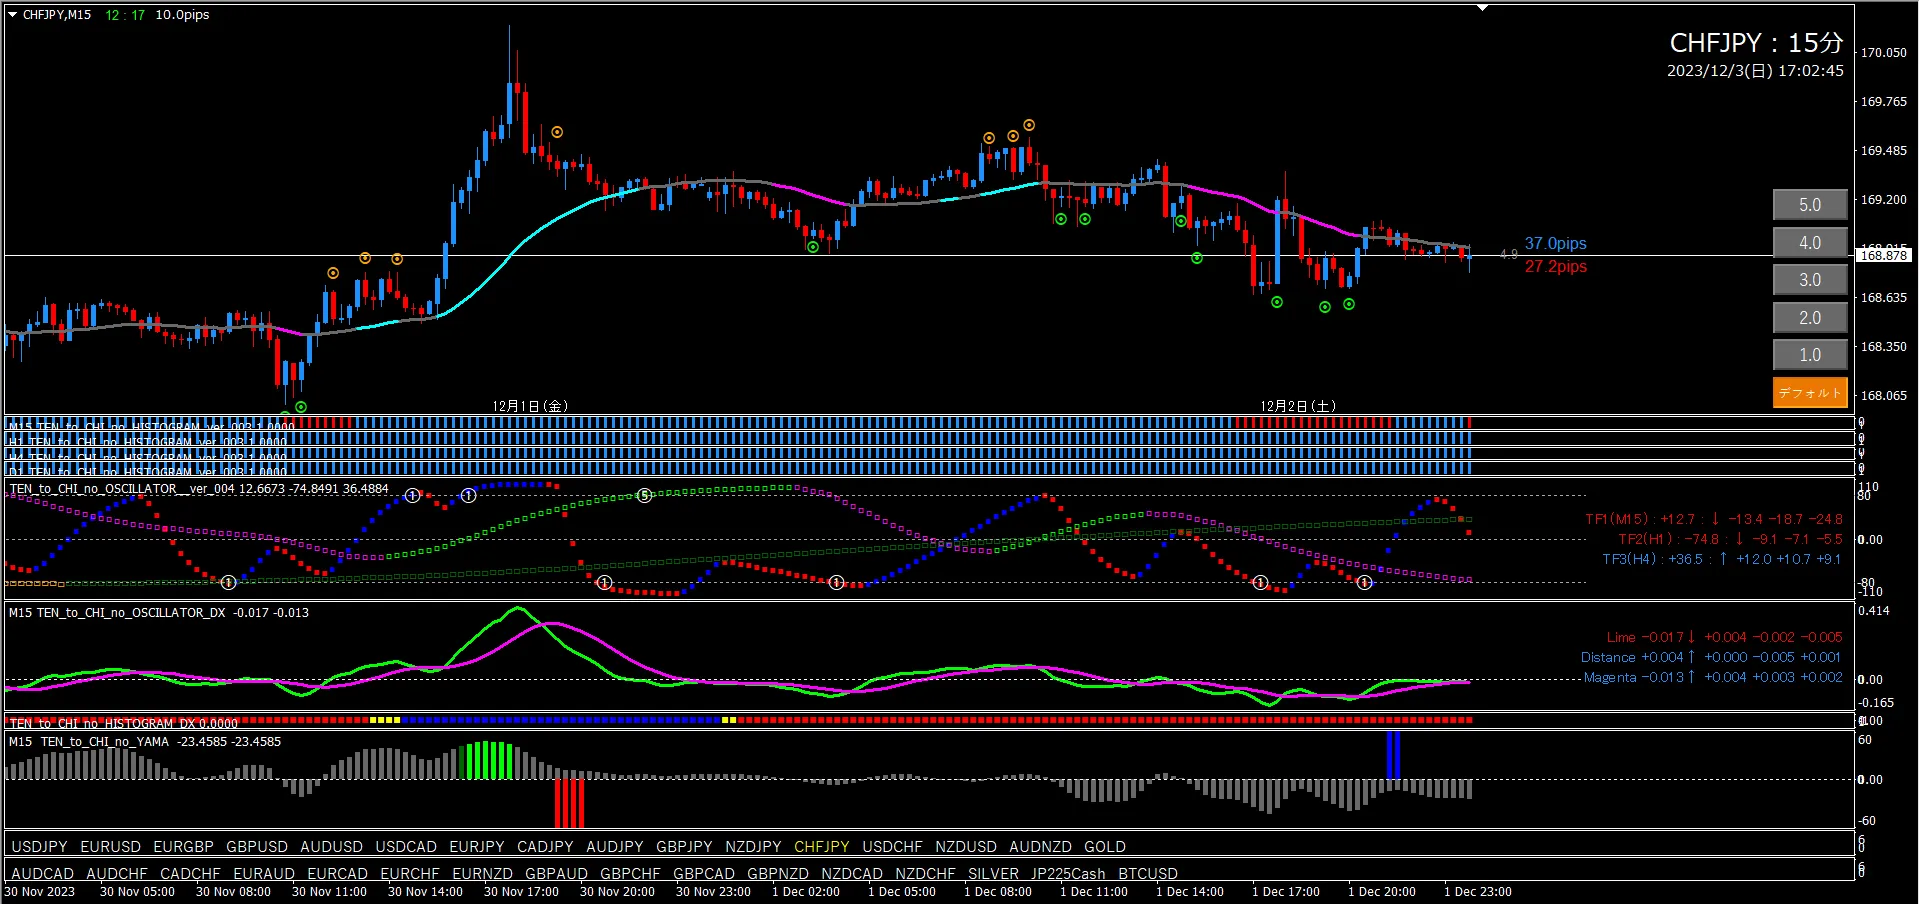
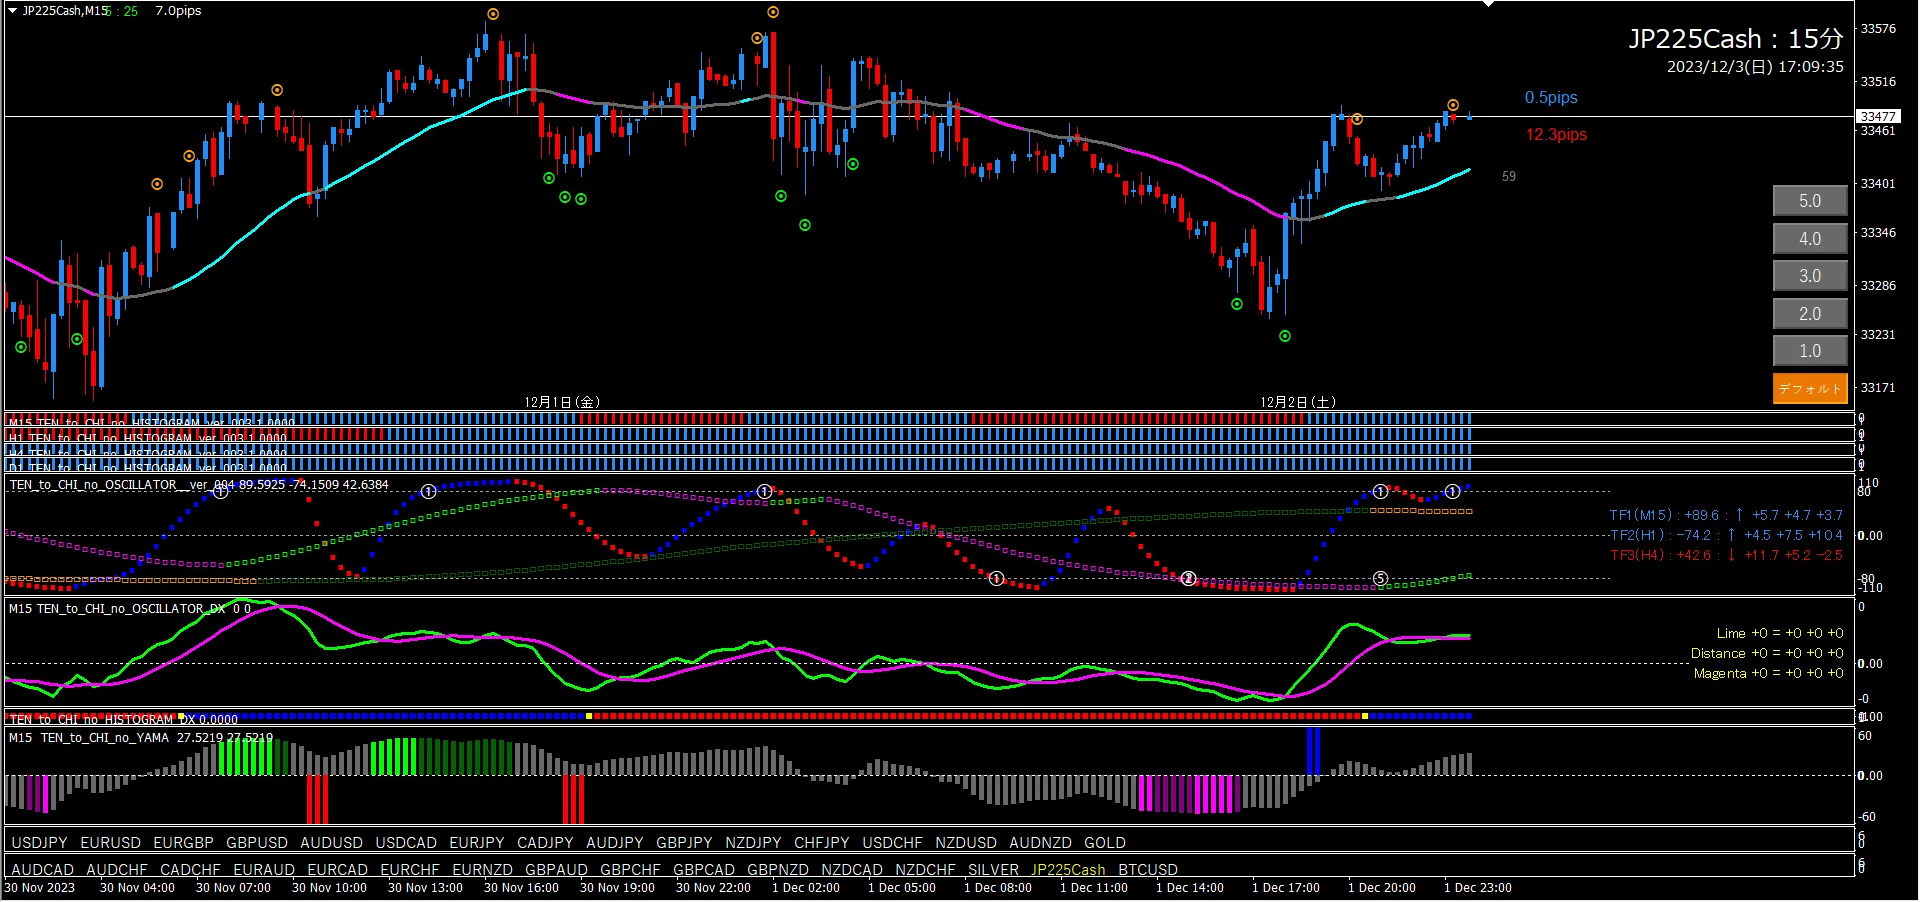
■ 15-Minute Time Frame (Entry Trigger)
If the 4-hour timeframe is judged to be bullish, target only long entries on the 15-minute chart.
Currently, Oscillator TF2 is in a downtrend and TF1 is heading toward -80. First, wait for TF2 to rise. Depending on the situation at that time, search for the most suitable long-entry point. If the 4-hour chart clearly indicates an uptrend, you may enter even with modest justification. Be aggressive. While using Heaven and Earth PIPS FUTURE, keep the timing of the dot signals in mind.
■Heaven and Earth EA usage (on 15-minute chart)
After confirming an uptrend on the 4-hour chart, check whether Oscillator TF2 is rising. If rising begins, use the EA pattern that best fits the situation.
If the current candlestick is below the line, the long-entry signal is likely to appear, so set EA Pattern ①.
If TF1 is near -80, or Oscillator Signal ① appears, set EA Pattern ②.
If TF1 and TF2 reach -80 and Oscillator Signal ② appears, target EA Pattern ③.
If a valley lights up, set EA Pattern ④ at that point.
If the 4-hour chart clearly confirms a trend, use EA Pattern ⑥ and consider automatic trading via Heaven and Earth line color change. This lets you capture from one end of the trend to the other.
■Abusan Signals usage (on 15-minute chart)
If you have Abusan Signals, you can enter from Signal 2 to Signal 1.With Abusan Signals, if the 4-hour line of sight is clearly established, you may ignore the direction of Oscillator TF2 and other corroborating evidence. It is a very strong trend-following signal, so there is no problem.The usage is the same for other currency pairs, so it is omitted from the following analysis.

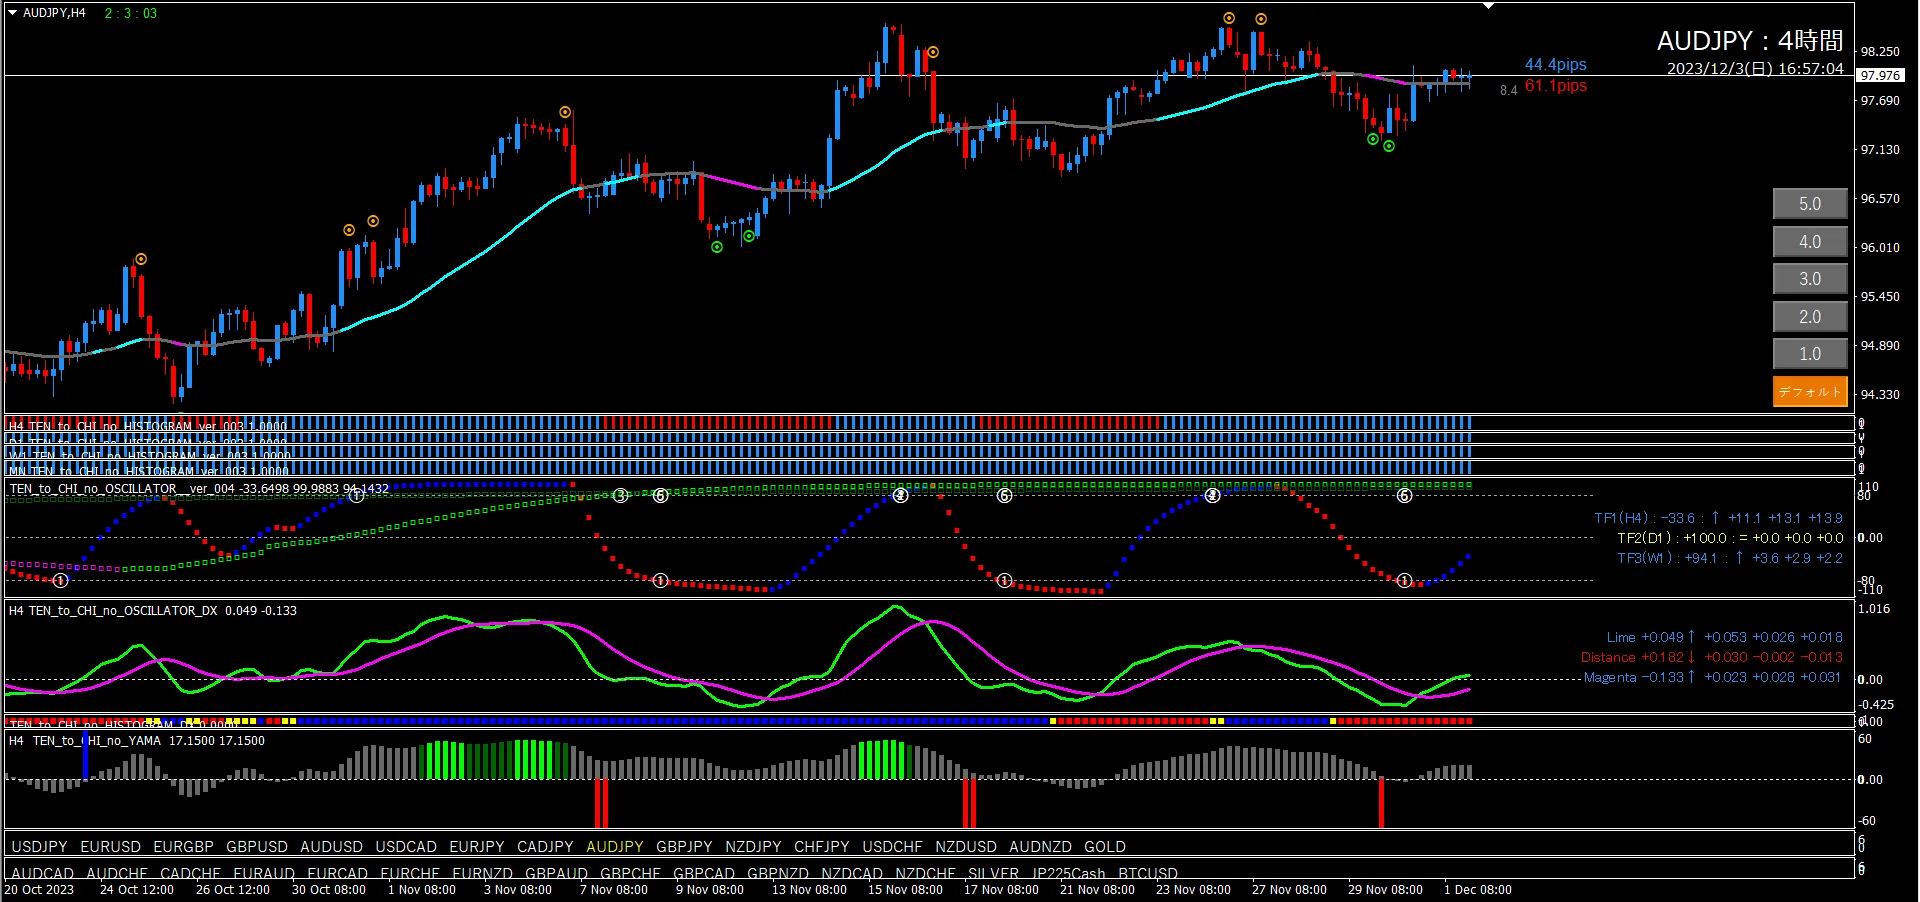
■ 4-Hour Time Frame (Context)
Oscillator TF2 staying near +100, TF1 reaching -80 and turning higher after Oscillator Signal ⑥ lights up. Oscillator DX has crossed up after some time, but by Oscillator DX’s reading it is still valid. Based on these, it seems appropriate to have an up bias at this stage. There are at least 44.4 pips before a short signal. If a short-entry signal appears, reset the up bias.
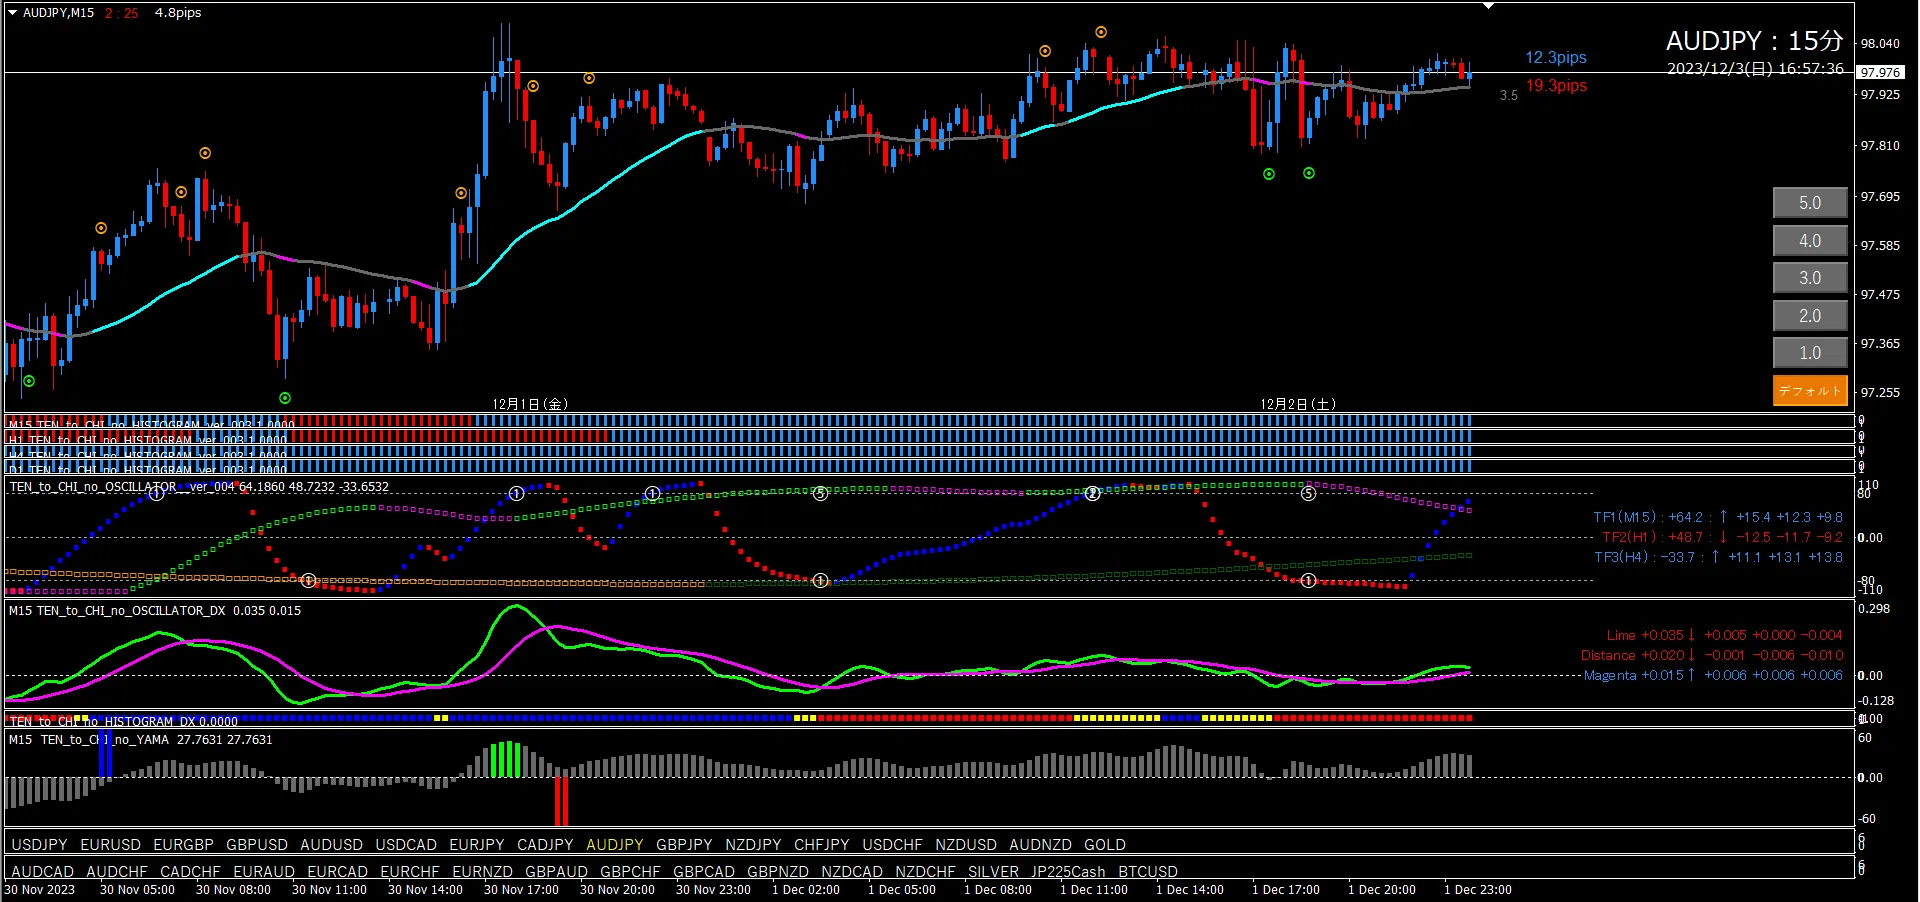
■ 15-Minute Time Frame (Entry Trigger)
Since the 4-hour frame is already bullish, aim for long entries only on the 15-minute chart.
As a future scenario, first wait for the rise of TF2 and a long-entry signal. This is the basic pattern. There are at least 19.3 pips until the long-entry signal appears. With possible gap openings at the start of the week, it may reach quickly, so monitor carefully.
■ Heaven and Earth EA usage (on 15-minute chart)
After judging an uptrend on the 4-hour chart, confirm whether Oscillator TF2 is rising; if so, use EA Pattern ① that best fits the situation. Depending on the chart shape at the time of rising, other patterns may be used. Refer to ① EURUSD.

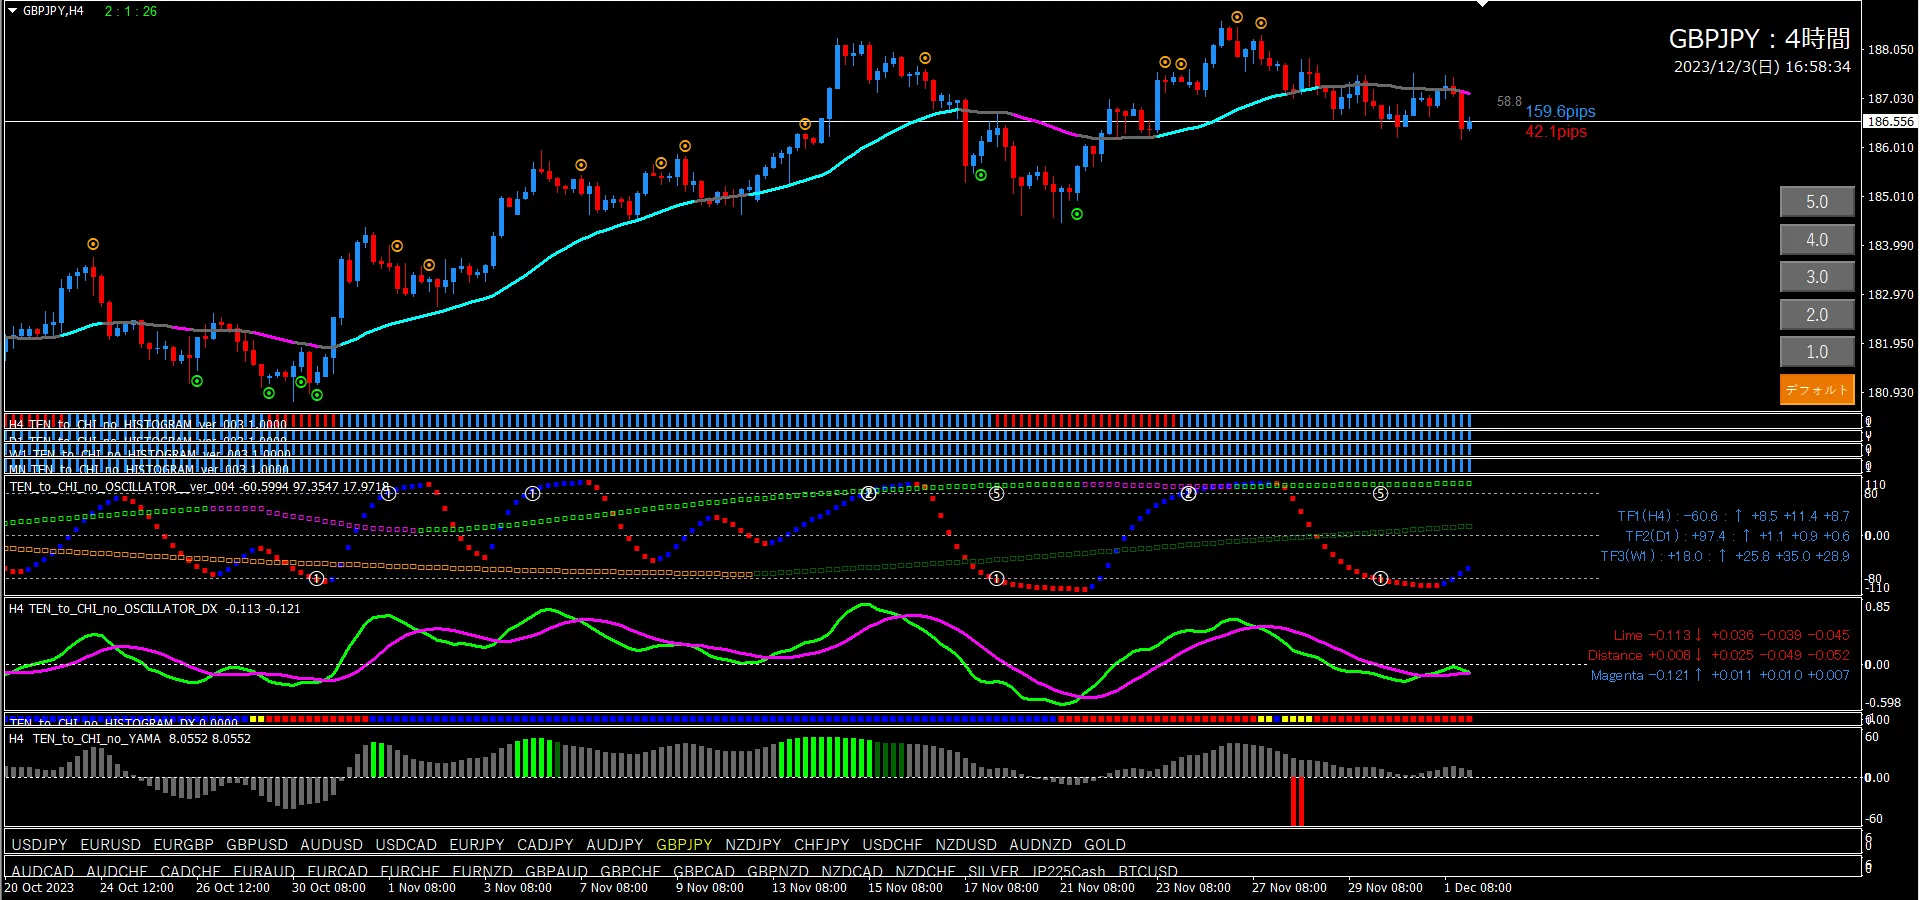
■ 4-Hour Time Frame (Context)
Oscillator TF2 sticks high, TF1 reaches -80 and turns up after Oscillator Signal ⑤ lights up. There are at least 42.1 pips before a long-entry signal. The up-bias is best, but you may also consider another measure if Oscillator DX shows Lime↑Distance↑ again.
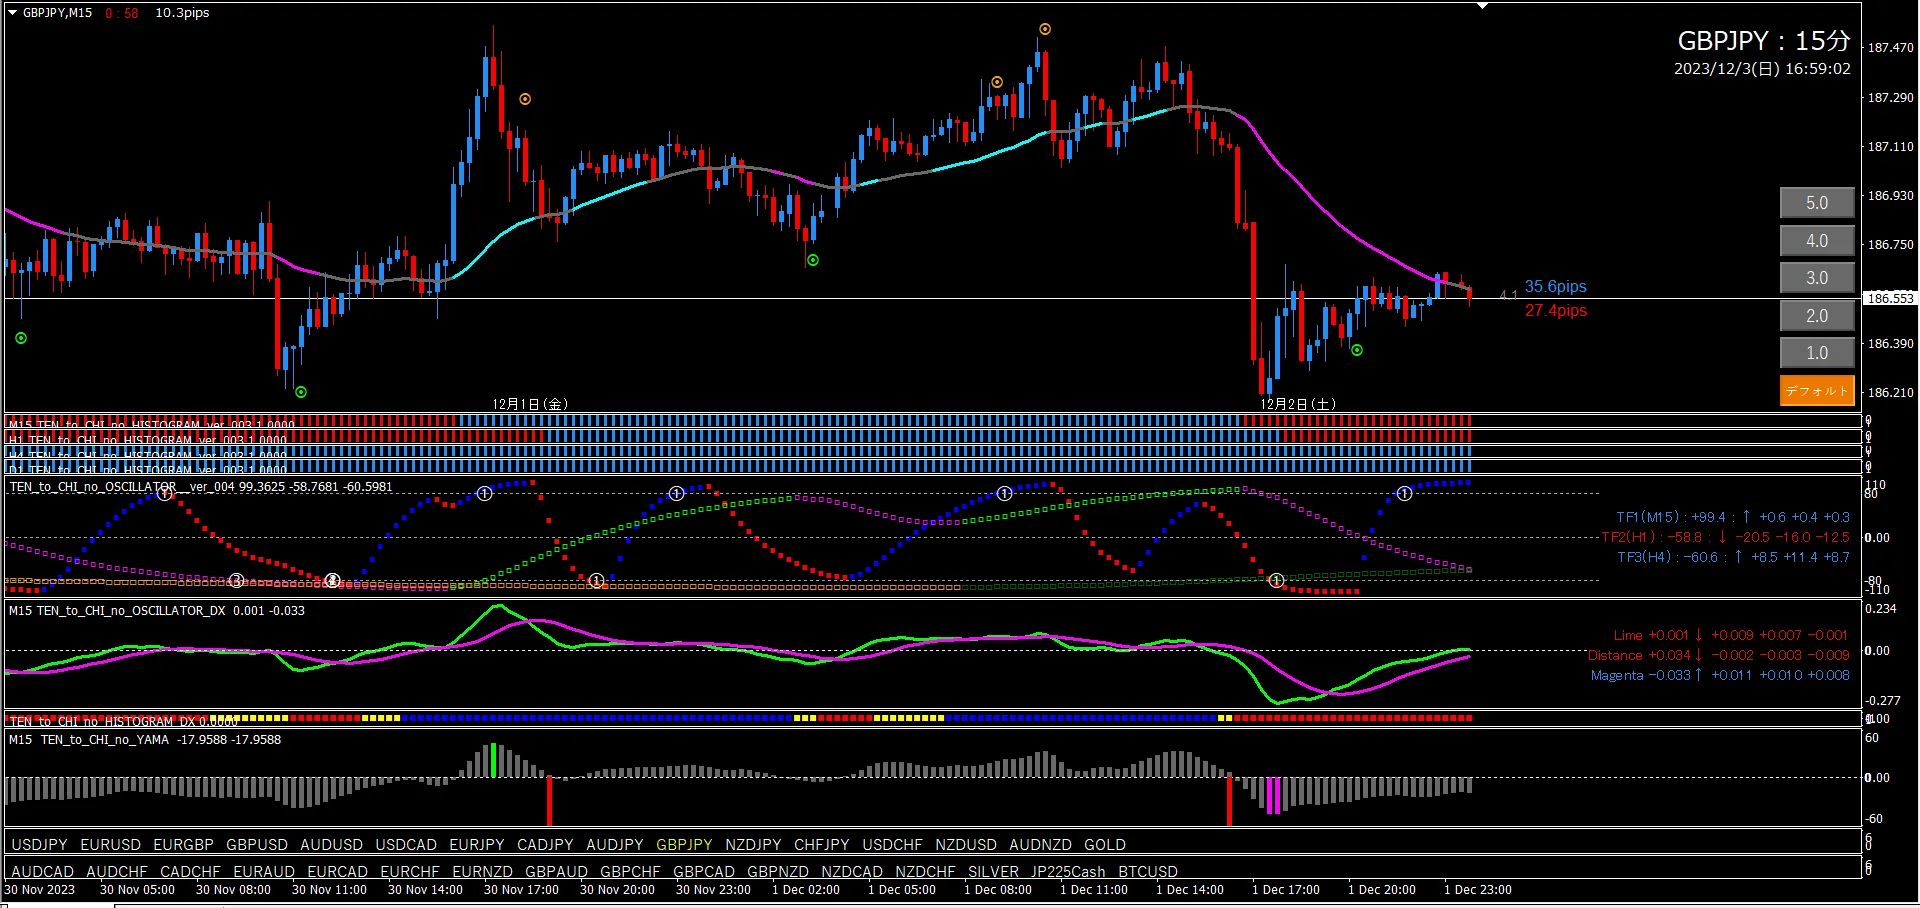
■ 15-Minute Time Frame (Entry Trigger)
If the 4-hour timeframe is bullish, target long entries only on the 15-minute chart.
As a future scenario, first wait for TF2’s rise and a long-entry signal. There are at least 27.4 pips until the long-entry signal. A gap opening at the start of the week may reach quickly, so watch carefully.
■ Heaven and Earth EA usage (on 15-minute chart)
After judging an uptrend on the 4-hour chart, confirm Oscillator TF2 rising to set EA Pattern ① as basic. Depending on the rising pattern, other patterns may be used. Refer to ① EURUSD.

■ 4-Hour Time Frame (Context)
Oscillator TF2 has started to fall. It has been a while since the short-entry signal appeared, but Oscillator DX is also near a bearish cross, so at this point a downside bias is reasonable. However, if it continues to fall without crossing and then rebounds, the downside bias would be reset. Since the candlestick currently touches the line and rebounds once, there is a possibility of another rise. In that case, wait for another short-entry signal and base the bias on that.
■ 15-Minute Time Frame (Entry Trigger)
Since the 4-hour timeframe is already bearish, target only short entries on the 15-minute chart.
Oscillator TF2 is already descending. TF1 is descending as well. The candlestick is dithering near the line, so you may hold a position until the line touch triggers a short-entry signal. There are at least 27.2 pips until the short-entry signal.
■ Heaven and Earth EA usage (on 15-minute chart)
Currently Oscillator TF2 is already descending, so basic is to set EA Pattern ①, but there are at least 37.0 pips until a short-entry signal. It might be worth betting on the week-opening gap. Betting isn’t gambling since EA halts upon the color change of TF2.

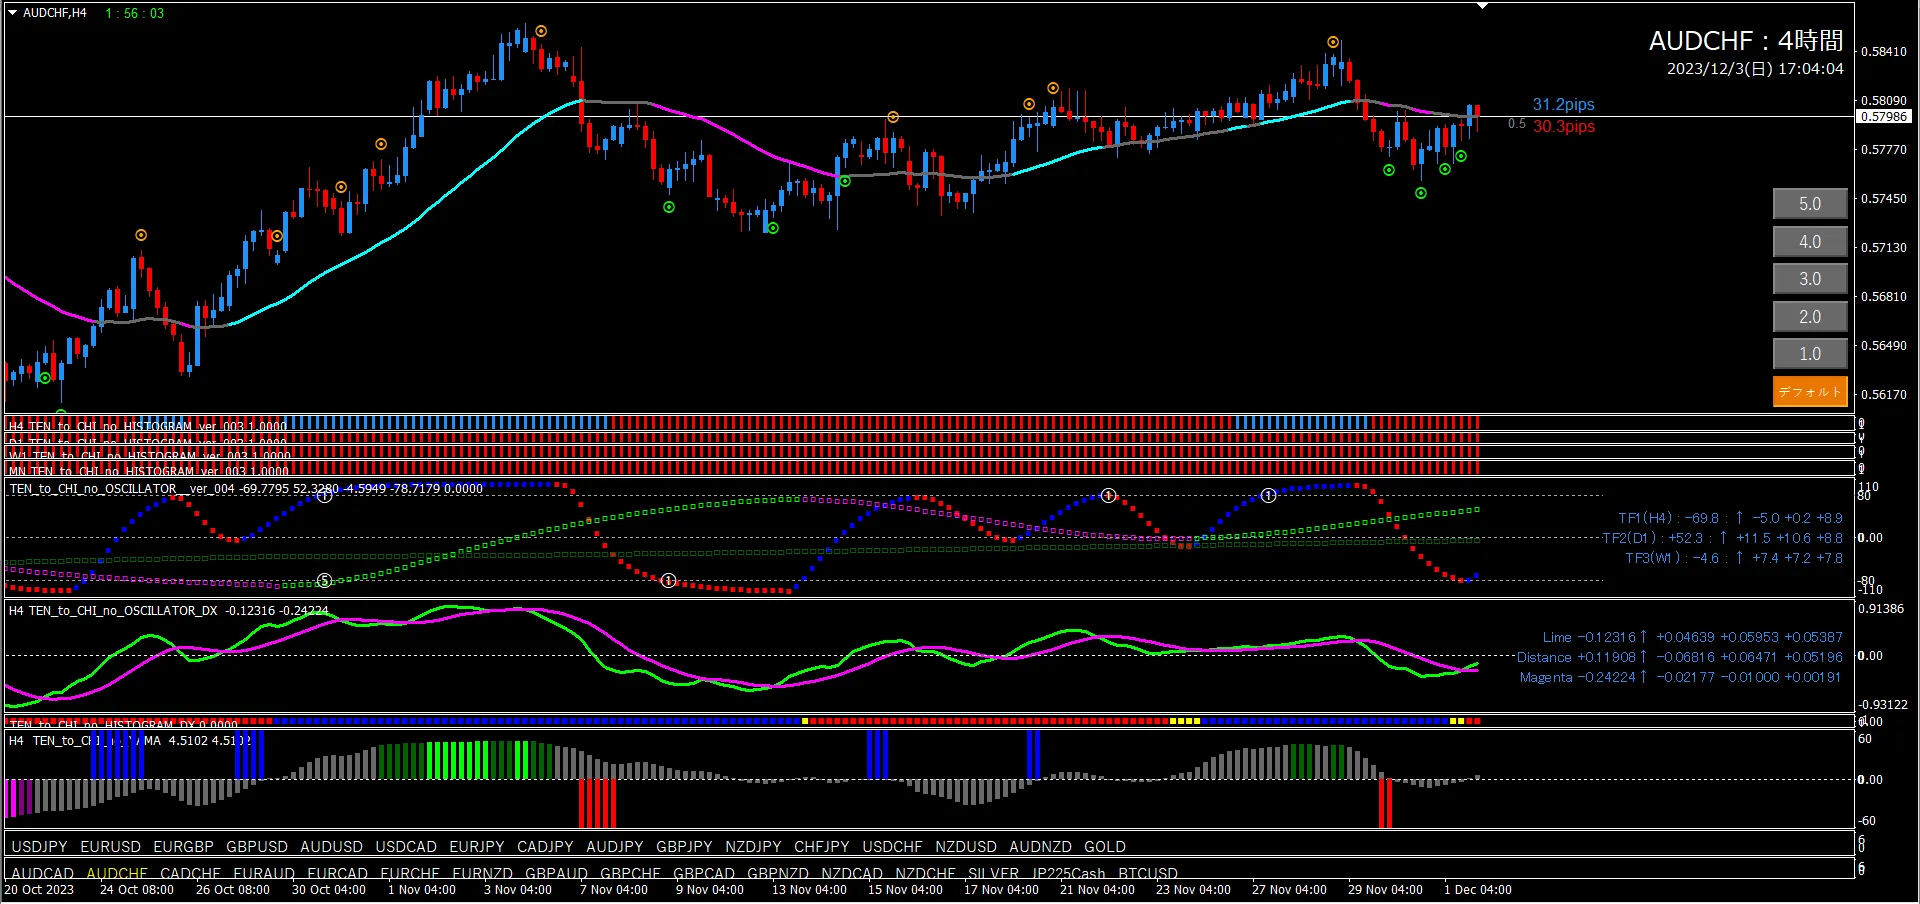
■ 4-Hour Time Frame (Context)
Oscillator TF2 is rising (a gradual rise, not ideal), TF1 has reached -80 and turned up, Oscillator DX has just crossed up. Short-entry signal has appeared just before, so it seems reasonable to have an up bias at this point. There are at least 31.2 pips before a short-entry signal; until then, keep an up bias.
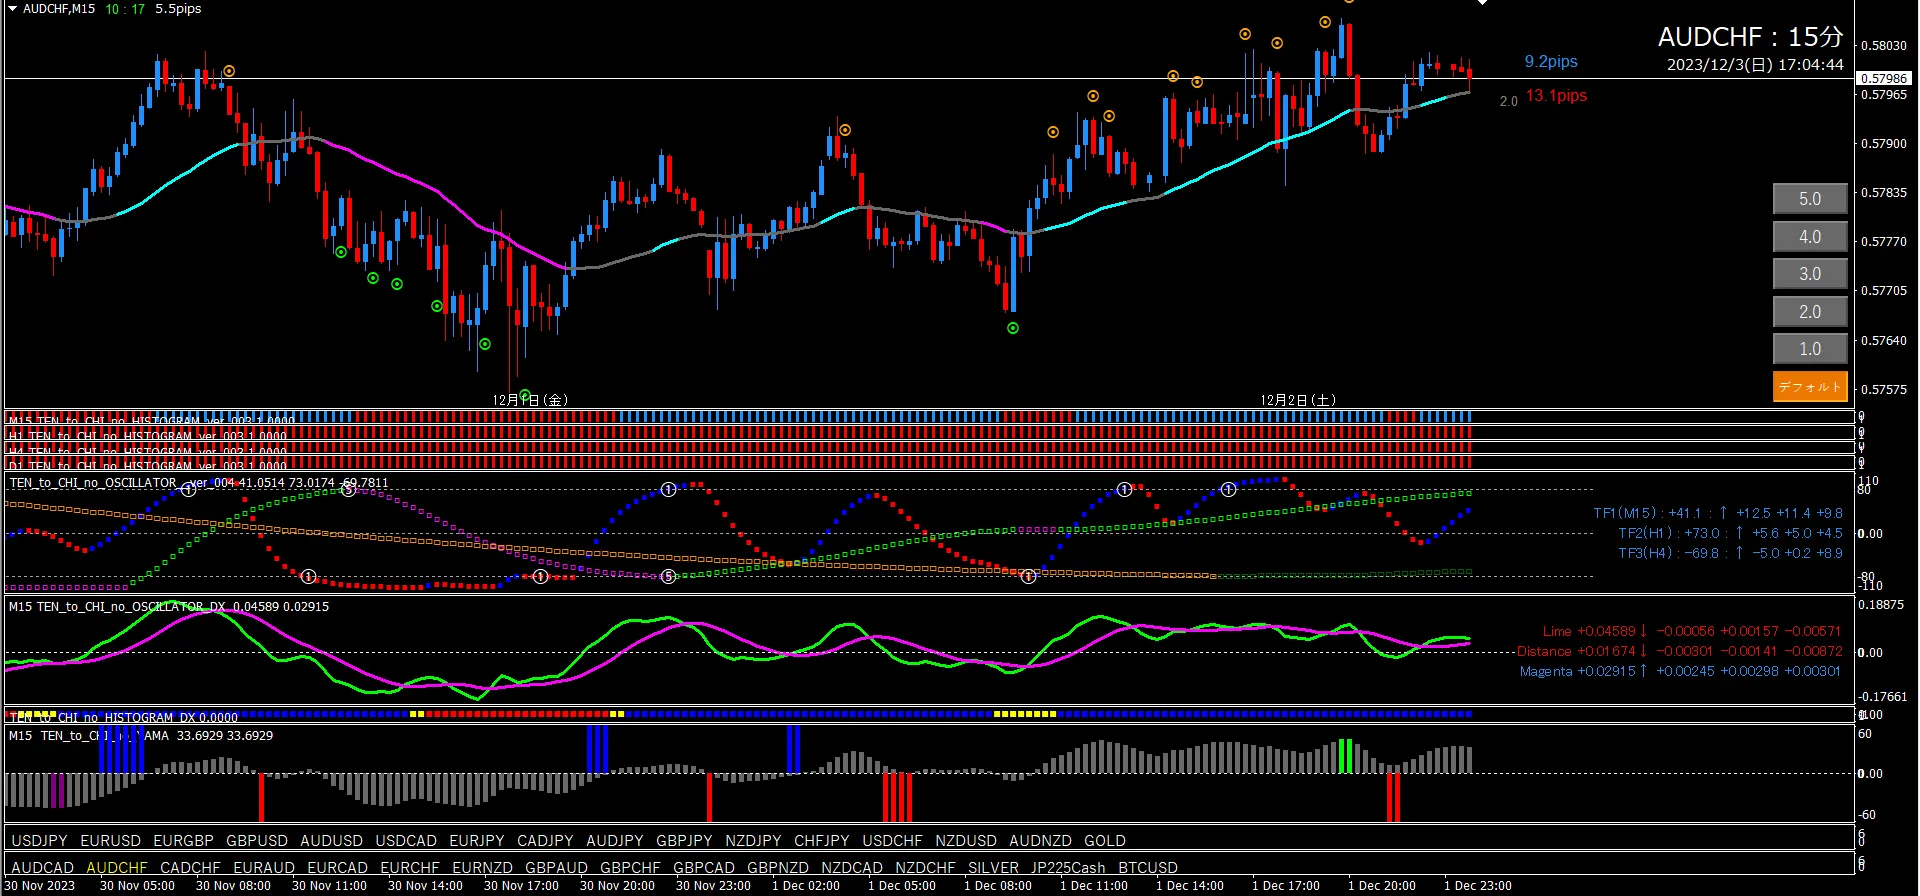
■ 15-Minute Time Frame (Entry Trigger)
Since the 4-hour timeframe is already bullish, focus on long entries only on the 15-minute chart.
Oscillator TF2 is rising now. It already seems to have risen, but aiming for a small profit on near-term line touches is also okay. There are at least 9.2 pips until a short-entry signal, and at least 13.1 pips until a long-entry signal. Targeting both is possible.
■ Heaven and Earth EA usage (on 15-minute chart)
Since TF2 is rising, you may set EA Pattern ① and wait for the week-opening gap. TF1 is in a good position, so you can set EA Pattern ②, with both dot-take profit and TF1 TP to ensure earlier TP is hit first. Very effective.

■ 4-Hour Time Frame (Context)
Oscillator TF2 is rising (gradually, not ideal), TF1 has reached -80. Oscillator DX also near an up-cross. However, after the most recent long-entry signal, it has fallen again. Wait for at least another 3.8 pips upward to see another long-entry signal. Then you can consider an up bias.
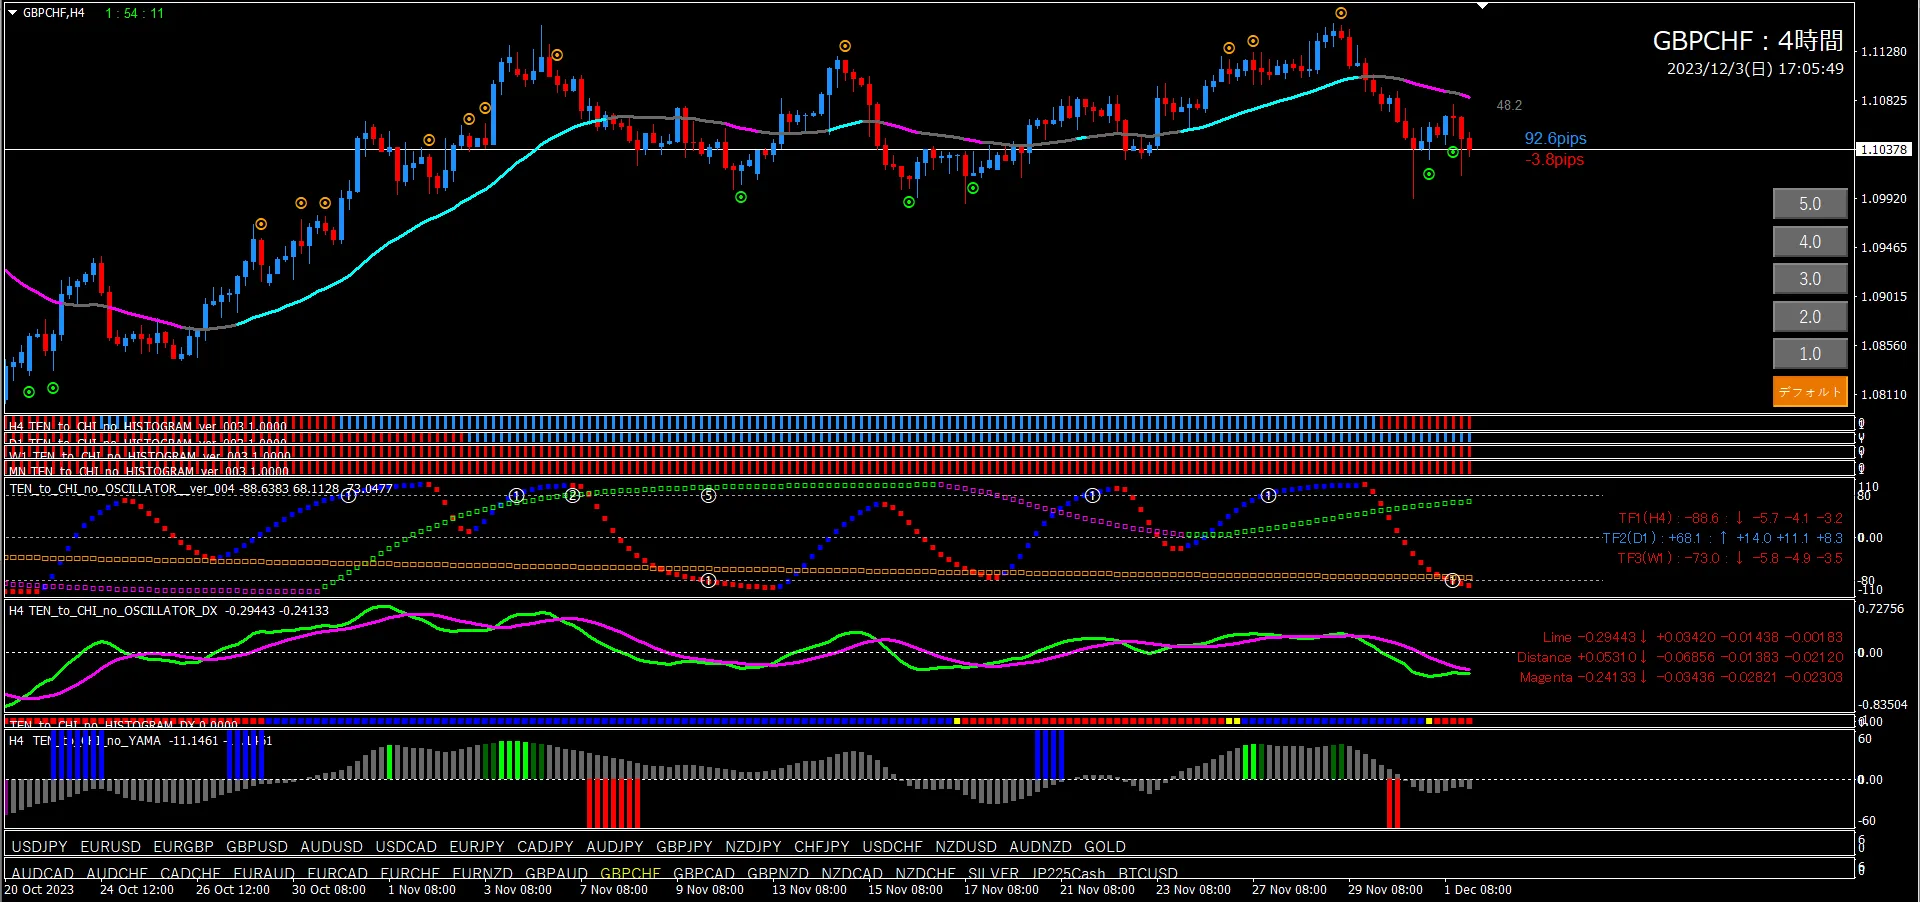
■ 15-Minute Time Frame (Entry Trigger)
If the 4-hour timeframe is bullish, target long entries only on the 15-minute chart.
Currently Oscillator TF2 is bearish. TF1 is bearish as well. The candlestick is hovering near the line, so you may hold positions until a line touch triggers a short-entry signal. There are at least 12.9 pips until a short-entry signal.
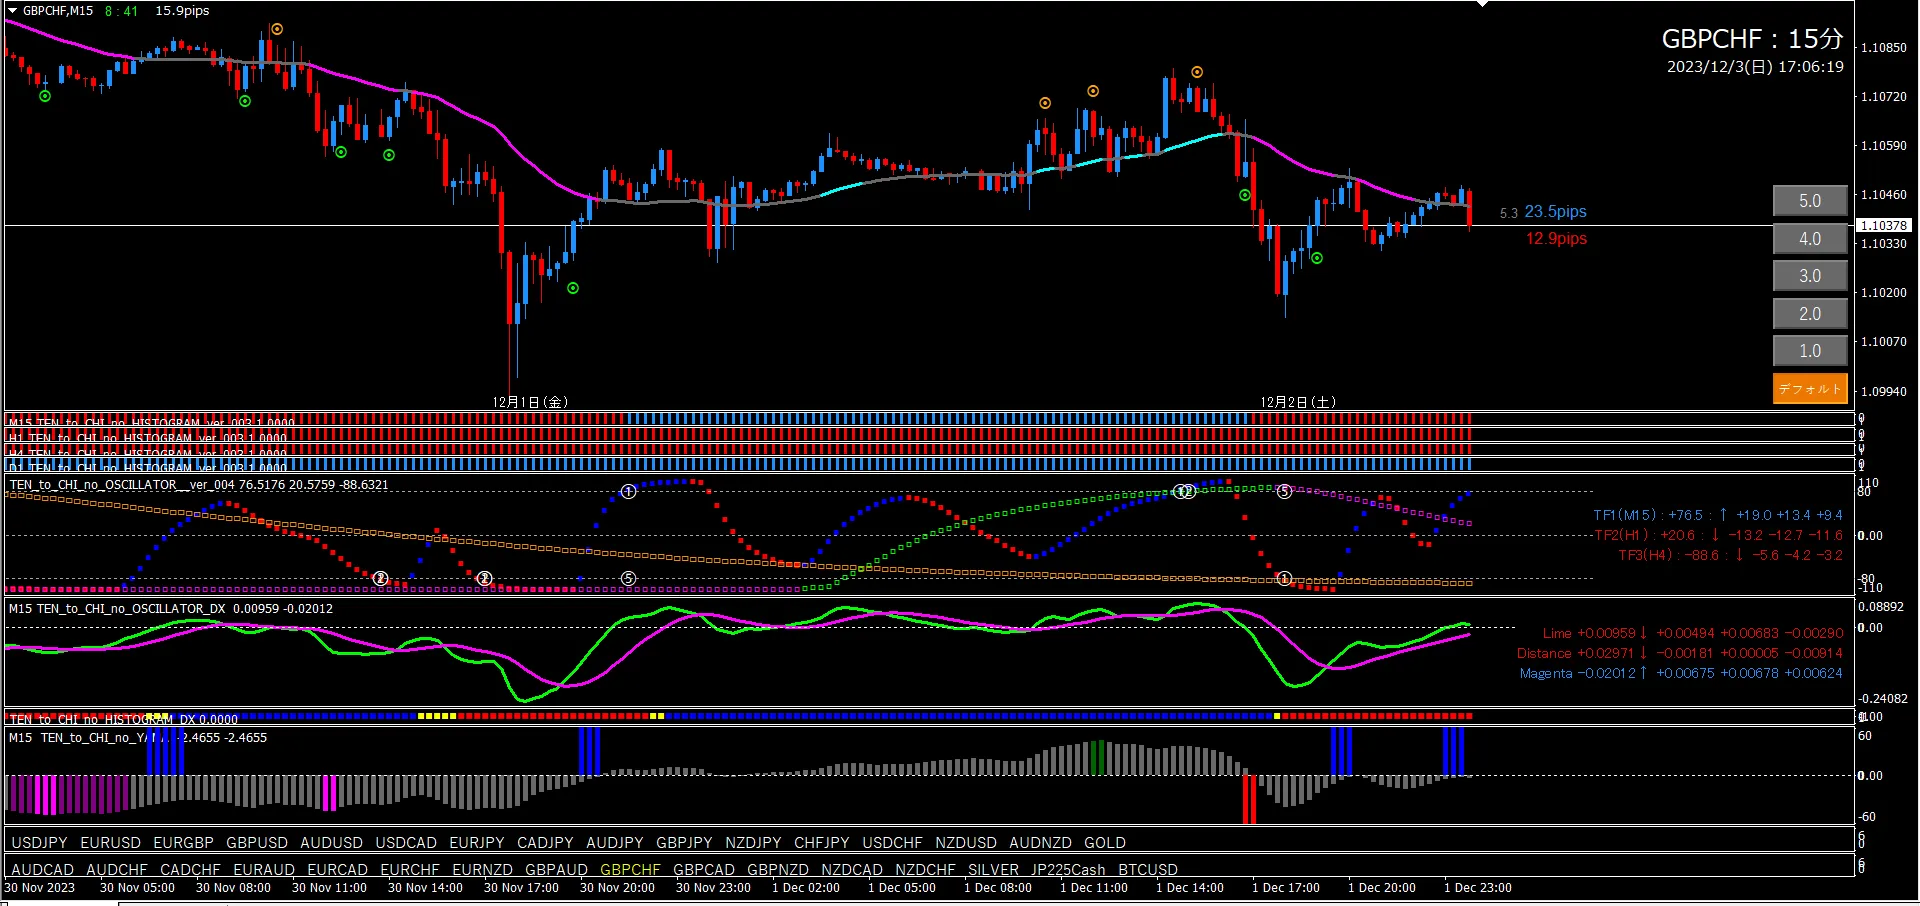
■ Heaven and Earth EA usage (on 15-minute chart)
Currently with TF2 rising, set EA Pattern ① and wait for the week-opening gap. Since TF1 is also well-placed, set EA Pattern ②, with dot TP and TF1 TP both set to prioritize whichever hits first. This is a very effective method.

■ 4-Hour Time Frame (Context)
Oscillator Signal ⑤ appears to be forming. Long-entry signal has appeared just prior. A valley has appeared as well. Based on Oscillator DX, an up bias can be assumed at this point. It’s a robust pattern overall.
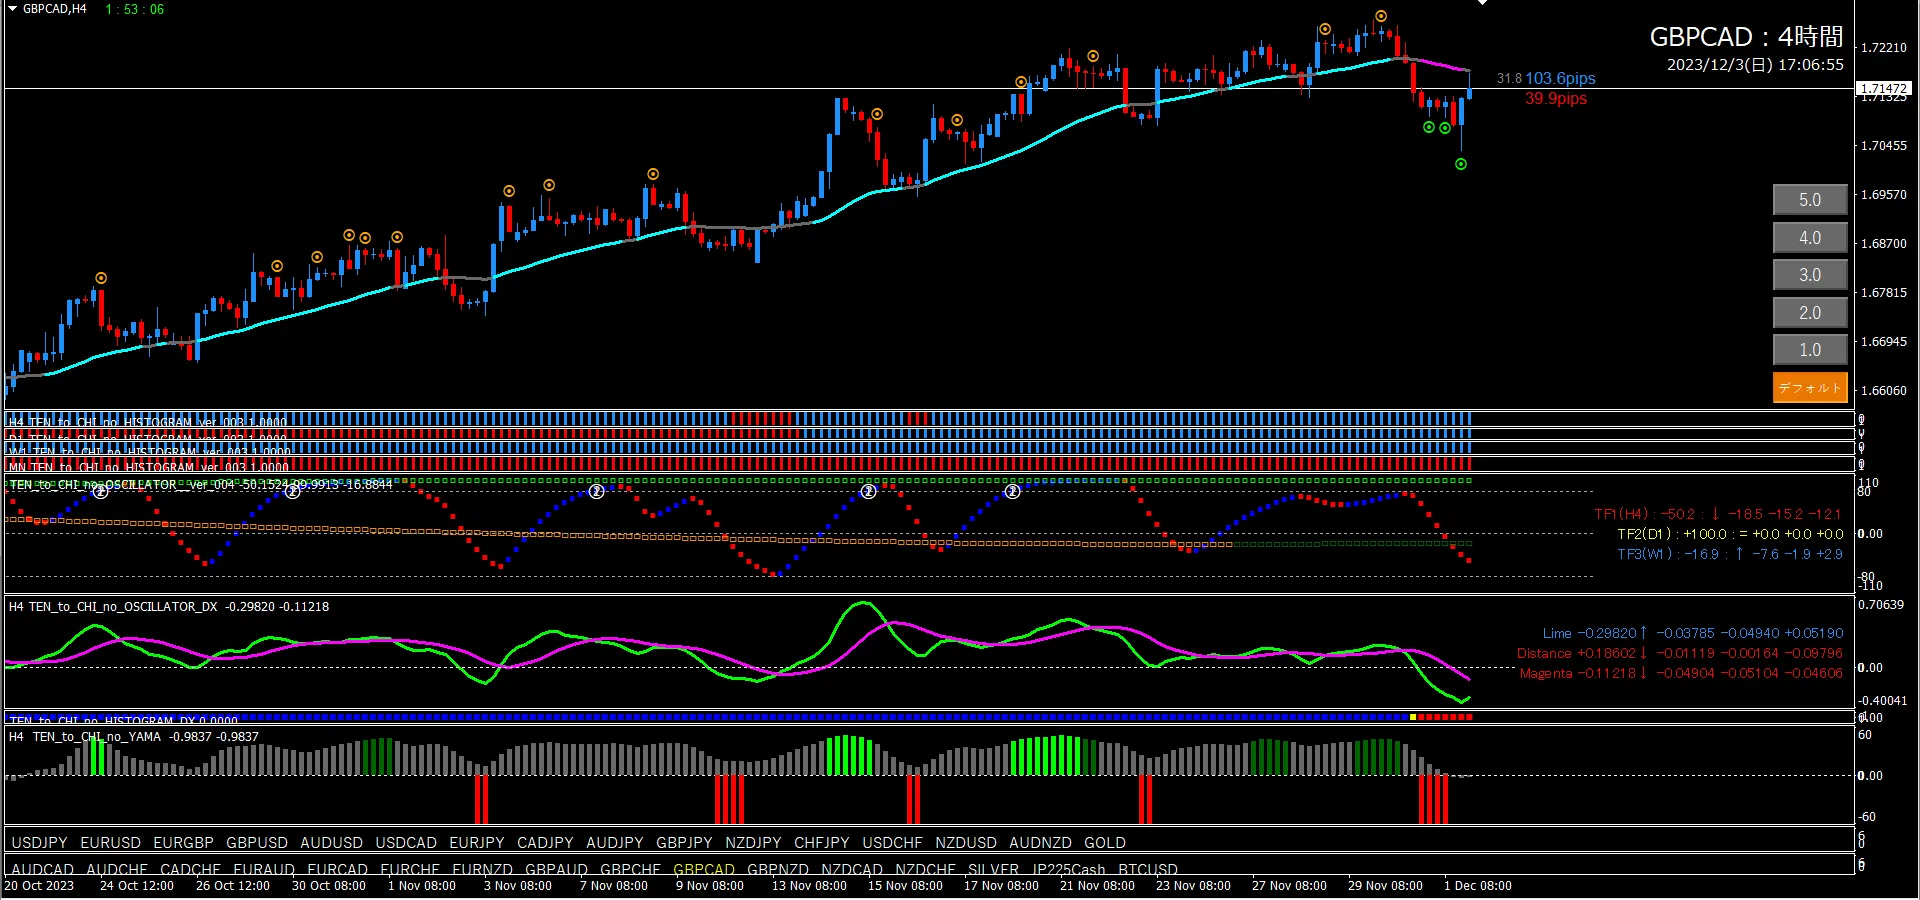
■ 15-Minute Time Frame (Entry Trigger)
If the 4-hour time frame is bullish, target long entries only on the 15-minute chart.
TF2 is already rising. It already looks like it has risen, so aiming for a profit via near-term line touches is also an option. There are at least 48.1 pips until a long-entry signal. A gap at the start of the week would cause a rapid decline, so monitor carefully. TF1 is also in a good position, so using Pattern ② is an option. Focus on identifying any long-entry trigger, even a small reason will suffice.
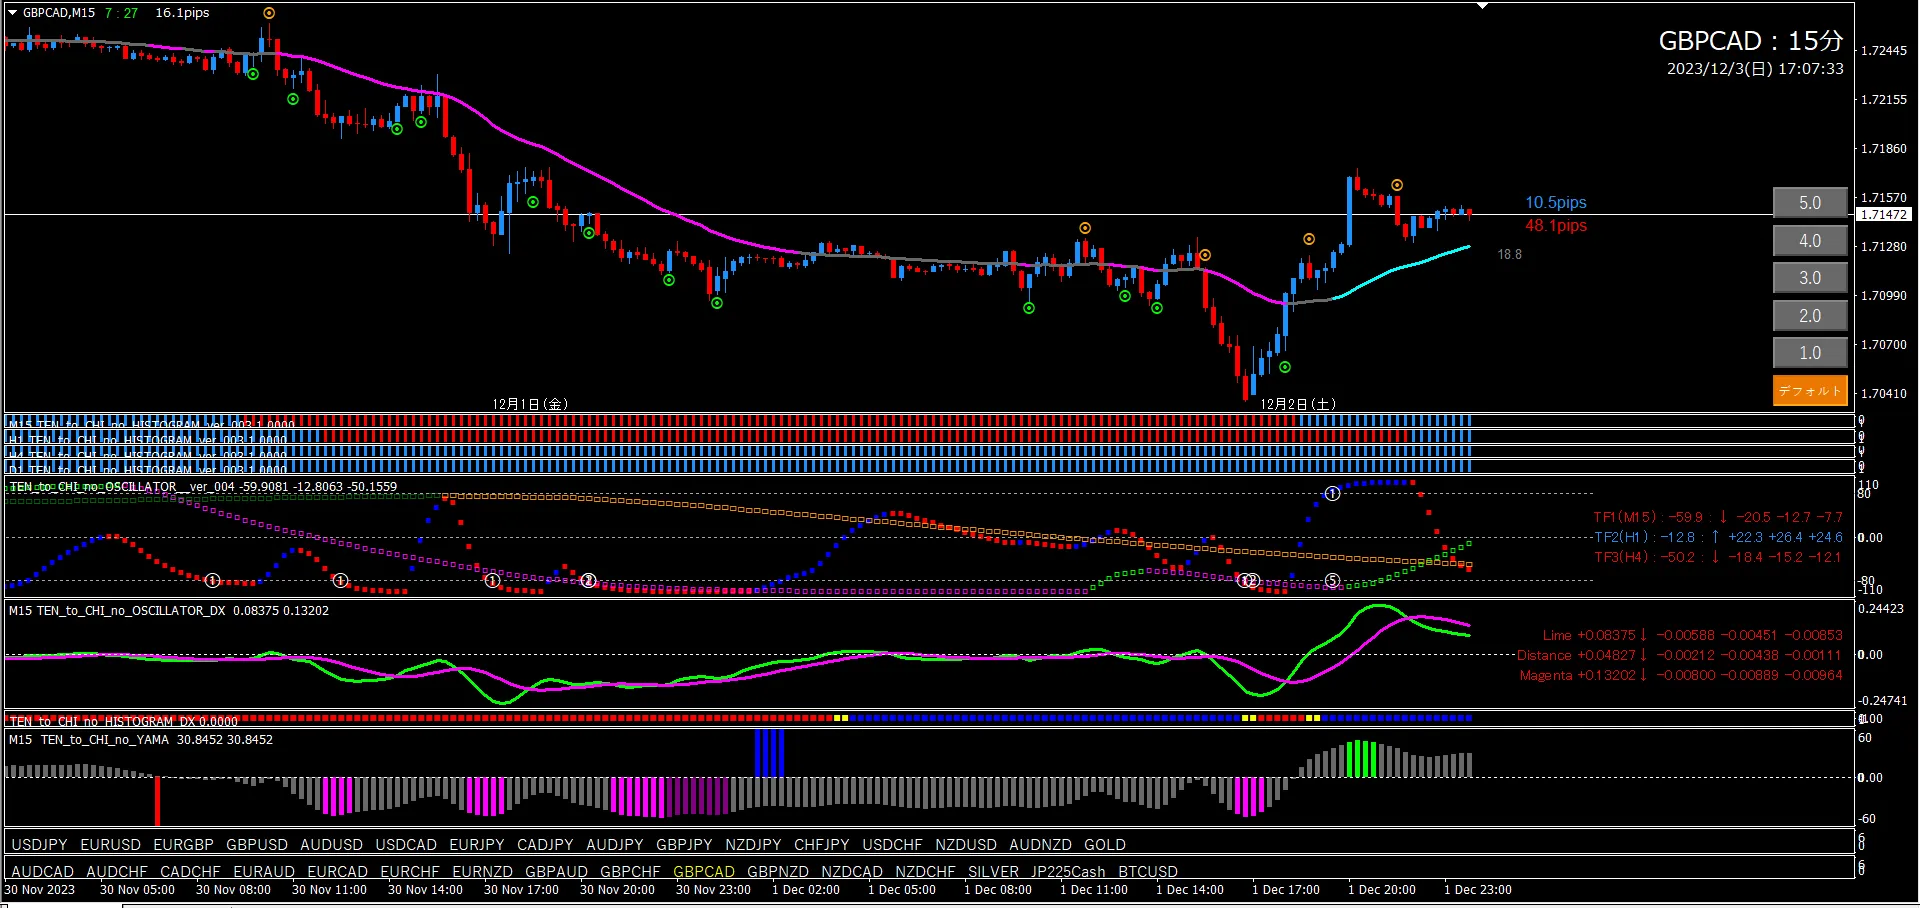
■ Heaven and Earth EA usage (on 15-minute chart)
Since TF2 is rising, consider setting EA Pattern ① and waiting for the week-opening gap. With TF1 in a good position, set EA Pattern ② and use both dot TP and TF1 TP for automatic take-profit, prioritizing whichever hits first. This is highly effective.

■ 4-Hour Time Frame (Context)
Oscillator TF2 has begun to decline. There are at least about 27.1 pips before a short-entry signal. After that, a down-trend is typical. If the candlestick continues to touch the line and then declines, consider the remaining pips until the short-entry as still down-trend. TF1 is also turning down.
■ 15-Minute Time Frame (Entry Trigger)
If the 4-hour timeframe is bearish, target only short entries on the 15-minute chart.
Oscillator TF2 is starting to rise again. It’s still early, and the short-entry signal appeared just before. Consider TF2’s downward possibility as well and look for other short-entry triggers. Oscillator Signal ⑤ reappearing along with a short-entry shape would be ideal.

■ Finally, here is the current 4-hour dashboard image.
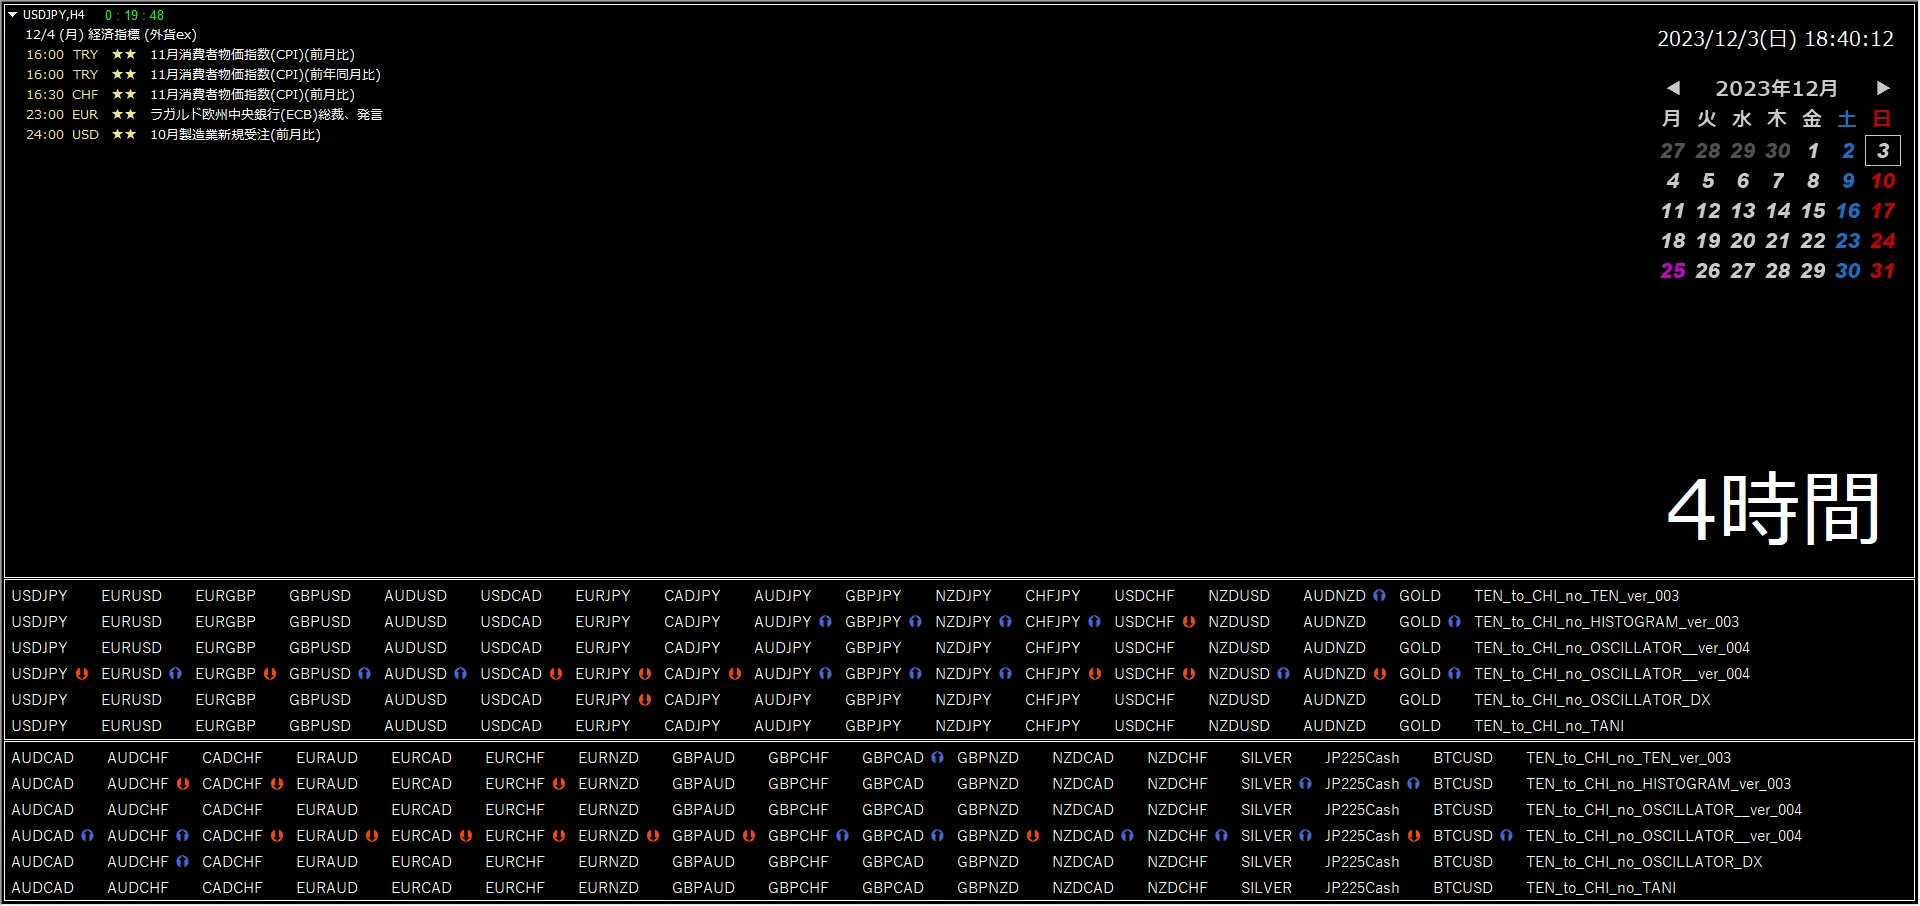

That is all.
I hope this is helpful to everyone to some extent.
