

Usage of "Visualization Indicators" (Part 123)
"Visualization Indicator" utilization (Part123)
1. Further develop the "28 Currency Pairs List Indicator" and indicators
"8CP Visualization Indicator"to drawAUDUSD.
There are versions of the "8CP Visualization Indicator" for Oceania,Oceania edition,London edition,NewYork edition,AnyCP edition. This time, the Oceania edition was used.
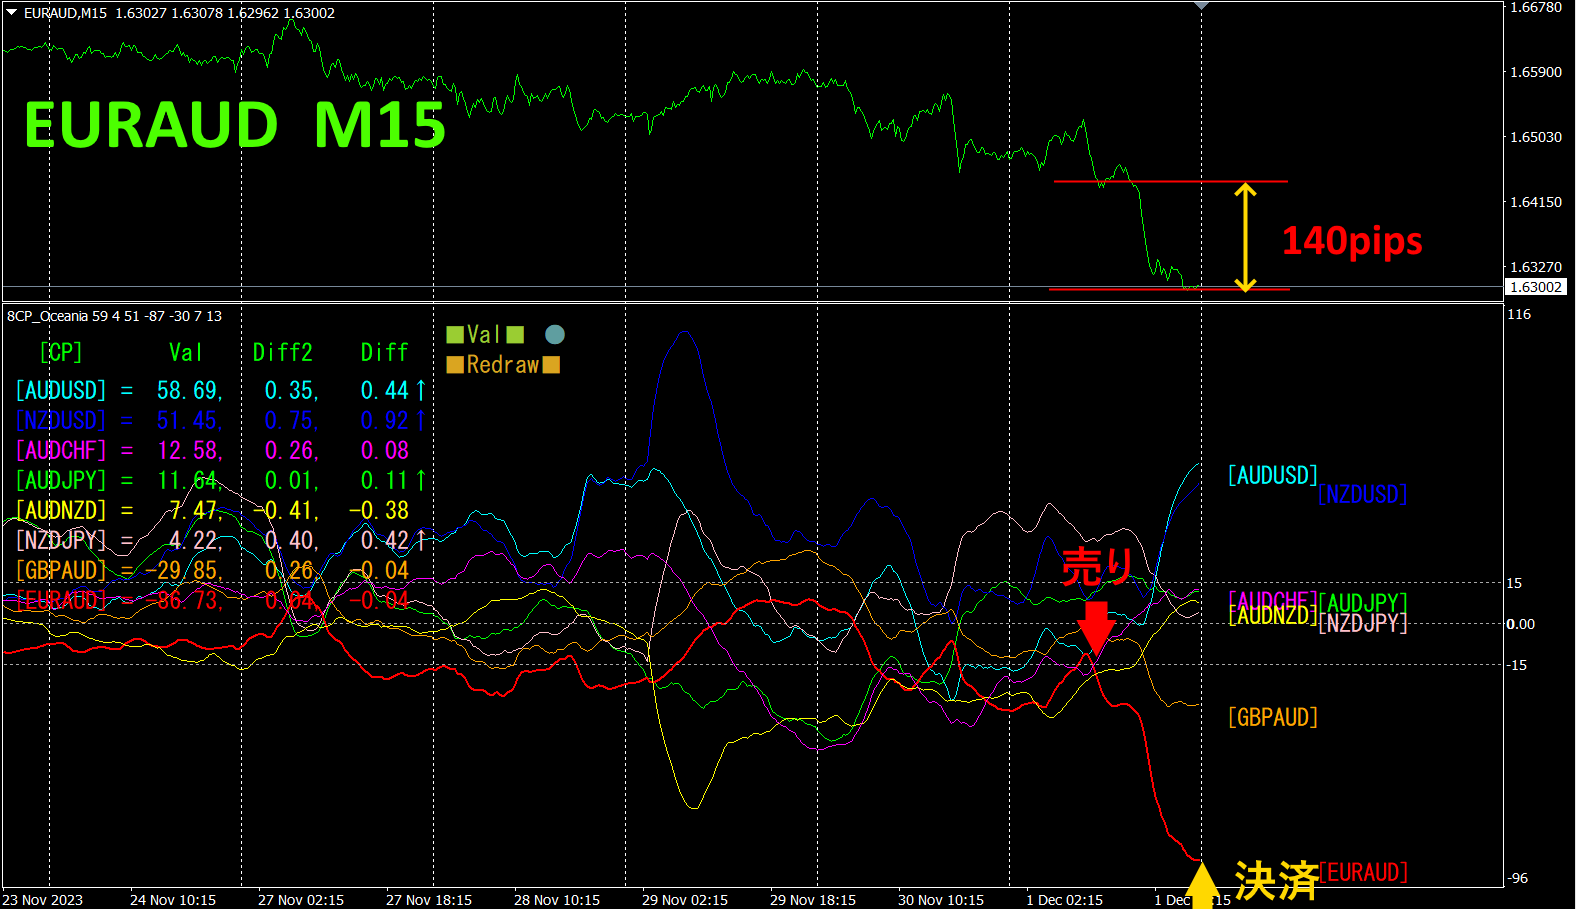
The upper half is the EURAUD 15-minute chart. The lower half is from the "8CP Visualization Indicator." The red thick-line graph corresponds to EURAUD.
On Friday, EURAUD broke below the set of graphs, so a sell entry was made. Since it’s the weekend, we will settle at the bottom for the day.Approximately140 pips of profit was obtained.With the "8CP Visualization Indicator," by just focusing on the most volatile currency pair, you can trade efficiently.
2. Best SelectIndicator to Try
The following figure is a screenshot taken on2023 year11 month28 day04:41
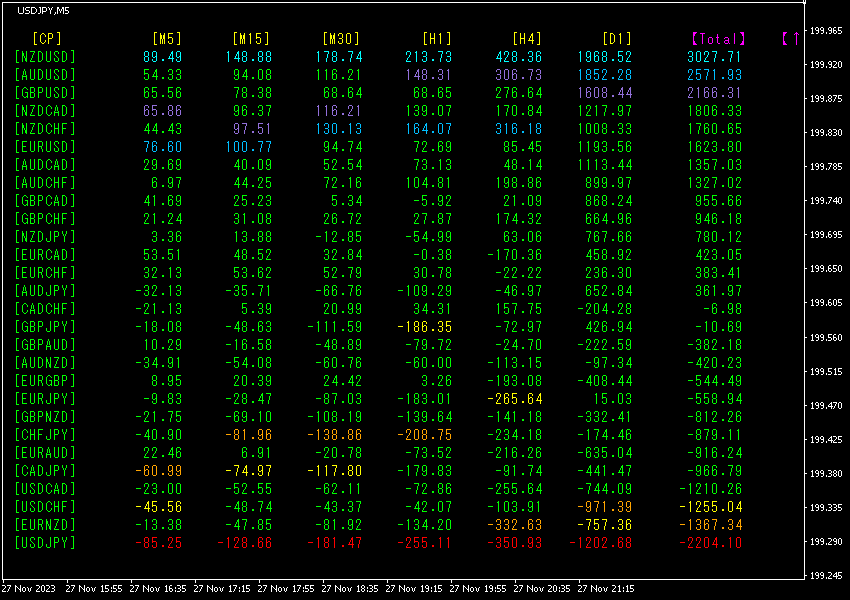
value sorted in descending order. The topmost row, NZDUSD, is blue on all timeframes, and the total value is3027.71 with a positive number. This indicates a strong upward trend for NZDUSD. shows a significant uptrend.
Now, let's look at the NZDUSD chart.
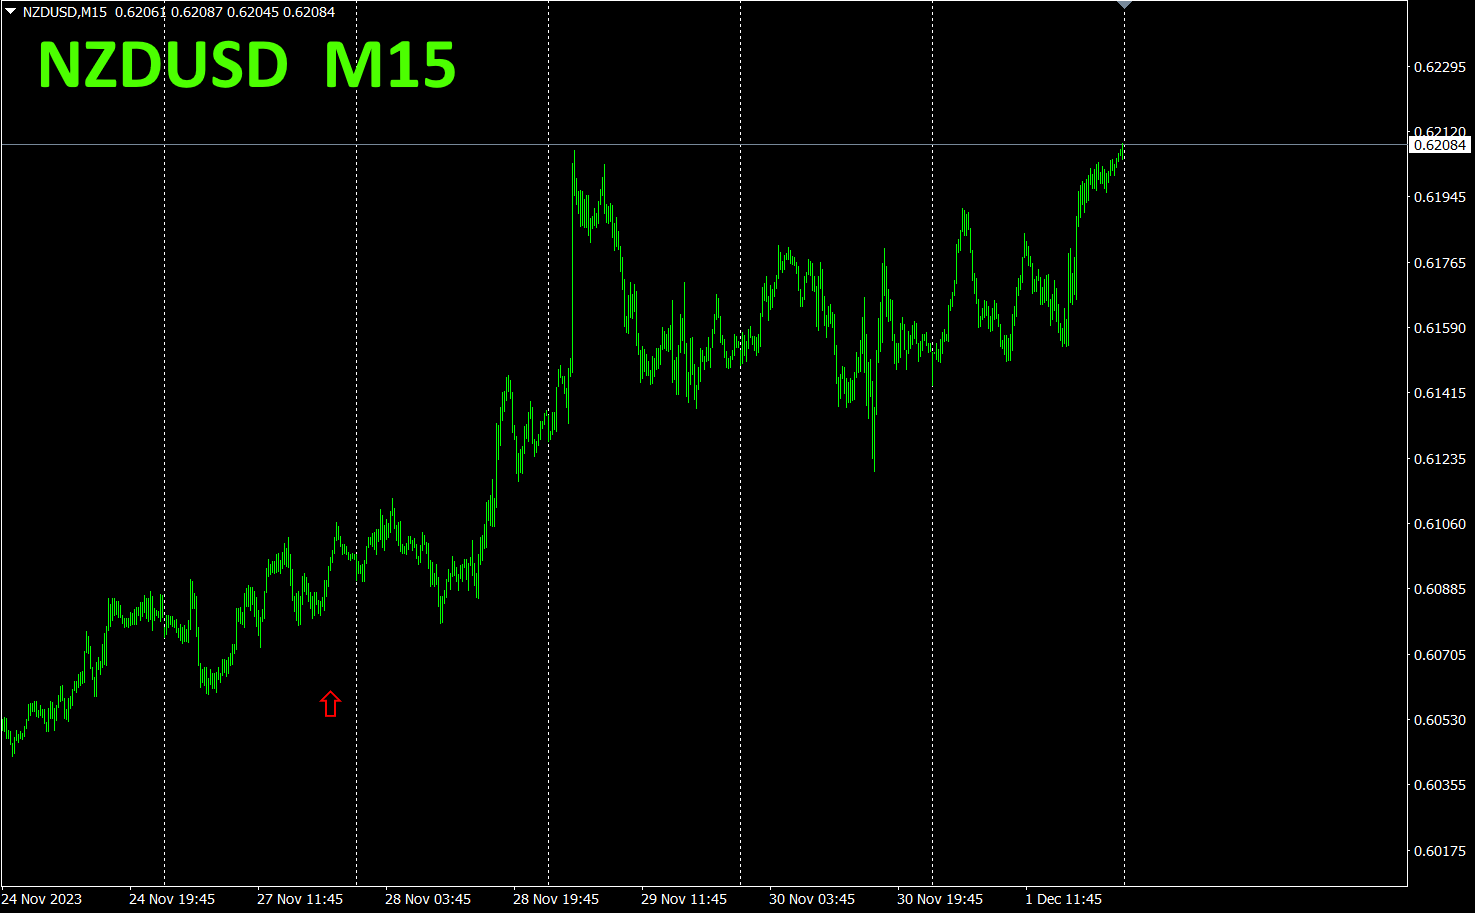
The red arrows mark where the screenshot was taken. It captures a section of an upward trend rising at a steep angle. If you buy here and settle at the weekend, you could gain about of profit.
The "28 Currency Pairs Best Select Indicator" lets you easily identify which currency pair among 28 shows the strongest trend. It also tells you whether you should trade now or not with numeric and color signals. It provides a quick, comprehensive view of all currency pairs.
"28 Currency Pairs Best Select Indicator"
https://www.gogojungle.co.jp/tools/indicators/35128

3. What happened to EURJPY, tracked since May of the year before last?
Since May,EURJPY has been tracked.
To see the overall trend, a 30-minute chart showing roughly the last three weeks is drawn.
Last time I wrote the following.
EUR andJPY are both downward, but is dropping more steeply than. Based on the direction of the hourly currency strength chart, EURJPY is expected to move upward.
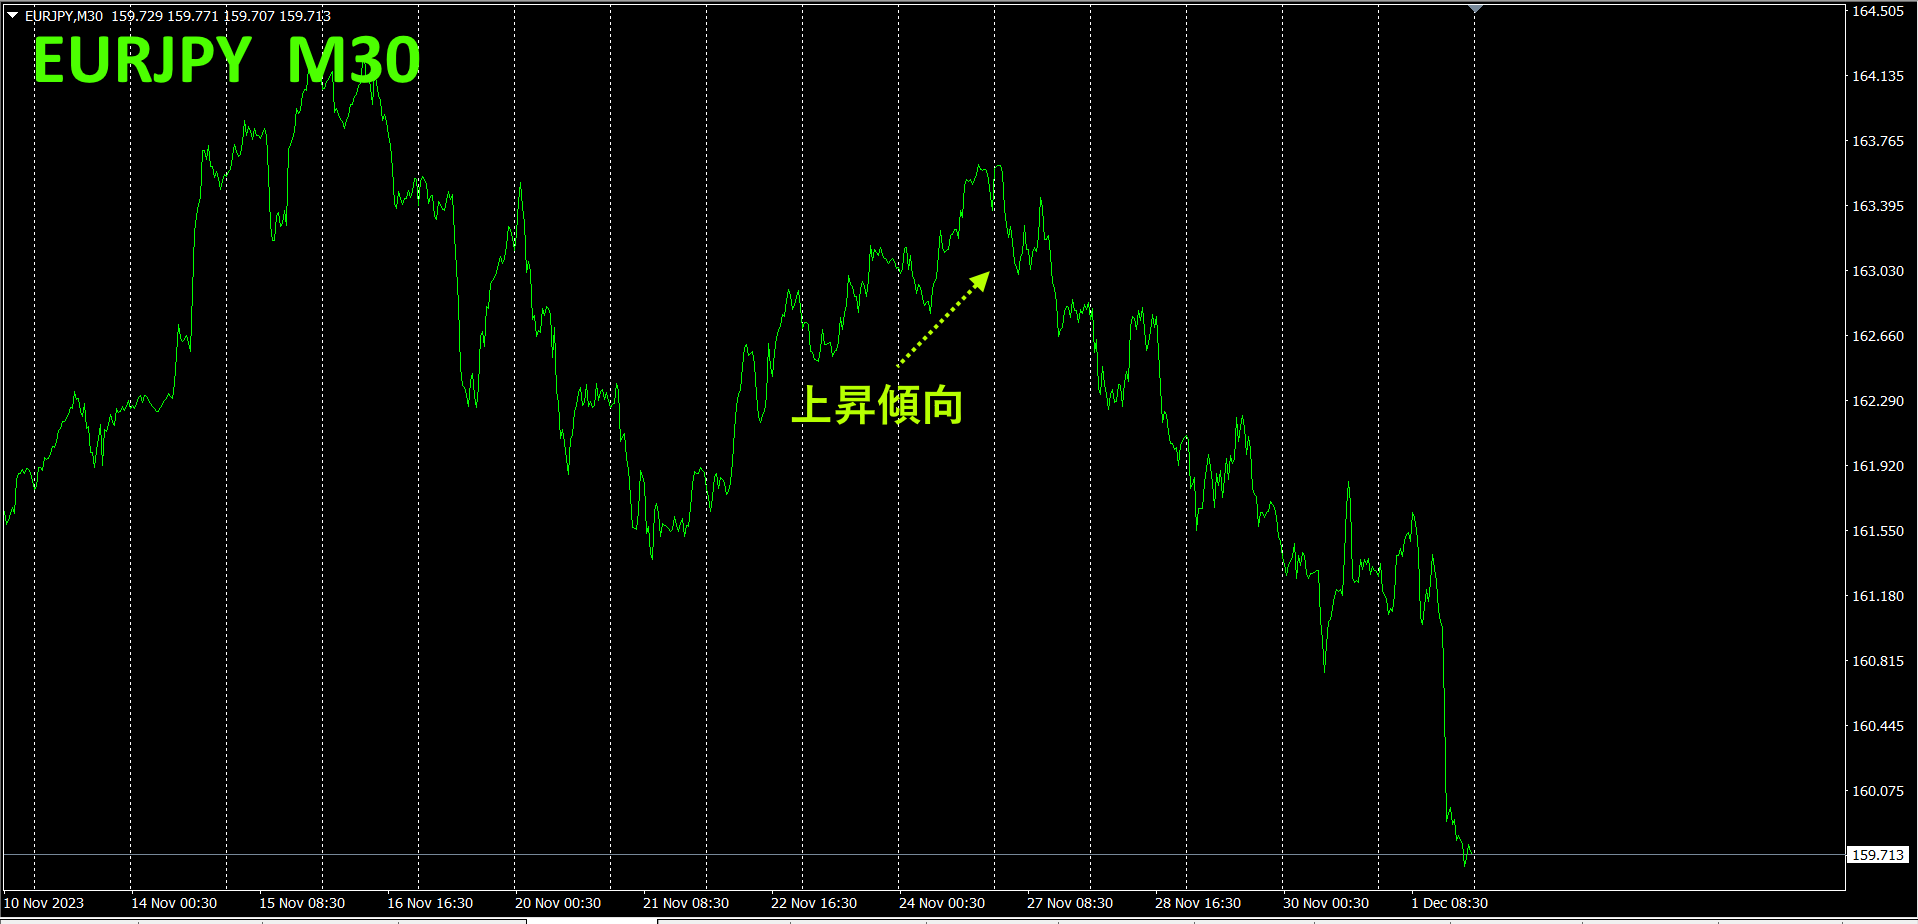
Last time, I thought it would rise, but it fell instead.
The 30-minute currency strength chart shows:
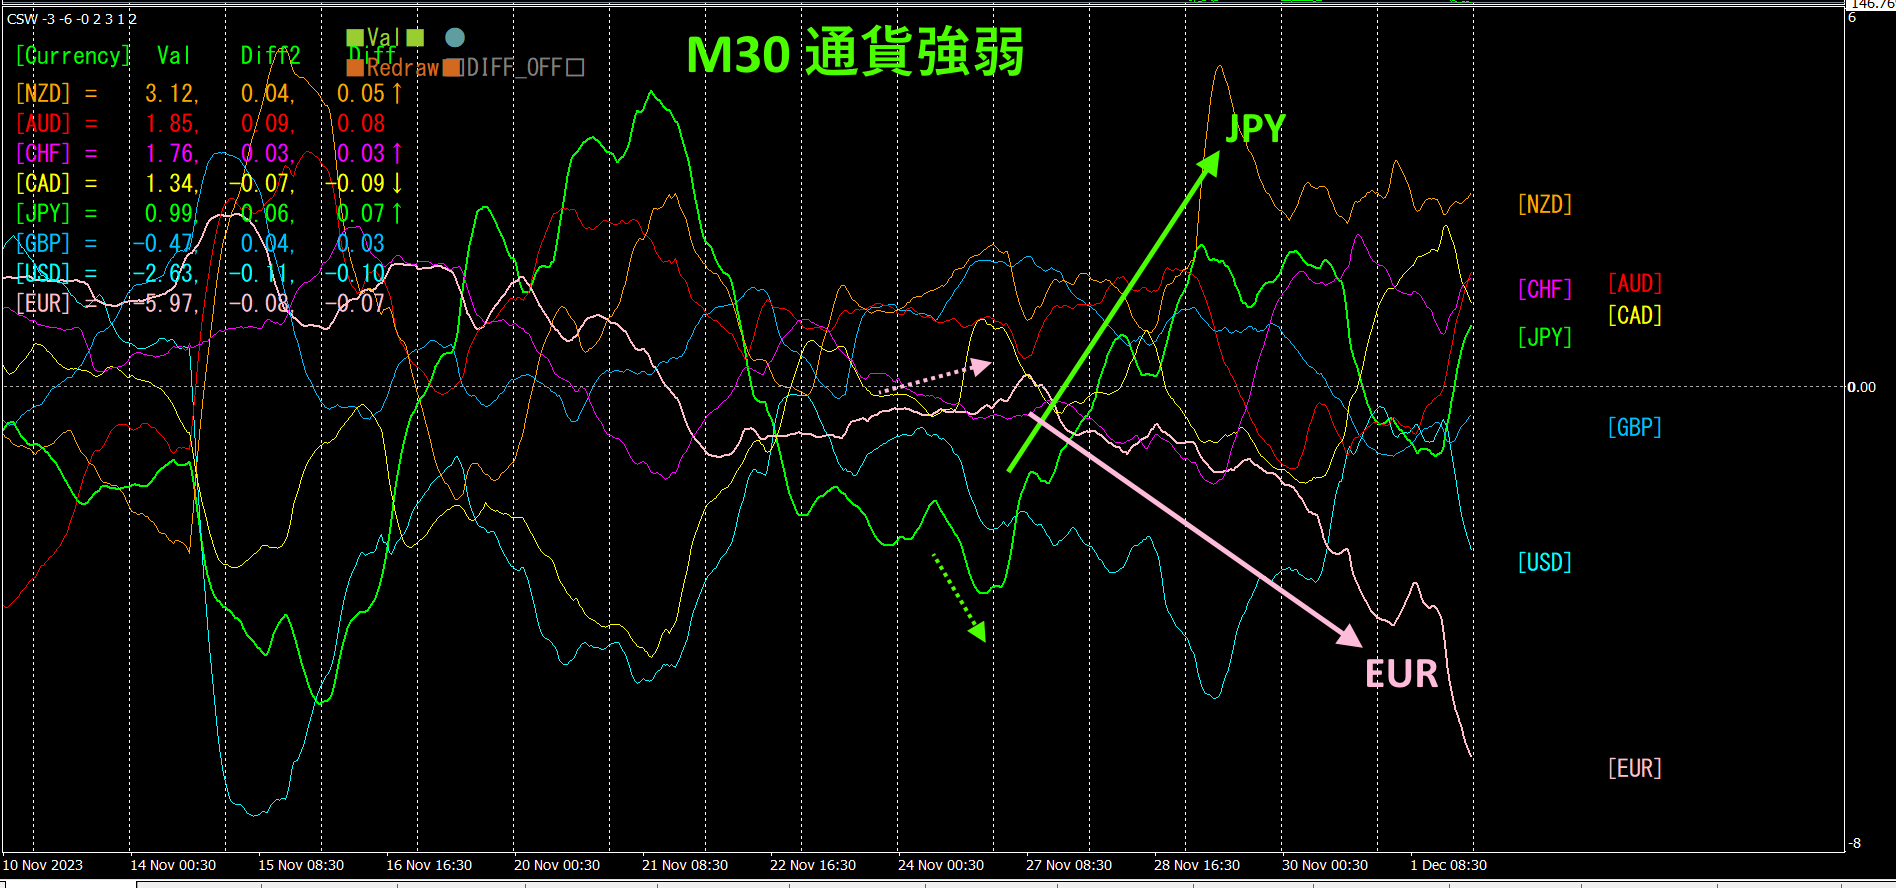
Pink isEUR, green isJPY. The previous direction (dashed arrow) fully reversed. EUR fell sharply while JPY rose, resulting in a large fall for EURJPY. If the currency strength chart's direction continues, EURJPY is expected to fall further. falls, and rises, so EURJPY容量 declines significantly. If the currency strength chart continues its direction, EURJPY is expected to decline further.
4. Find bottoms and tops across all currency pairs and build a trend strategy (target:NZDCHF).
Using the“Bottom/Top Search Indicator”, the currency pair positioned at the bottom was selected as NZDCHF. We aim for a rise from a bottom.
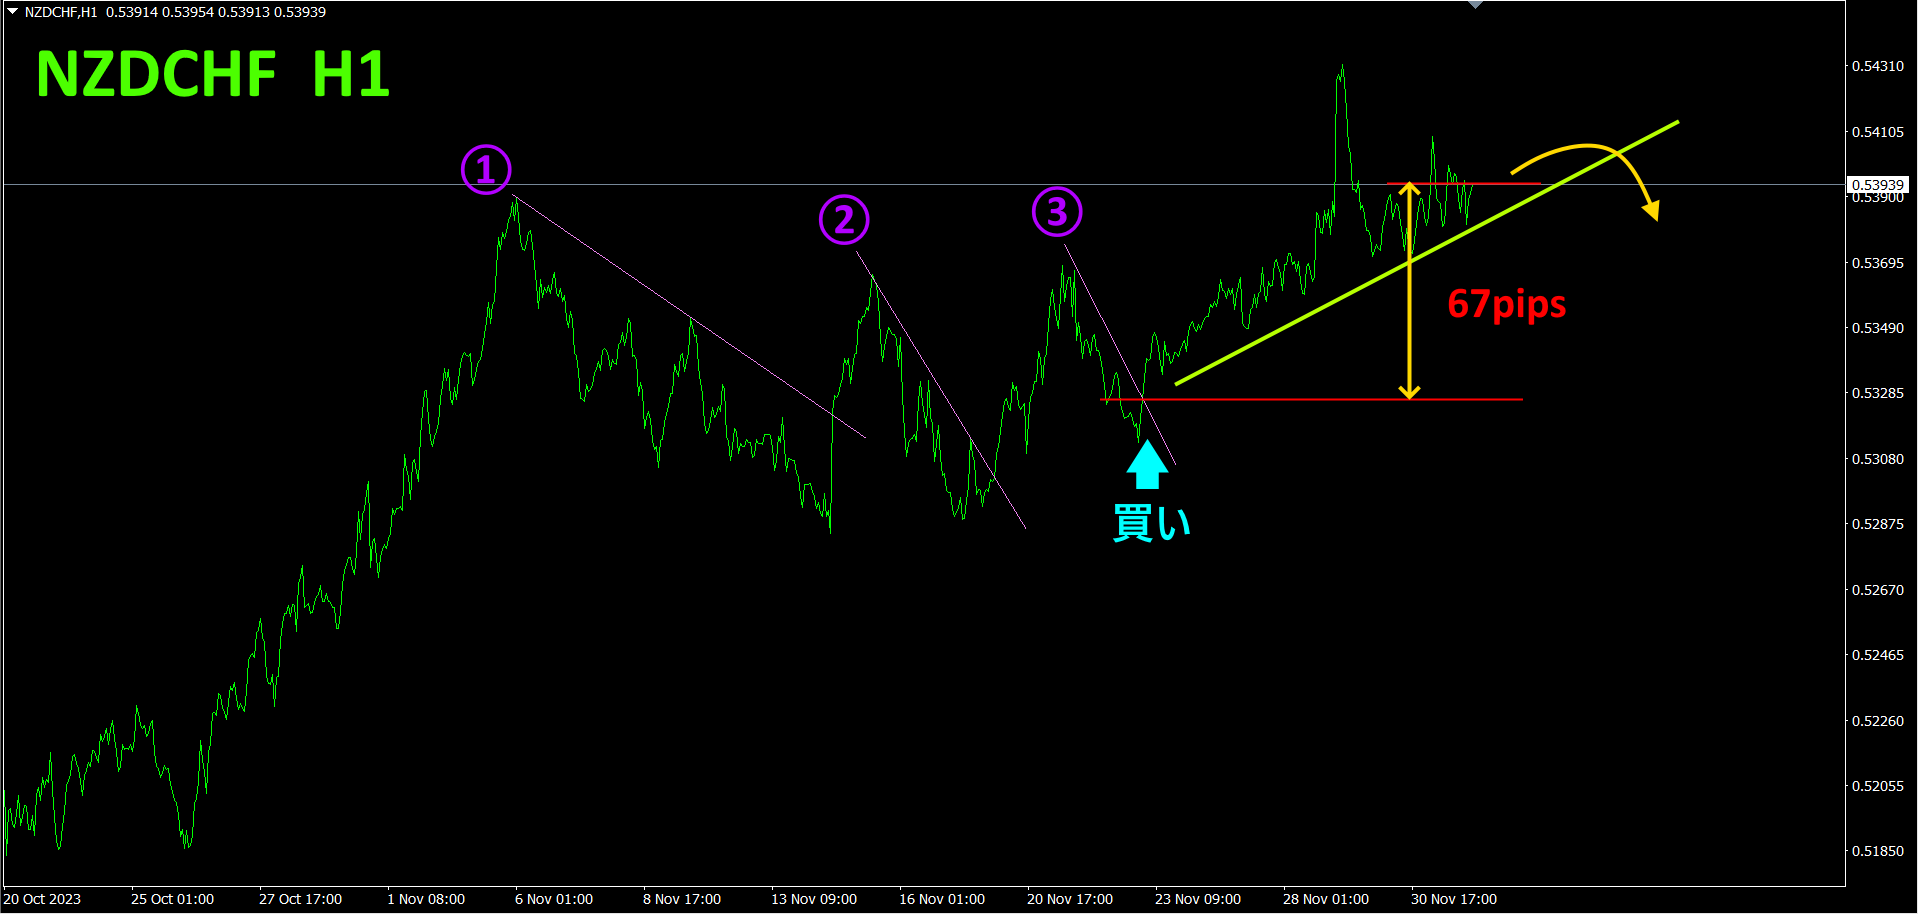
When lines ①, ②, ③ are broken upward, buy; when the rising trend line is broken, exit. So far, ① gained, ② gained, totaling in profit. Currently holding a long position with unrealized profit of. If the yellow arrow trend line is breached upward, exit. Focus on long positions and continue trading.
Refer to the 4-hour currency strength chart.
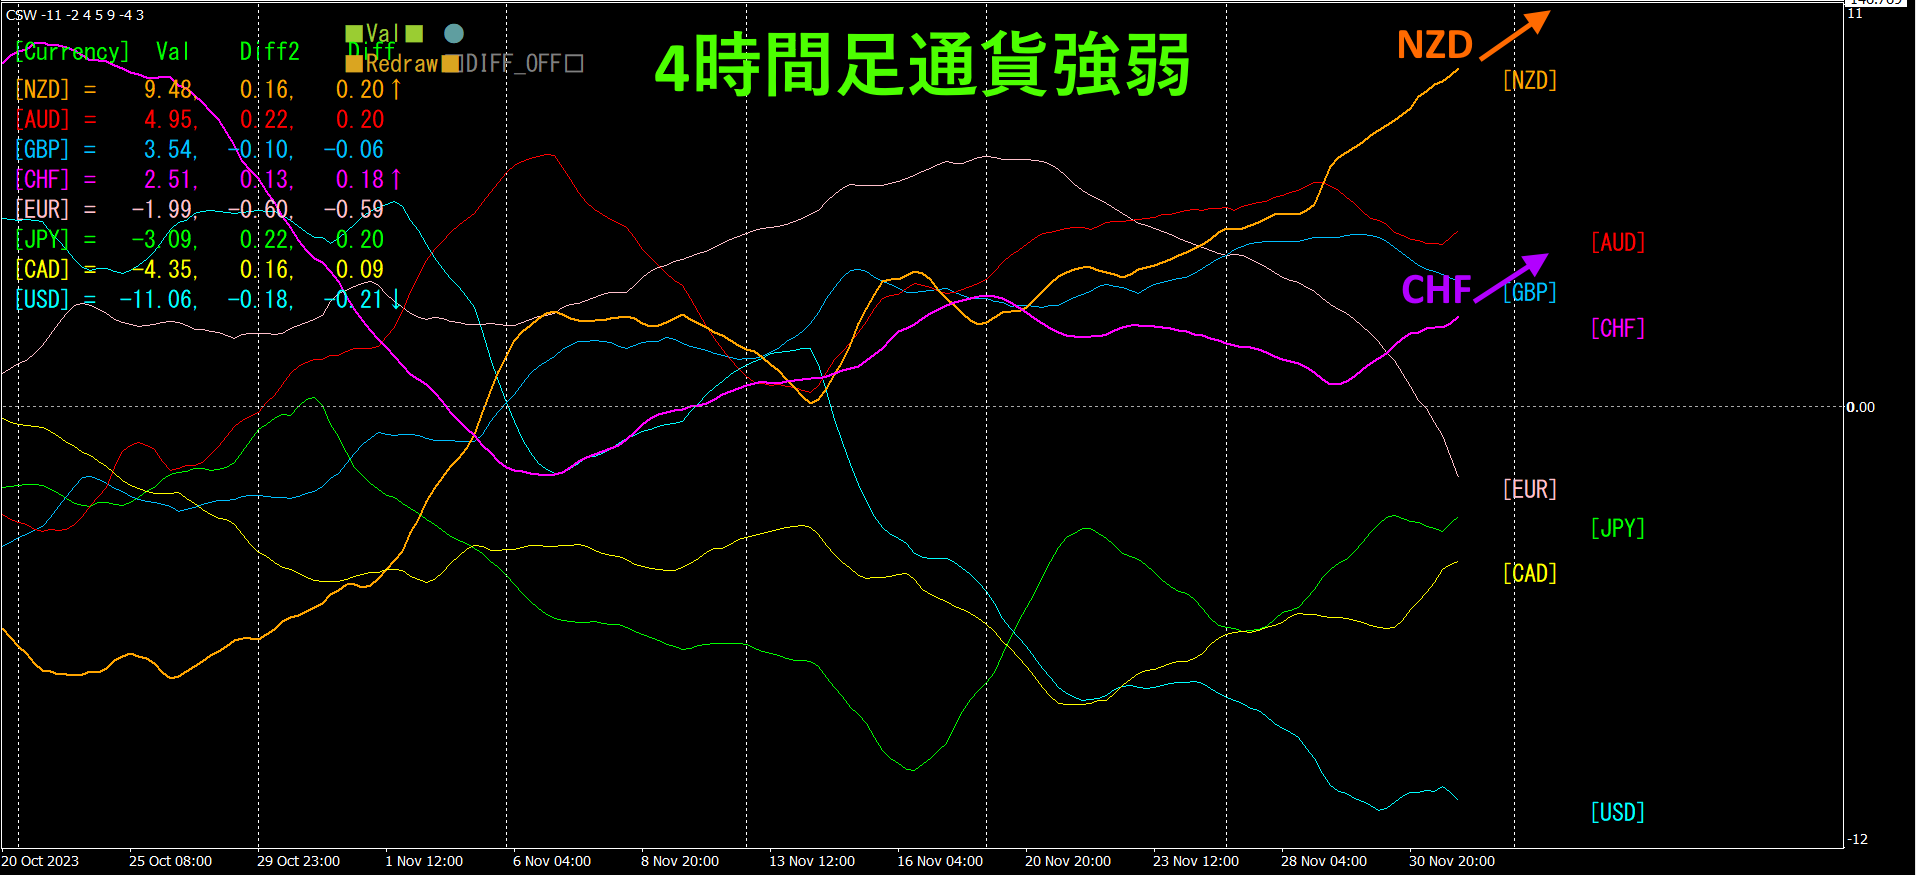
Red-purple isCHF, orange isNZD. and both move upward, but the upward trend for is stronger, so the rise of is expected to continue. Since you hold a long position, you can trade while enjoying increasing unrealized profits.
Semi-automaticEA provides “,” which draws a diagonal descending line and automatically buys when broken upward and automatically settles when the upward line is broken, enabling a hands-off trading approach.
※“”

https://www.gogojungle.co.jp/tools/indicators/42257
If you are interested in the8CCurrency Strength Visualization Indicator, please refer to the following page.
MT4 version https://www.gogojungle.co.jp/tools/indicators/39150
MT5 version https://www.gogojungle.co.jp/tools/indicators/39159
【My listed products】


