
If someone says "environment recognition and MTF analysis are impossible," just look at the daily chart's highs and lows.
If you start studying FX with the aim of winning, the phrases that almost always come up are "environment recognition" and "MTF analysis (multi-timeframe analysis).
In fact, it is the understanding of the long-term chart, such as environment recognition and MTF analysis, that
“you win by design”
“don’t enter areas where you’re likely to lose”
that you reach a state where you are effectively winning and minimizing losses.
However, no matter how important environment recognition and MTF analysis are said to be,
“which timeframe should you look at?”
“how do you determine uptrends or downtrends?”
“what combination of timeframes should you look at?”
These are questions and ambiguities that naturally arise.
For those who are in this “environment recognition refugee” or “MTF refugee,”
“if you don’t understand well, just draw horizontal lines at the daily high and low”
is the sound advice I’d like to give.
At minimum, for day trading and scalping-scale trades, simply drawing horizontal lines from the daily high and low and trading with them as a reference can be reasonably effective.
Since attempting to master all the complex environment recognition and MTF analyses at once is endless and time-consuming, first try this simple, straightforward trading using only the “daily high-low horizontal lines.”

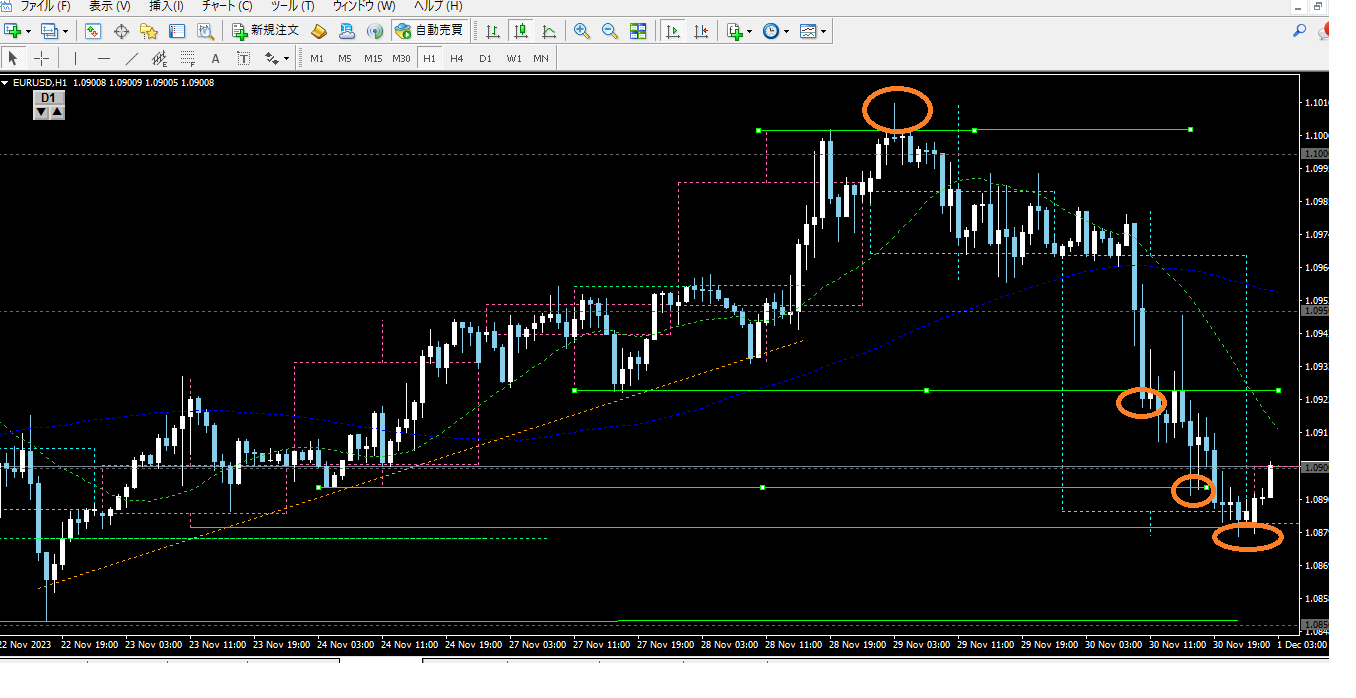
This is a one-hour EUR/USD chart, and when you draw the daily highs and lows as horizontal lines here, it looks like this.

I use an indicator that displays higher-timeframe candles on the chart; the pink and light blue dotted lines represent the daily candles, and these highs and lows correspond to the daily highs and lows exactly.
Now, drawing the daily highs and lows as horizontal lines in this way makes it clear that the chart reacts at those levels when it reaches them.

There is a pattern of testing beyond the horizontal line and then bouncing back.
Daily highs and lows often appear as breakouts in appearances, only to fail and reverse, causing such moves to occur.
That point can become the starting point of a trend reversal, or it may rebound slightly and then again test and break through. Reactions vary, but there is always some reaction.
For trend-following trades,
“how far will it extend?” “what profit target should you set?”
are always the questions. For now,
if you set the next daily high-low as your target and take profits there, even if it reverses afterward you can secure a reasonable profit.
Alternatively, if you miss the entry at a strong extension point and are late to pull the trigger, instead of jumping aboard“pull back to the next daily high-low and set up a contrarian entry”is another option.
Since this is a 1-hour chart, even in places that look like they end in an upper wick, it is entirely possible to capture a small rebound by watching the 5-minute or 15-minute charts.

Looking at the 15-minute chart, near the daily high-low horizontal lines, you can see price action like wicks or two-bar reversals showing a rebound. With this as a signal, a simple contrarian trade can still achieve a decent profit.
In this way, trading based on daily highs and lows sets a rough directional bias.
In particular, having “contrarian” as an option is a fairly big advantage.
Because having that option acts as a deterrent and a stopper against “catching a breakout too late.”
Even if you miss the move, calmly accepting it and preparing the next “second signal” brings psychological ease.
Humans tend to feel they must trade at least once a day and end up making too-strong trades.
In many cases, the late comers who try to jump on after a trend has already started fit this pattern, but“pull back to the next daily high-low and wait for a contrarian setup”is much safer for winning.
If you so desired, you could relentlessly pursue only this approach of waiting to pull back to the daily high-low and contrarian setup, and you would still accumulate a respectable number of pips over the week or month.
With this, there is no need for complex environment recognition or MTF analysis.
By the way, a paid method specializing in daily-high-low contrarian trading is available for purchase.
A portion of this daily-high-low contrarian method is publicly available as a free blog article, so I would be glad if you also take a look there.