

If you are seeking the 「Holy Grail」, the chart pattern’s “false signal” is the best option.
Chart patterns such as double tops, double bottoms, and flags are easy to grasp among trading methods, sothe ultimate method tends to be treated as a "holy grail," but in reality entries based on them do not win that often.
“A double top appeared while price was rising, so a break of the neck line signals a reversal to a downtrend.”
“A flag appeared, so the trend will continue.”
Many people end up making entries in such rigid, rule-based ways and losing, don’t they?
These chart patterns can appear in many places, so you end up being able to enter here, there, and everywhere.
However, in practice these chart patterns“only have meaning at the critical points”when you use them.
When you find yourself in such a situation,
“Let's look for a shape that conforms more precisely to the definition of a double top.”
“Let's study the form that makes flags reliably effective.”
Many people think this, but if you overdo it you can end up stuck in a quagmire
“A trader who only has knowledge and is head-heavy but ends up not winning.”
to become.
For example, among people I have advised on trading methods
“Define a range as stopping at two points or more at the same level, and it should bounce once in the opposite direction.”
There were people who tried to force textbook definitions and rules rigidly.
A range is basically just a rough notion of “not moving much,” which is fine.
After all, the market moves through real human interactions, so focusing on reading the other side’s psychology leads to a true understanding of the market.
If you are seeking “textbook methods” or a “holy grail,” I think you should instead focus on trading when
“the chart pattern proves to be a false signal.”
and trade with that in mind.
There are always a certain number of people who trade in textbook fashion with these chart patterns, so when they turn into false signals, the stop losses pile up and the asset often resumes rising plainly.
If you look at the actual market, you’ll see there are countless false signals from chart patterns.
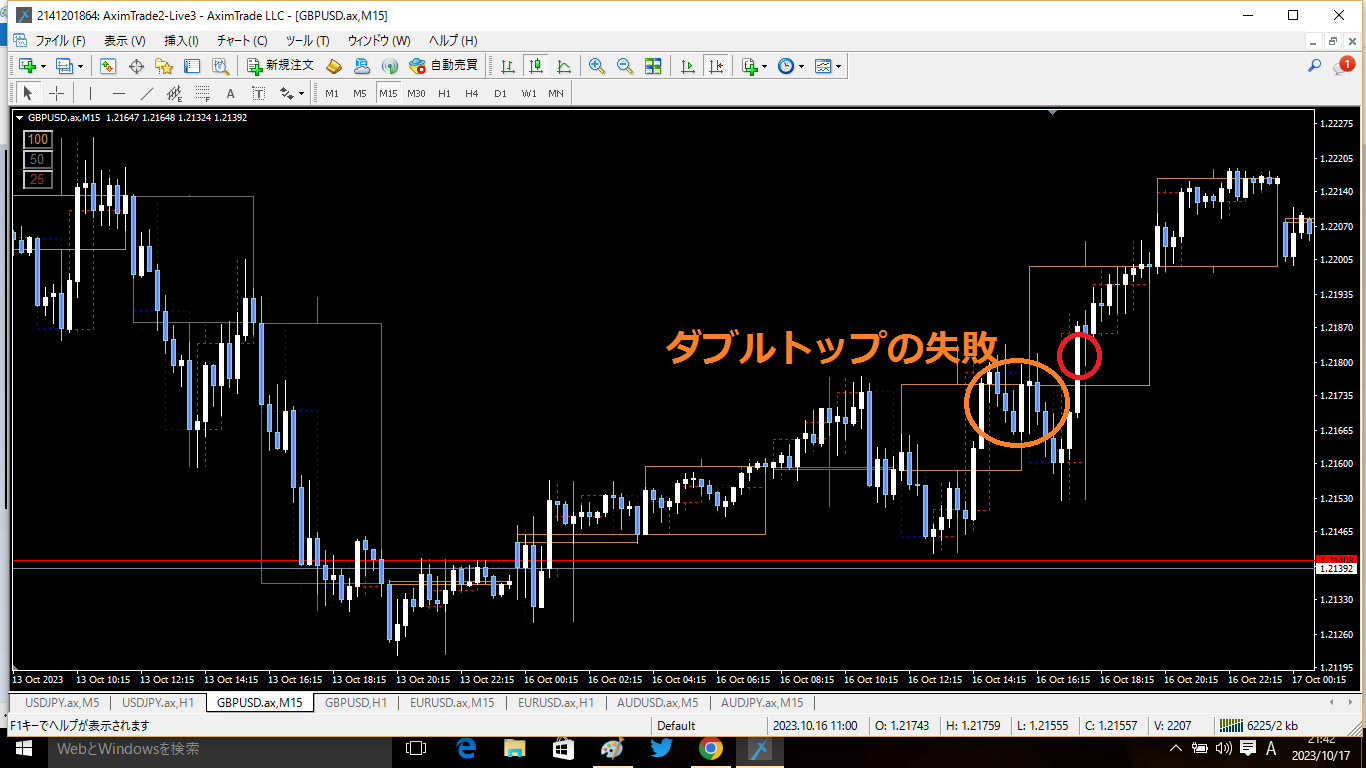
For example, a false signal for a “double top” looks like this.
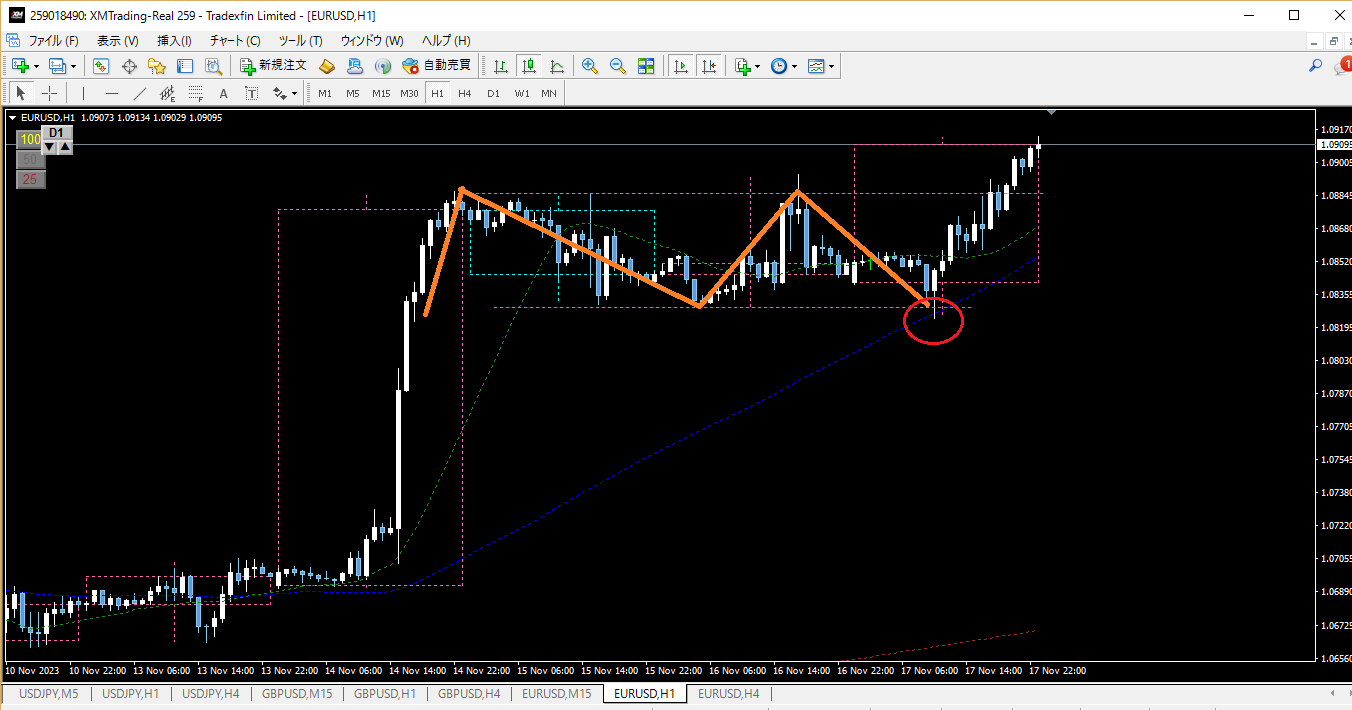
A false signal that occurs from a double top neck line during an uptrend leads to continued rise
A double top that becomes a false signal at a pullback selling point reverses and rises
Near the neck line of a double top formed at a pullback candidate, a double bottom forms, and the double top loses the contest and becomes a false signal and rises
There are many patterns, but the point where the double top becomes a false signal is where a sharp rise occurs. That means the selling forces based on the double top had to retreat due to stop losses, becoming a starting point for a big upside move.
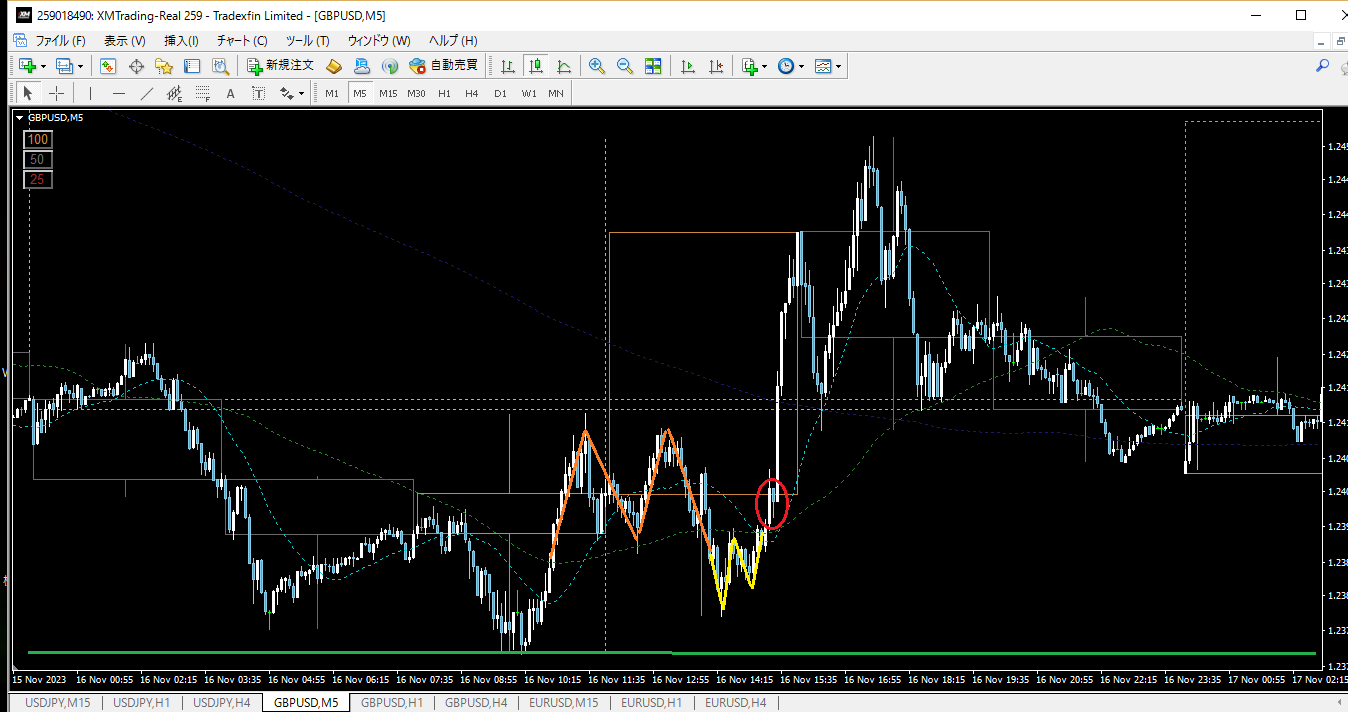
Or a false signal of a flag looks like this.
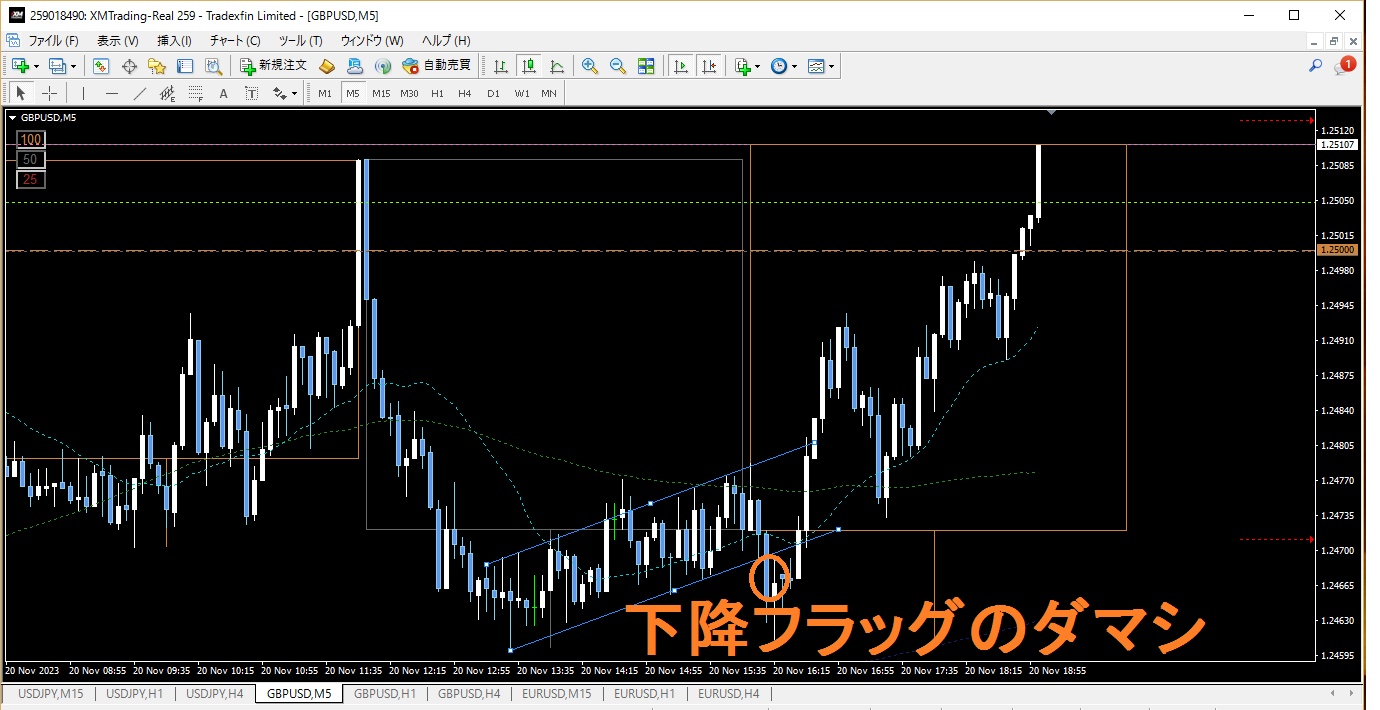
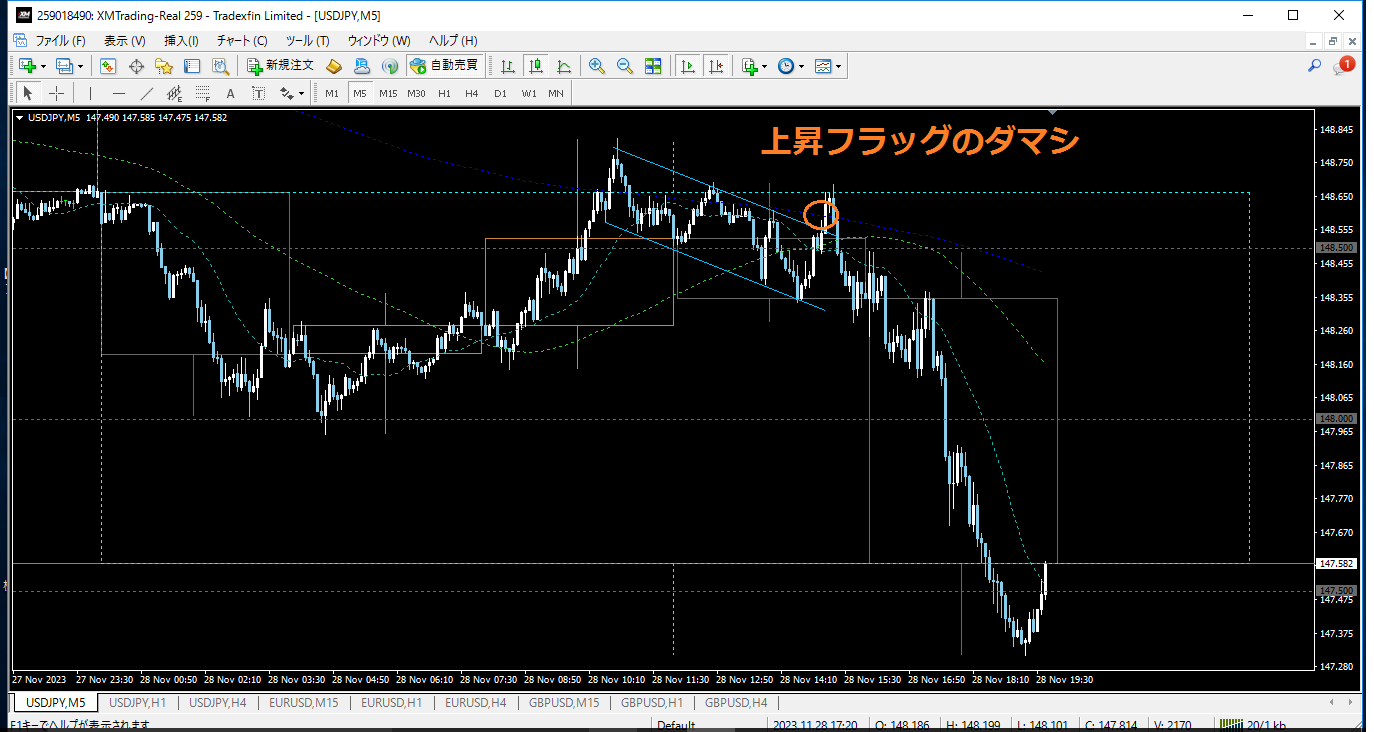
This is essentially the same as the false signal of the double top,“The flag will continue the trend!” and the panic selling to avoid losses fuels a rapid move in the opposite direction.
Looking at it this way, chart patterns are easier to use in reverse (counter-trend) moves when exploiting false signals.
At the very least, if you use chart patterns honestly in a “follow the trend” way, you’ll need to develop a genuine market sense, which takes time, whereasusing false signals to trade in a “counter-trend” can help you master winning patterns with less effort.
And, among false signalsthe simplest and most understandable is the “horizontal line breakout” false signal false signal.
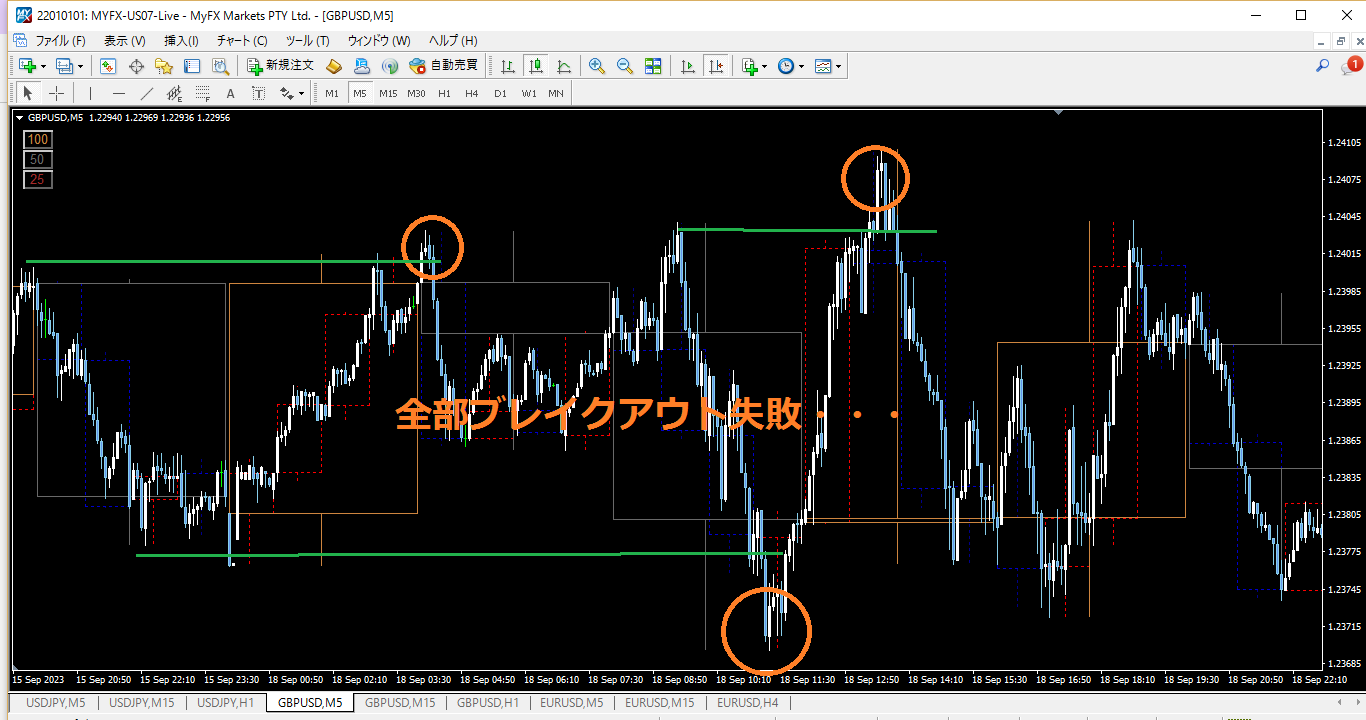
After all, breakouts of horizontal lines themselves tend to end up as false signals, so taking the opposite side can be a fairly rational strategy.
Among these false signals, the simplestspecialized on the false signal of “horizontal line breakout” is offered to beginners as a paid product.
https://www.gogojungle.co.jp/tools/ebooks/475001. Draw a reference horizontal line2. Pull back to the line and enter under certain conditionsThis is simple, but even though it is simple, it becomes one of“patterns that are easy to win,” “templates,” “holy grails”.This part also mentions concrete entry methods for the first double top neck line false signal.This
1. Draw a reference horizontal line
2. Pull back to the line and enter under certain conditions
This is simple, but even though it is simple, it becomes one of“patterns that are easy to win,” “templates,” “holy grails”.
This part also mentions concrete entry methods for the first double top neck line false signal.
Thispaid book is partially published for free, so please refer to it.
→https://www.gogojungle.co.jp/finance/navi/articles/62755
For false signal entries using flags,a separate paid book focused on “buying on dips and selling on rallies”provides a detailed explanation.
This also thoroughly explains how to use false signals in other entry methods, with a focus on core methods for “true doubles tops and doubles bottoms,” and is more oriented toward intermediate traders.
Please consider it as well.