

[November 25, 2023] Chart considerations using the Sky and Earth indicators
This is a chart analysis covering a total of 8 currency pairs (USD/JPY, EUR/USD, AUD/NZD, Gold, USD/JPY Kanji? (likely US Dollar/Japanese Yen Kanji), CAD/CHF? Actually "オジカナ" likely OZJ Kana? Sorry) and others: USDJPY, EURUSD, AUDNZD, Gold, USDJPY, CADFR? CAD/JPY? It seems list includes USDJPY, EURUSD, AUDNZD, Gold, USD/CAD, CAD Franc, EUR/CAD, NZD/CAD.
Table of Contents

・This article uses「Heaven and Earth Indicator」 for chart analysis and backtesting as the main content.
・This tool is structured around using the most accurate method「15-minute chart + 4-hour chart simultaneous monitoring method」 as a premise.
・This tool is a groundbreaking trading tool that can be used without understanding conventional FX theories (Elliott Wave, Dow Theory, Gannon’s Law, cycle theory, price action, Fibonacci, support/resistance, channels, etc.).

Heaven and Earth Indicator is a trading method using an original indicator I developed, released in February 2022.
Thanks to everyone's support, we received「GogoJungle Award 2022」.
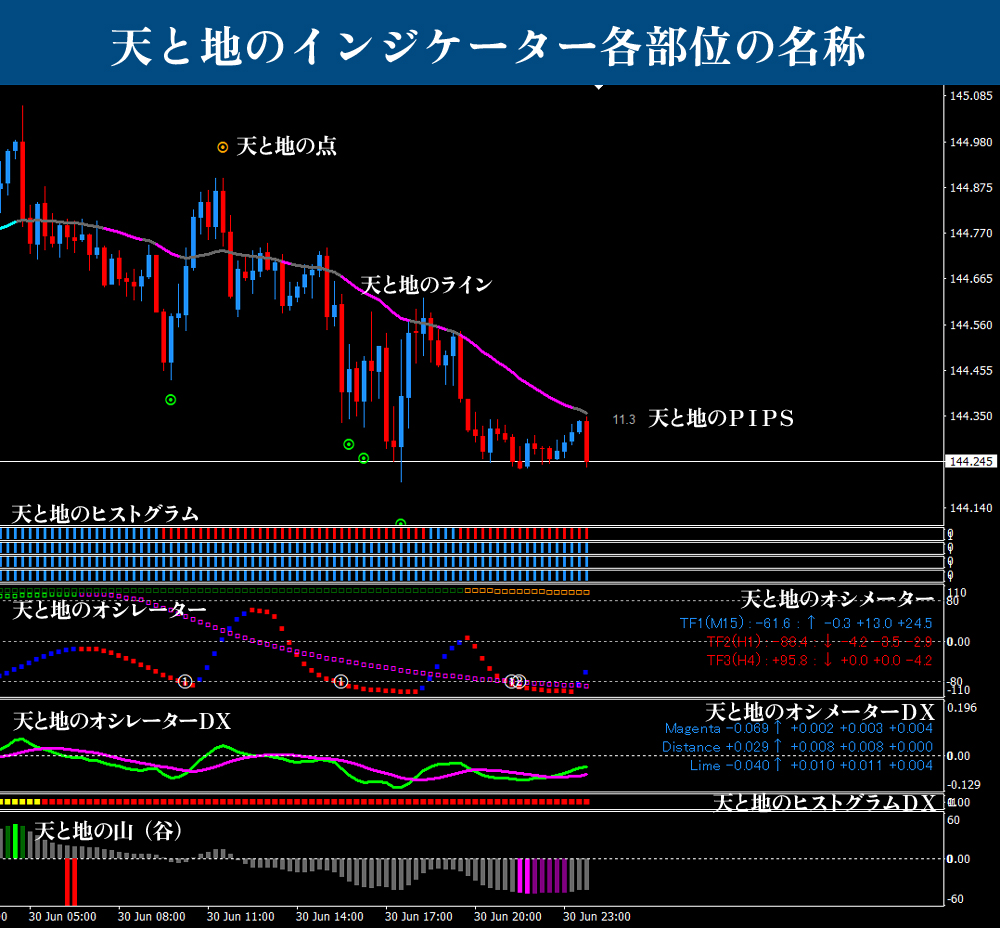
■ Heaven and Earth Indicator
https://www.gogojungle.co.jp/tools/indicators/35780
■ Heaven and Earth Mountain
https://www.gogojungle.co.jp/tools/indicators/37744
■ Heaven and Earth EA ~ Semi-discretionary Auto Trading System ~
https://www.gogojungle.co.jp/tools/indicators/43213
■ Heaven and Earth Dashboard
https://www.gogojungle.co.jp/tools/indicators/46257
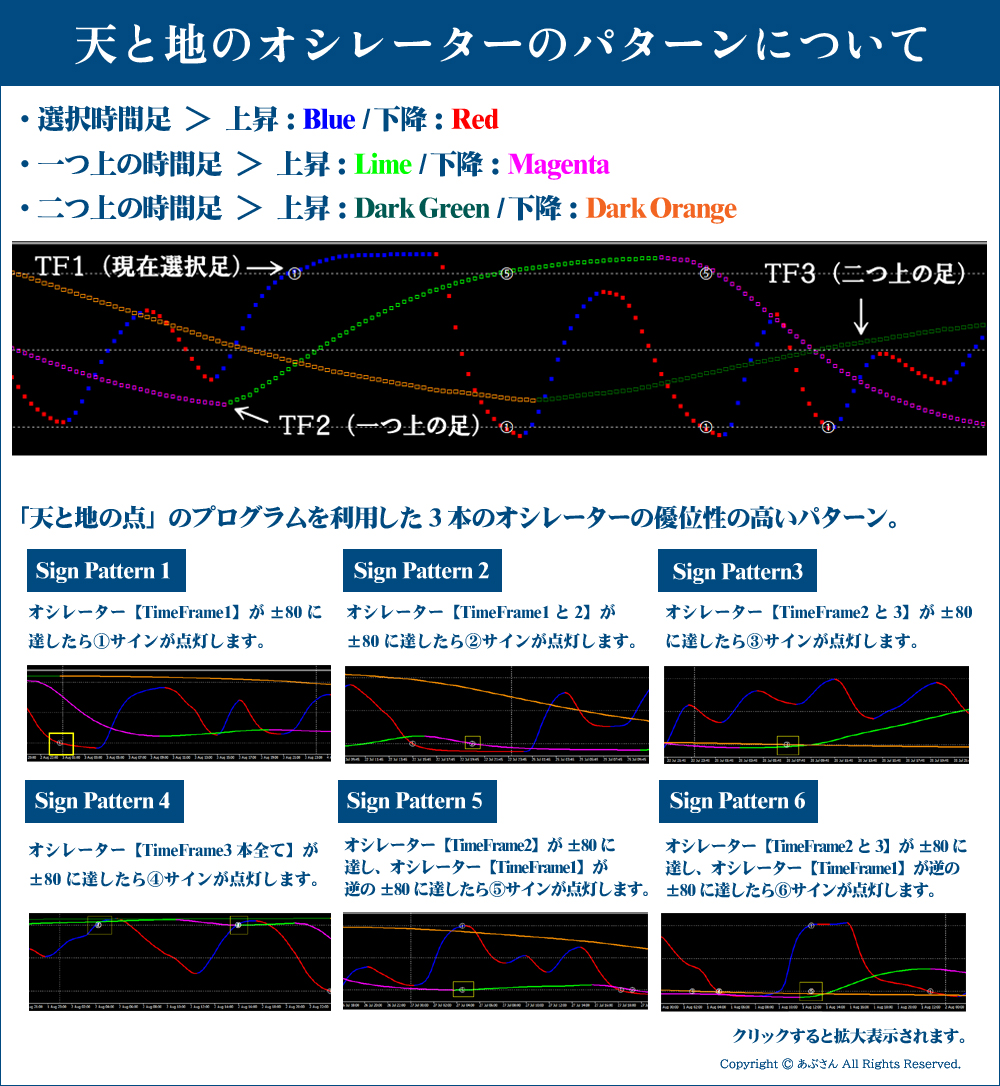
※ Please refer to the glossary terms used in this blog in the sections below: the names of the components of Heaven and Earth Indicator and the patterns of Heaven and Earth Oscillator. If you have any questions, please refer to the Heaven and Earth Indicator sales page; you should be able to figure it out. Users should have no trouble after reading the manual.Additionally, if you have any questions, please refer to the Heaven and Earth Indicator sales page.If you already are a user, the manual should suffice.
Now, let's move on to the analysis.
Thank you in advance!
※ All images can be enlarged by clicking.

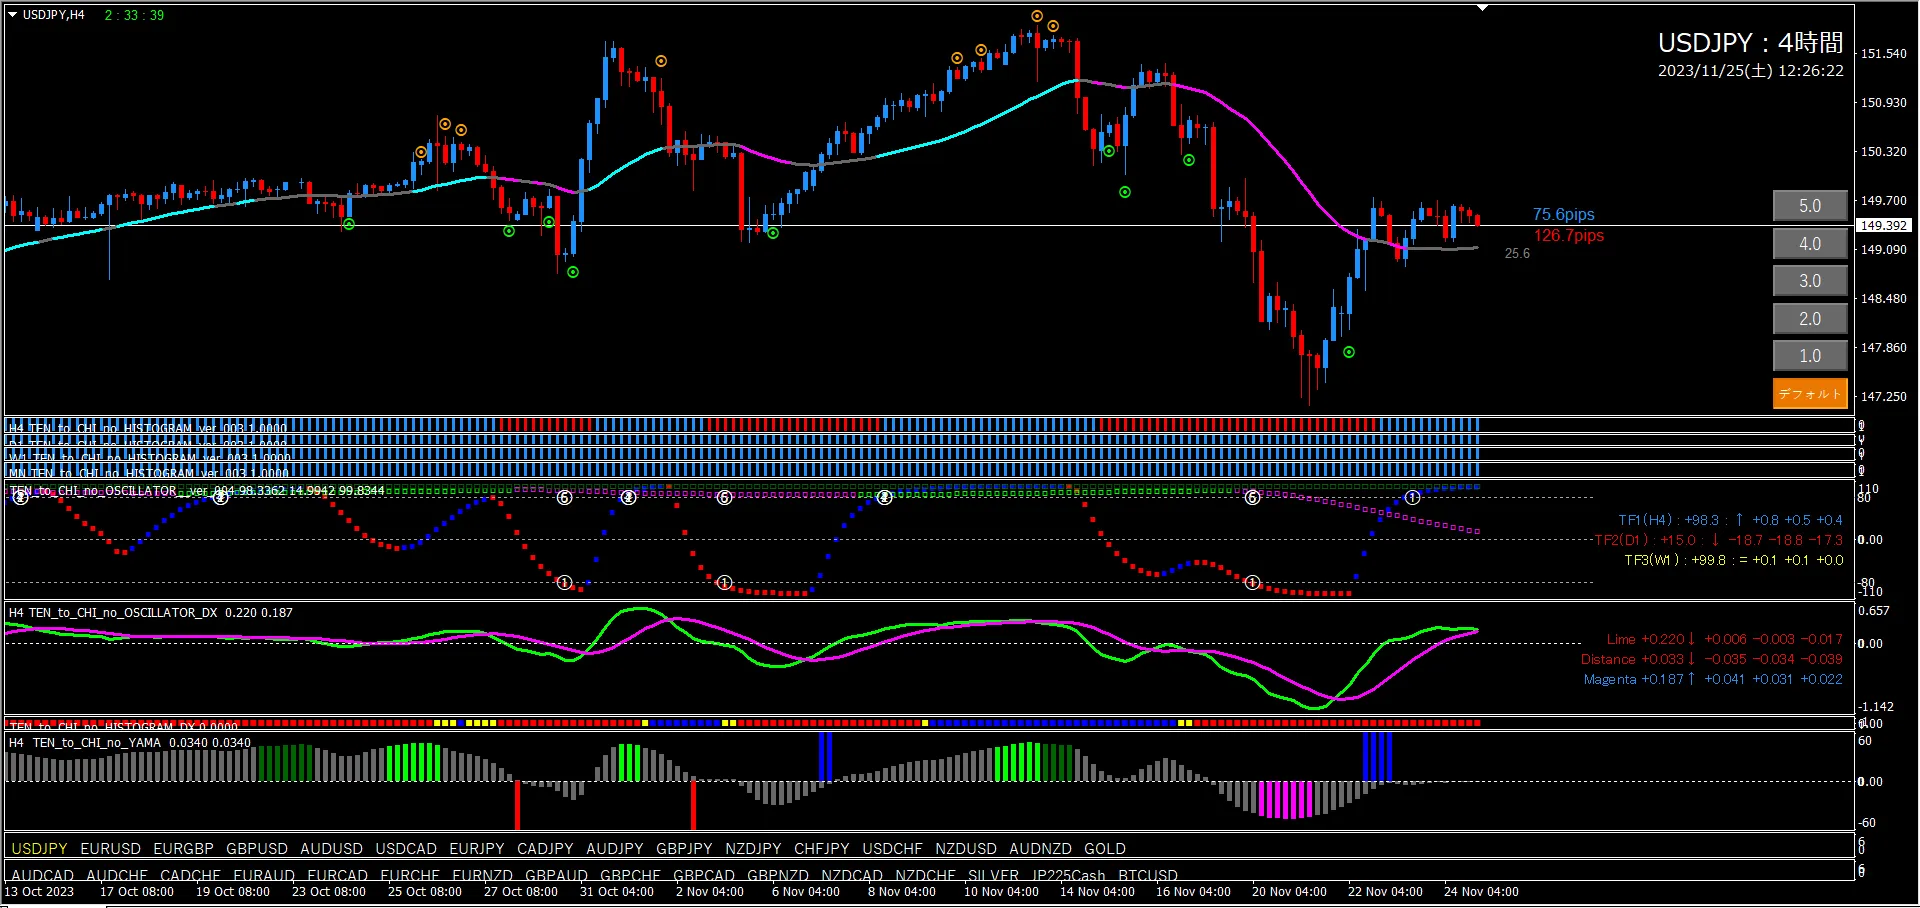
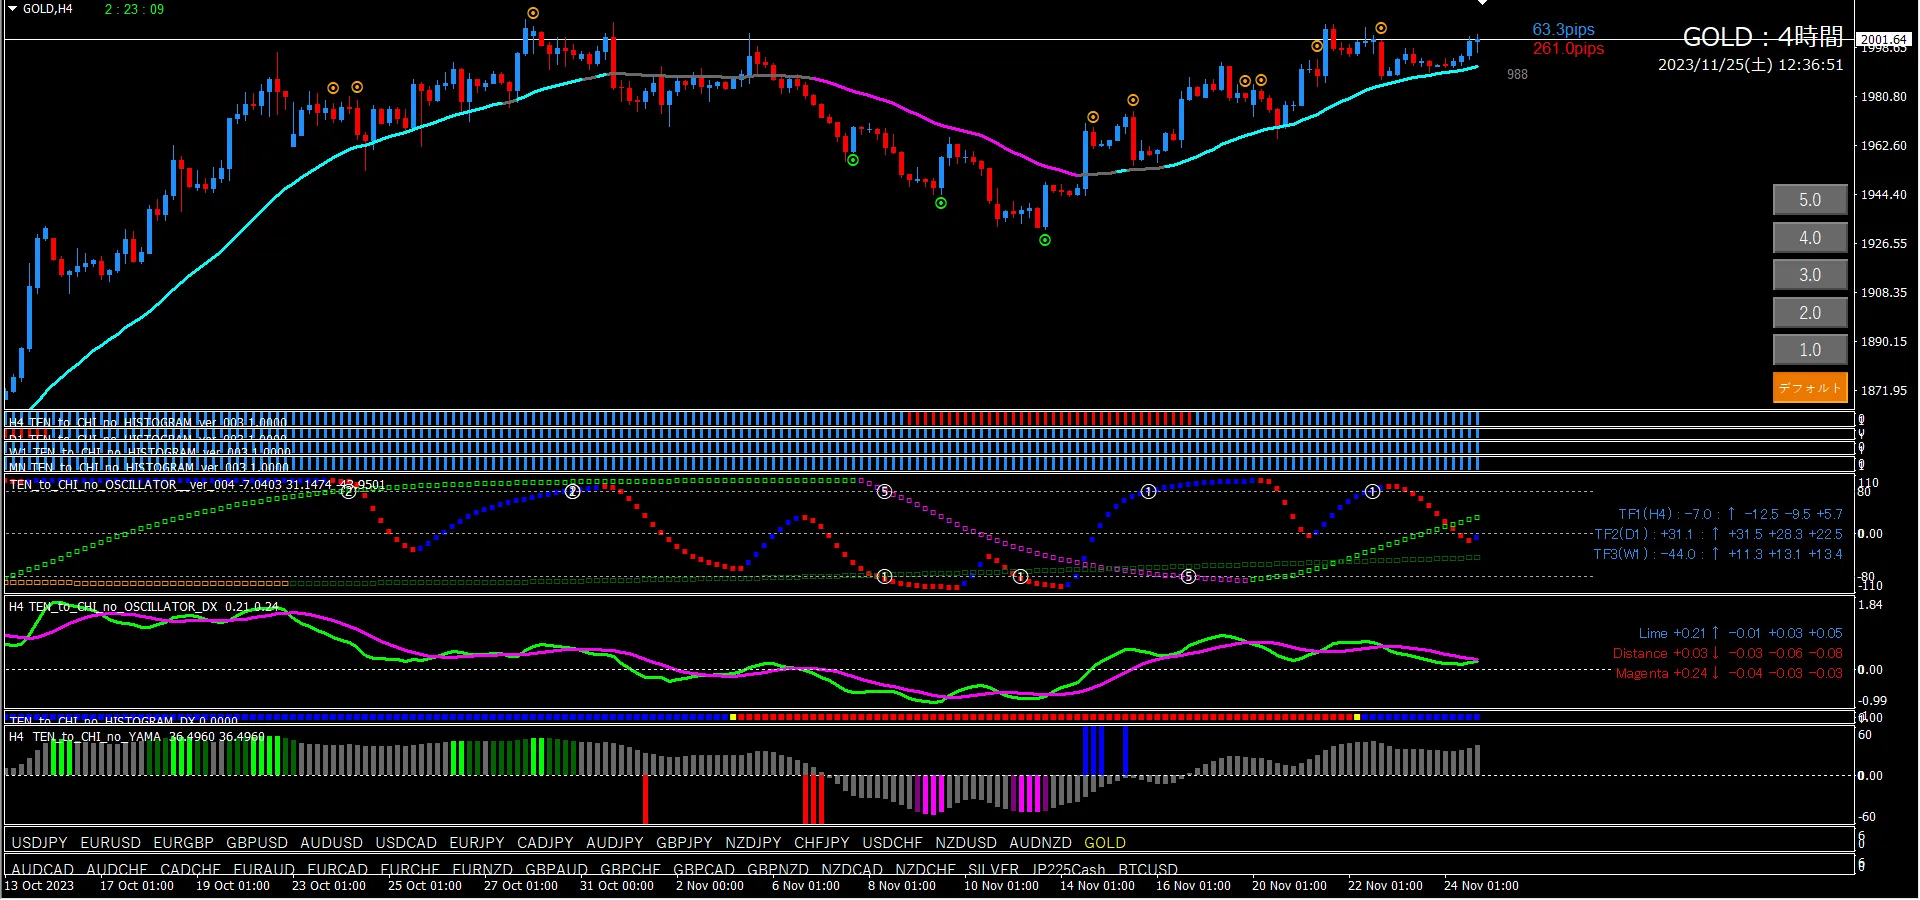
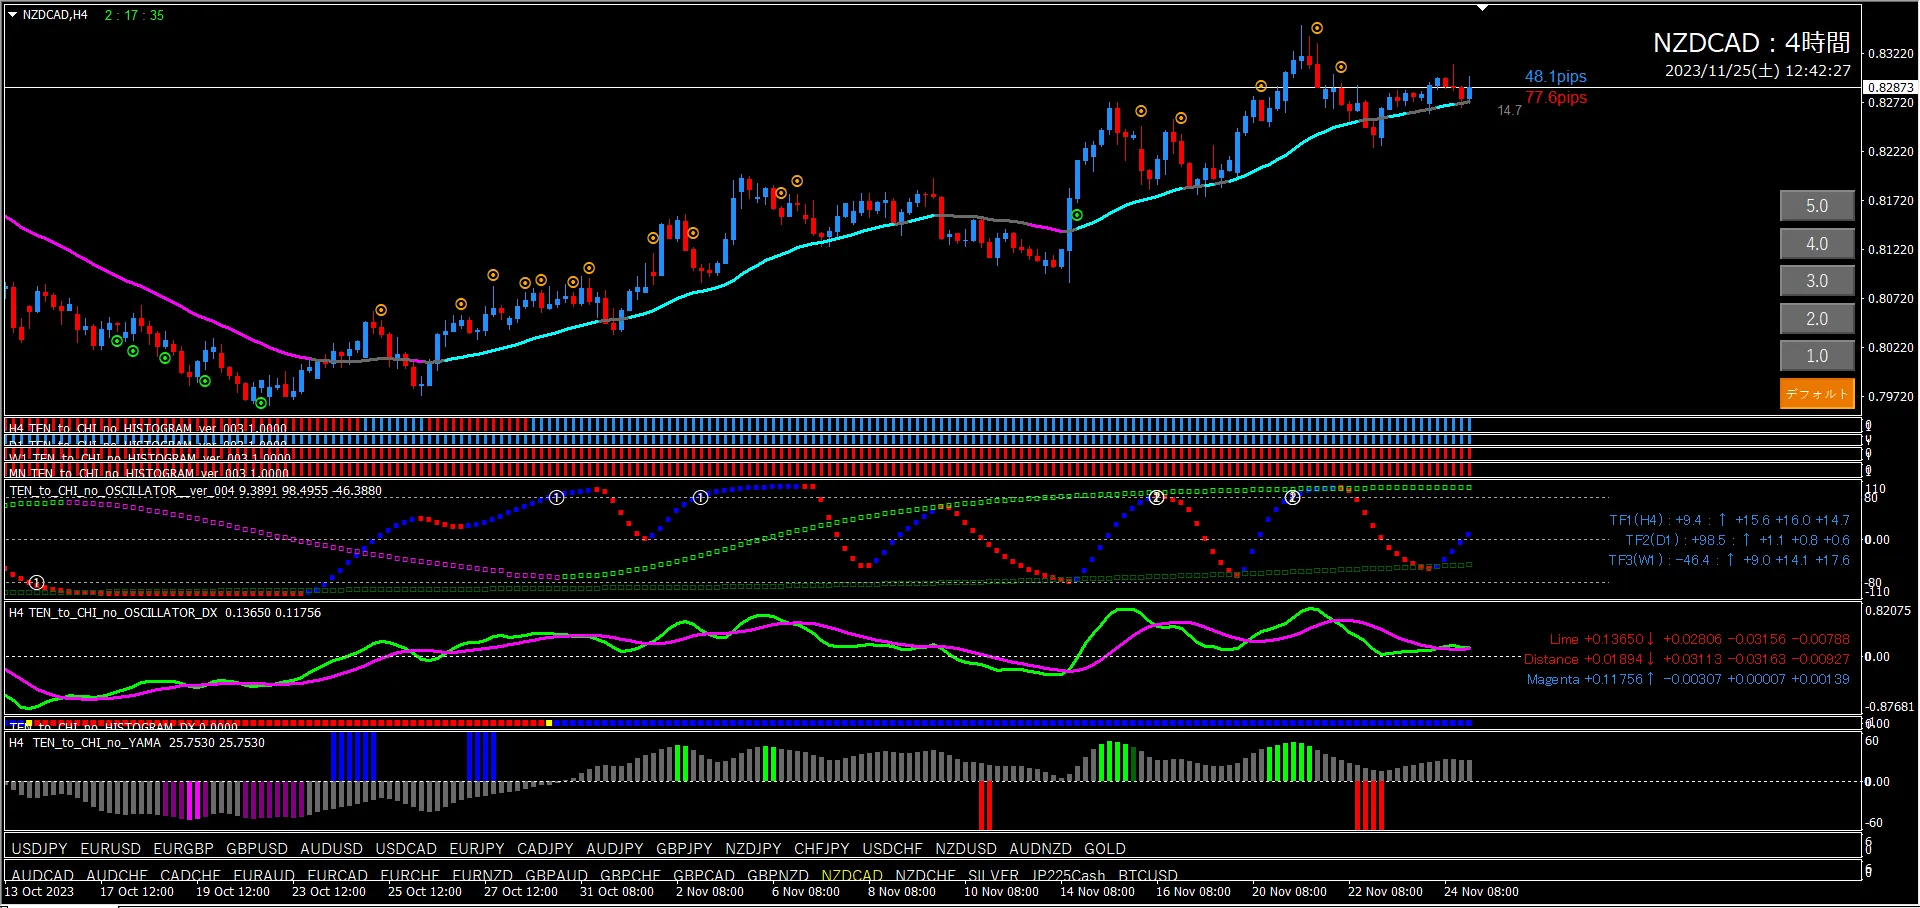
■ 4-hour (environment recognition)
First, look at the Oscillator TF2, which is falling from above +80. TF1 has also reached +80. Oscillator DX is about to have a downward cross. If a short-entry signal appears, it would be an ideal down-side view, but until a short-entry signal appears, expect at least about 75.6 pips (predicted by Heaven and Earth PIPS FUTURE). It would be best to wait for a retraction, but since this may take a long time, we will adopt a scenario where we only consider a down-side view once Oscillator DX clearly crosses downward. An upward turn in Oscillator TF2 or a new upward cross in Oscillator DX would reset the down-side view.
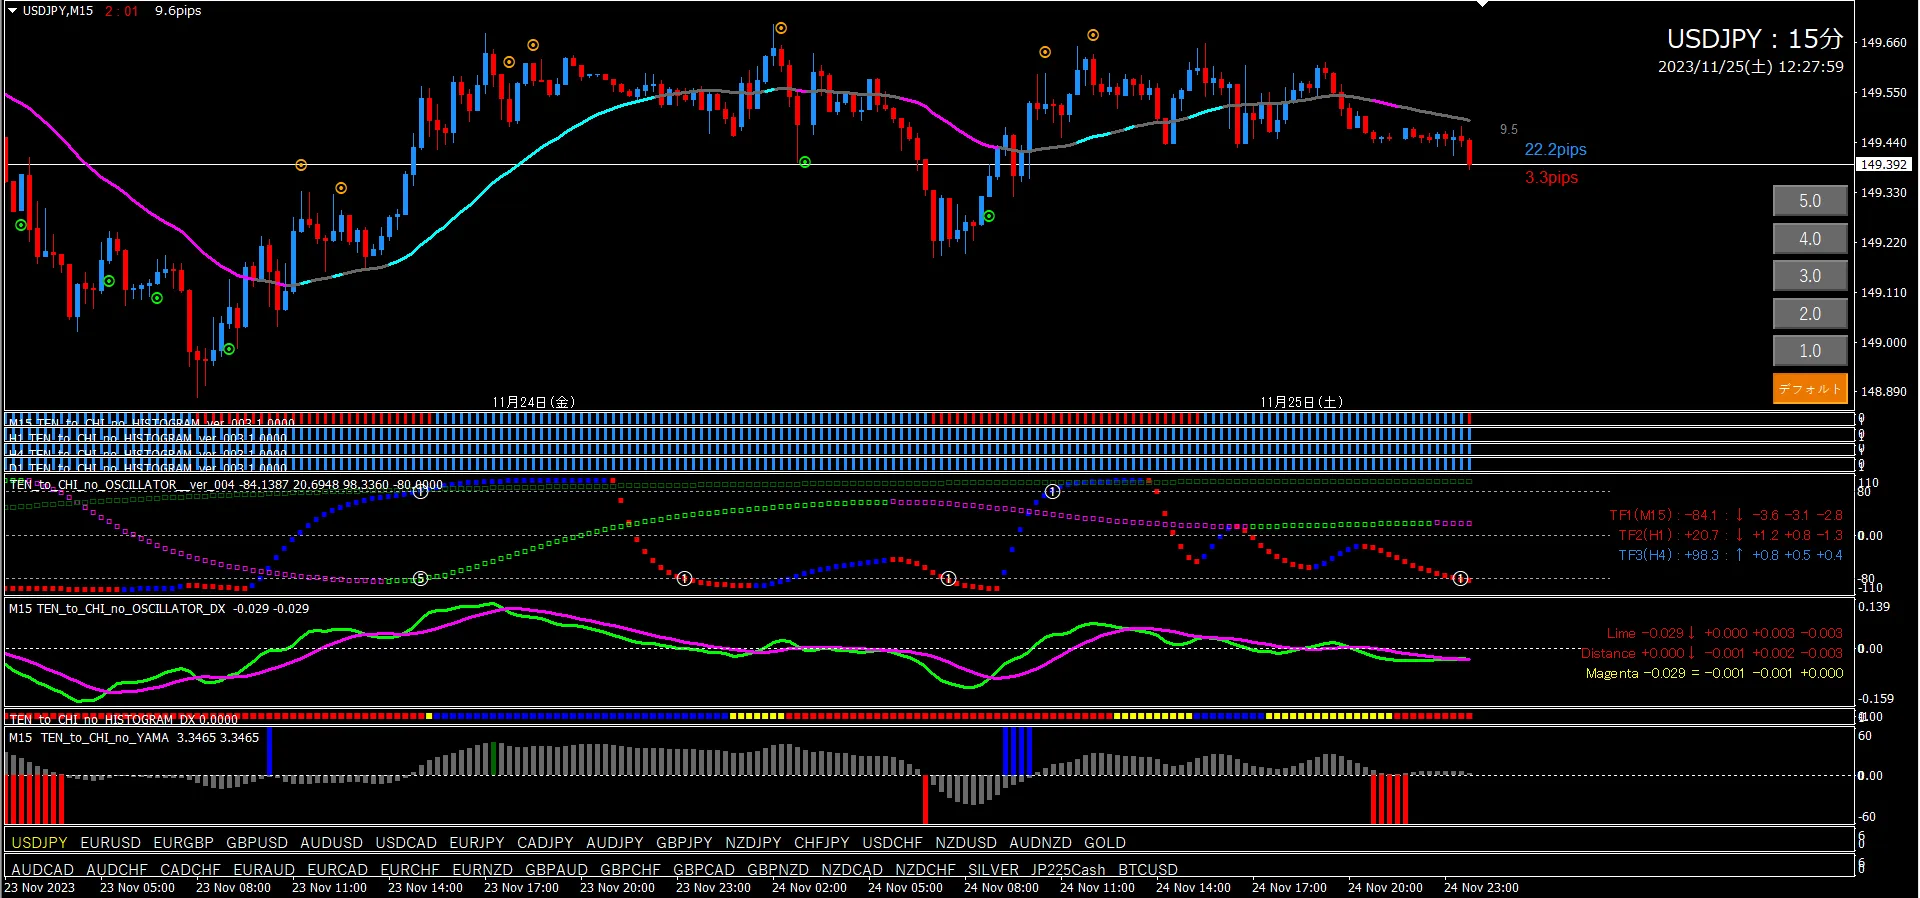
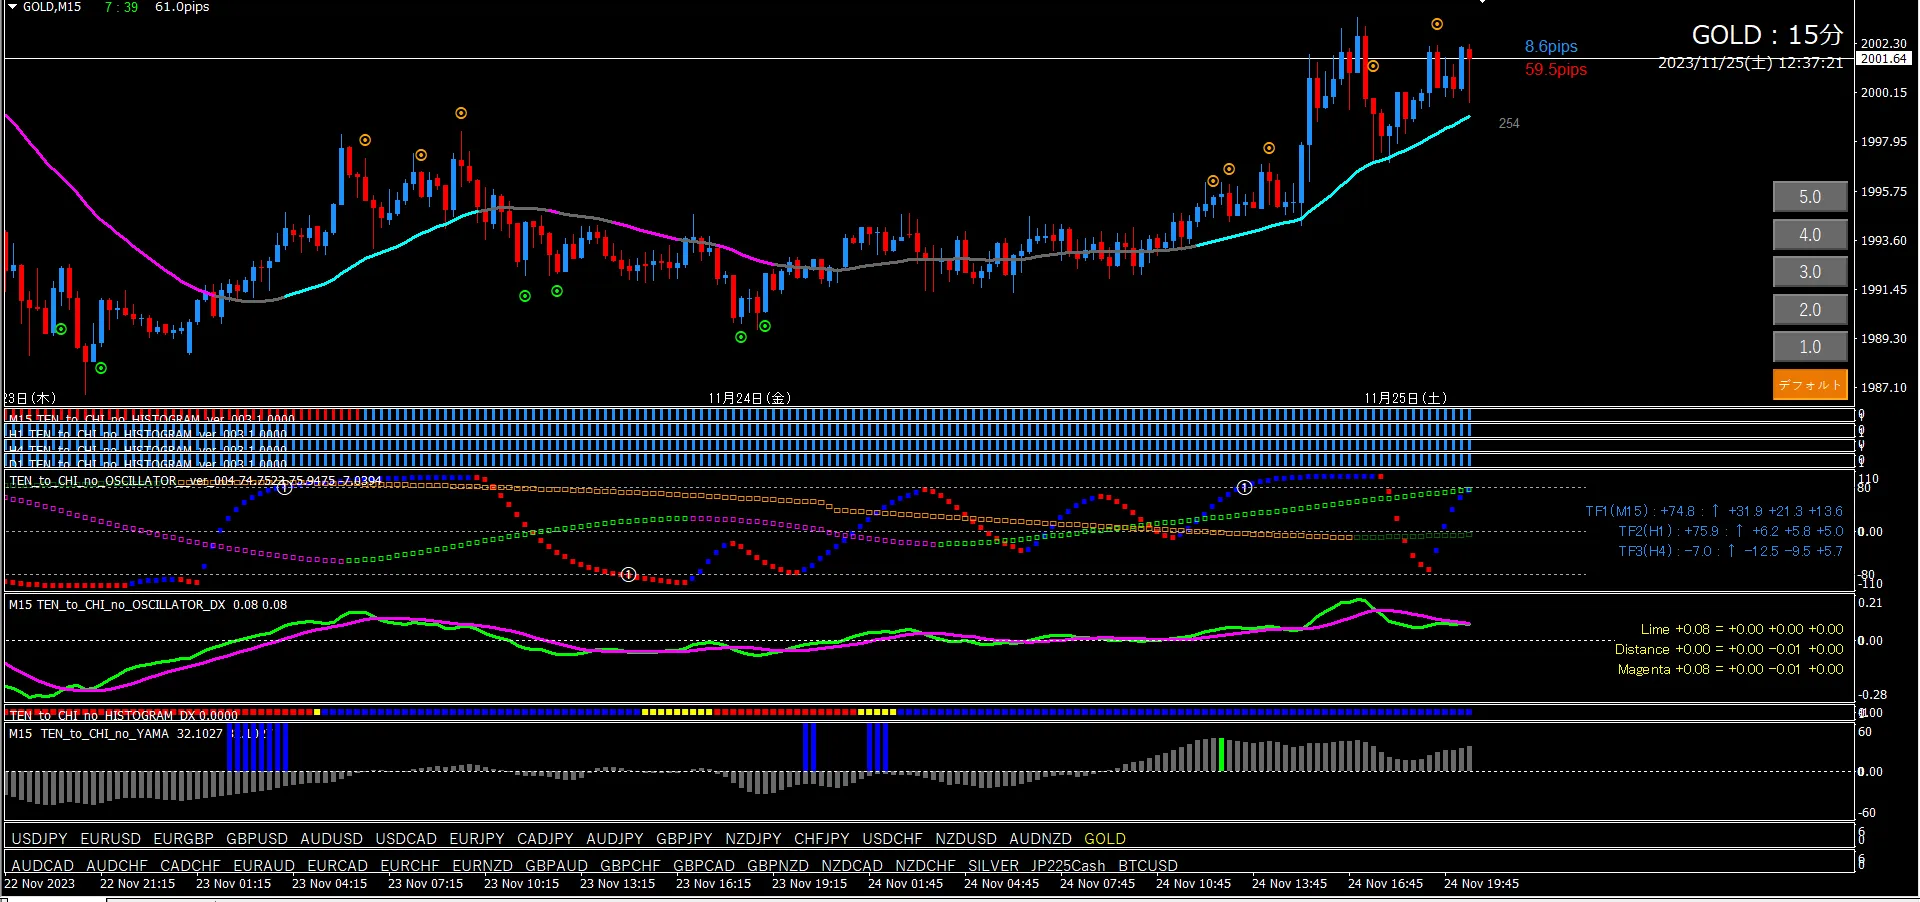
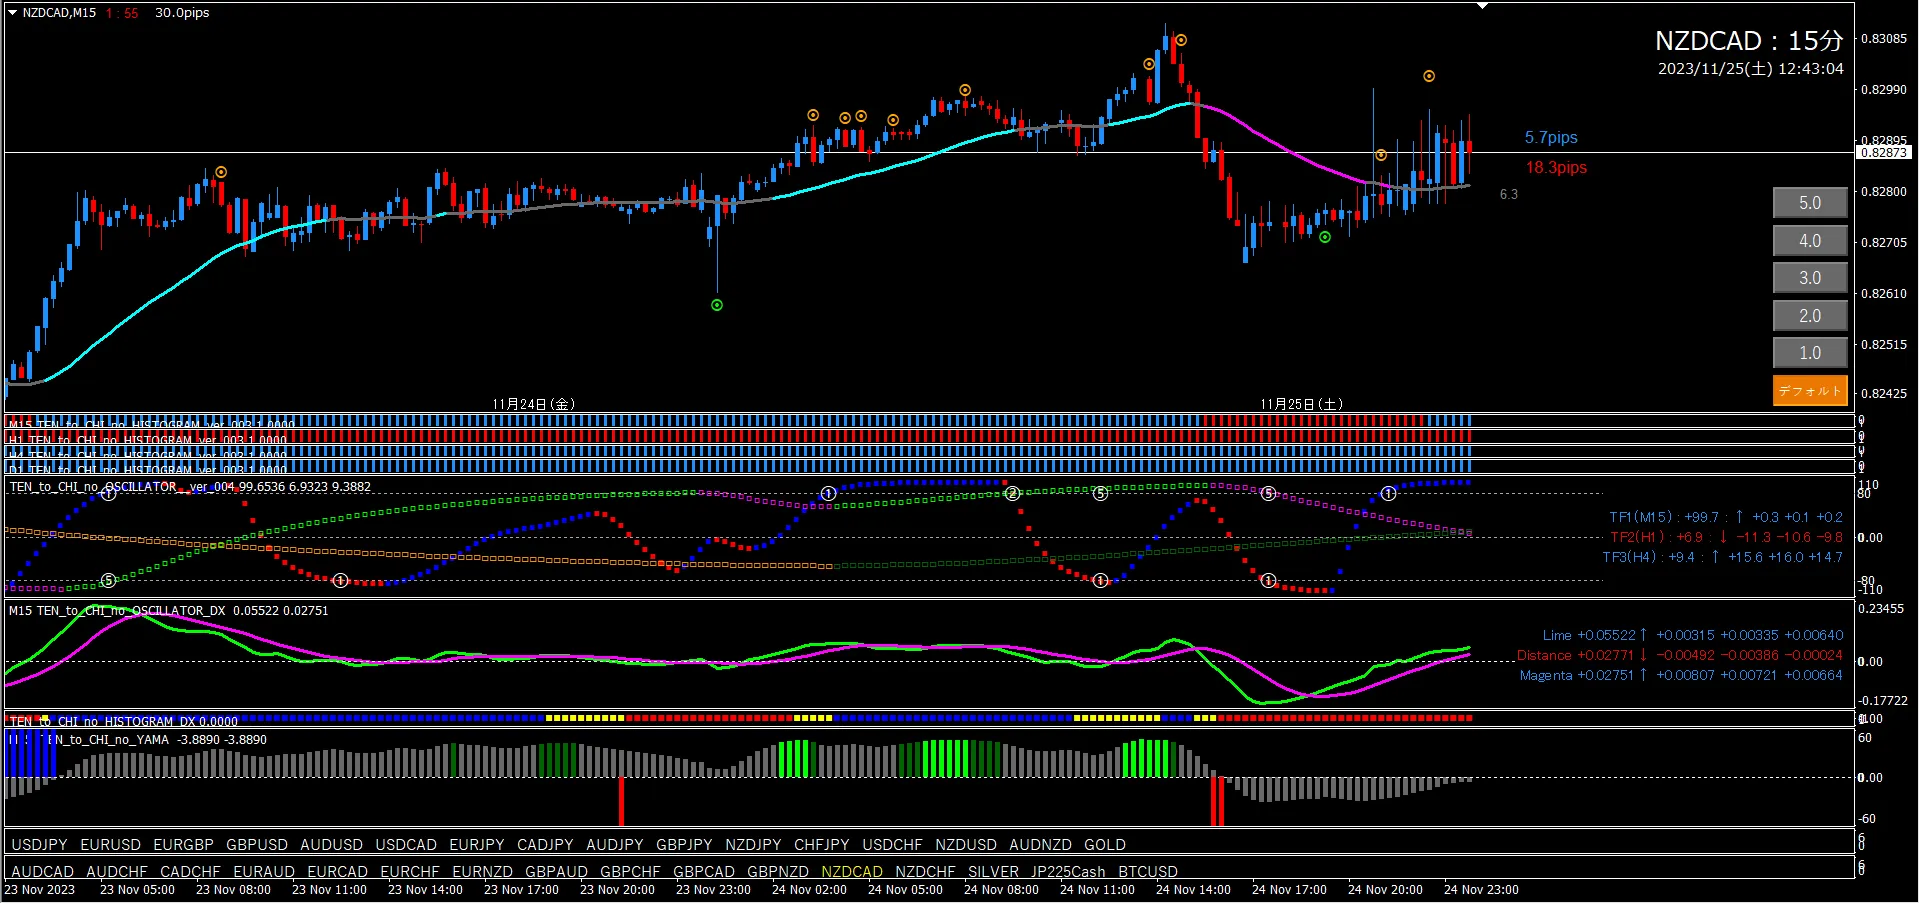
■ 15-minute (Entry trigger)
If the 4-hour shows a down-side view, only target short entries on the 15-minute chart.
The 15-minute chart overall is not in a great shape; it resembles a long-entry pattern. When the 4-hour confirms a down-side view, the 15-minute should become more favorable. Wait for Oscillator TF2 to fall (preferably from +80), TF1 near +80, and a short-entry signal; only then prepare for a short entry. Always keep line triggers in view.
■ Heaven and Earth EA (to be used on the 15-minute chart)
First, wait for Oscillator TF2 to fall. Then use the EA pattern that best fits the current situation.
If the current candlestick is above the line, a short-entry signal is likely, so set EA Pattern 1.
If TF1 is above the zero line, set EA Pattern 2.
If TF1 and TF2 reach +80 and Oscillator signal 2 appears, target EA Pattern 3.
If the valley lights up, set EA Pattern 4 at that time.
If a clear trend can be confirmed on the 4-hour, use EA Pattern 6 to trade automatically using Heaven and Earth's line color change. This covers the entire trend from end to end.
■ Abe-san Signal (to be used on the 15-minute chart)
If you have Abe-san Signal, you can wait for Signal 2 and enter long at Signal 1. In Abe-san Signals, if the 4-hour is clearly directional, you can ignore oscillator TF2 direction and other grounds. It is a very strong trend-following signal, so no problem. The usage is the same for other currency pairs, so it is omitted from the following analyses.

■ 4-hour (environment recognition)
Oscillator T2 lingers near +99.9, TF1 turns up near -80, Oscillator DX crosses upward shortly after. At this point, a higher bias could be assumed. However candlesticks are already above the line, so it is a short-term up-side bias until a short-entry signal appears. According to Heaven and Earth PIPS FUTURE, there is at least 31.5 pips to go. So the bias remains up for now.
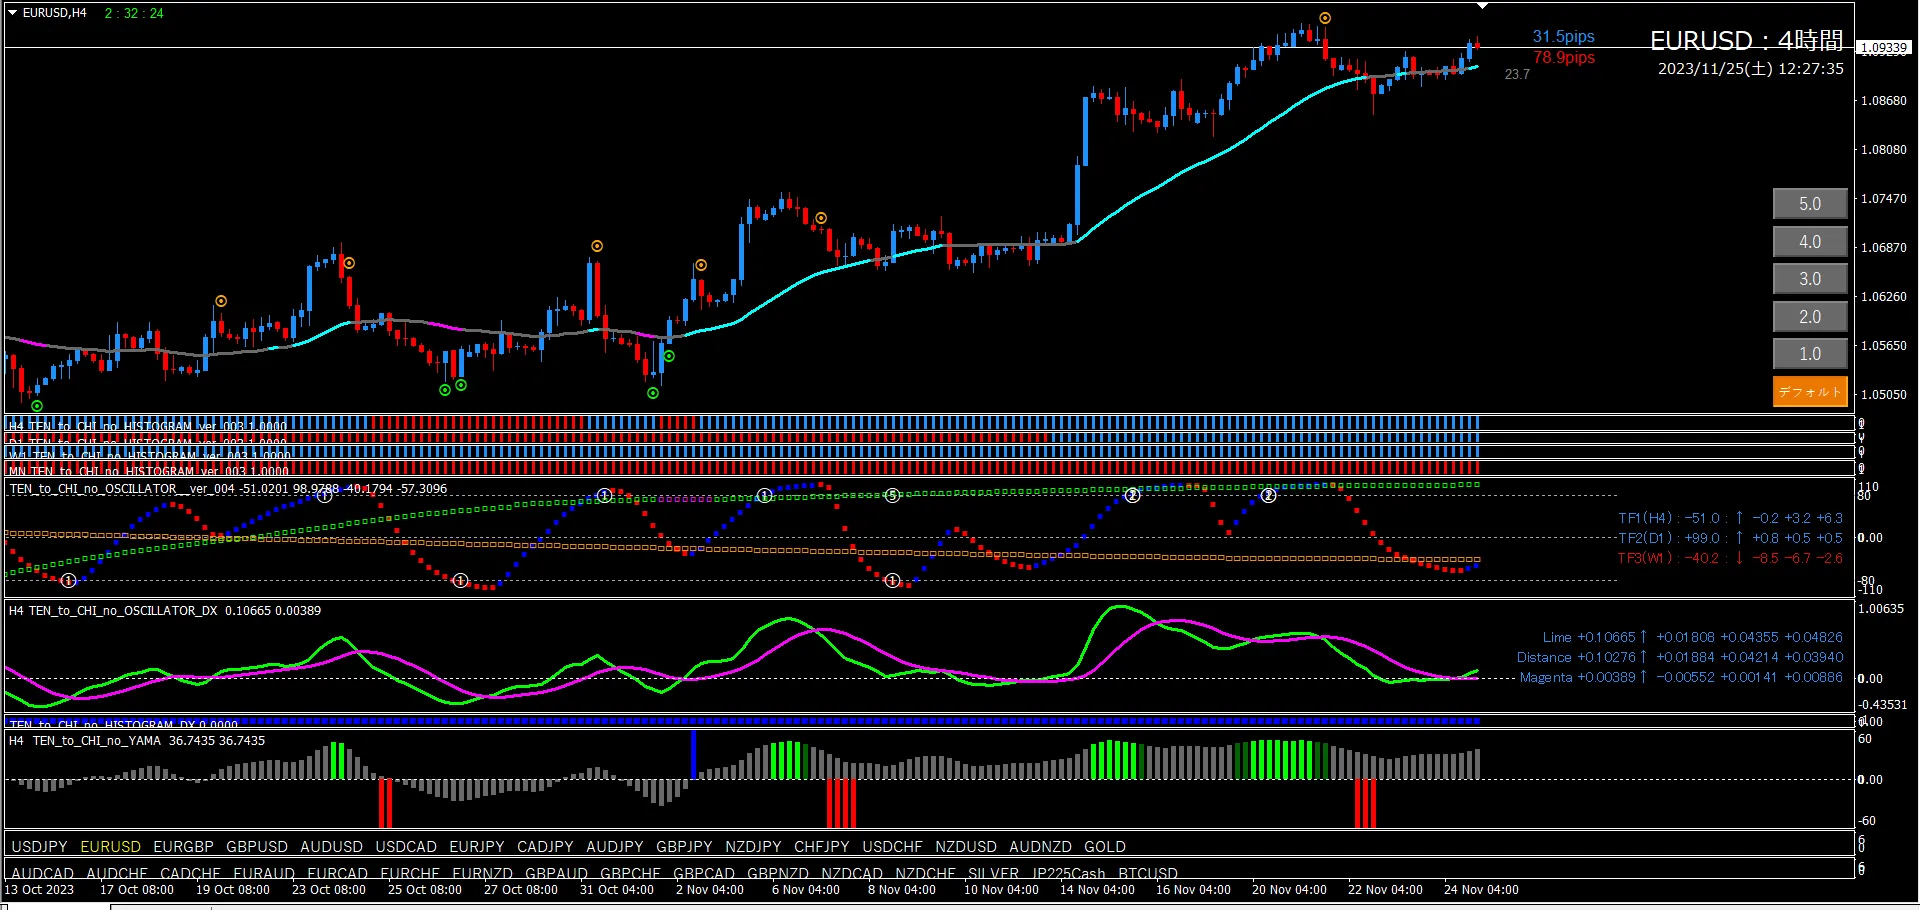
■ 15-minute (Entry trigger)
Since the 4-hour already shows an up-side bias, focus on long entries only on the 15-minute chart.
Future scenarios: TF2 is already rising, continue rising and wait for Oscillator DX upward cross (or contraction), then long-entry on Signal 2. It will take at least another 8.7 pips until a long-entry signal is generated. Best if TF1 can retract toward -80.
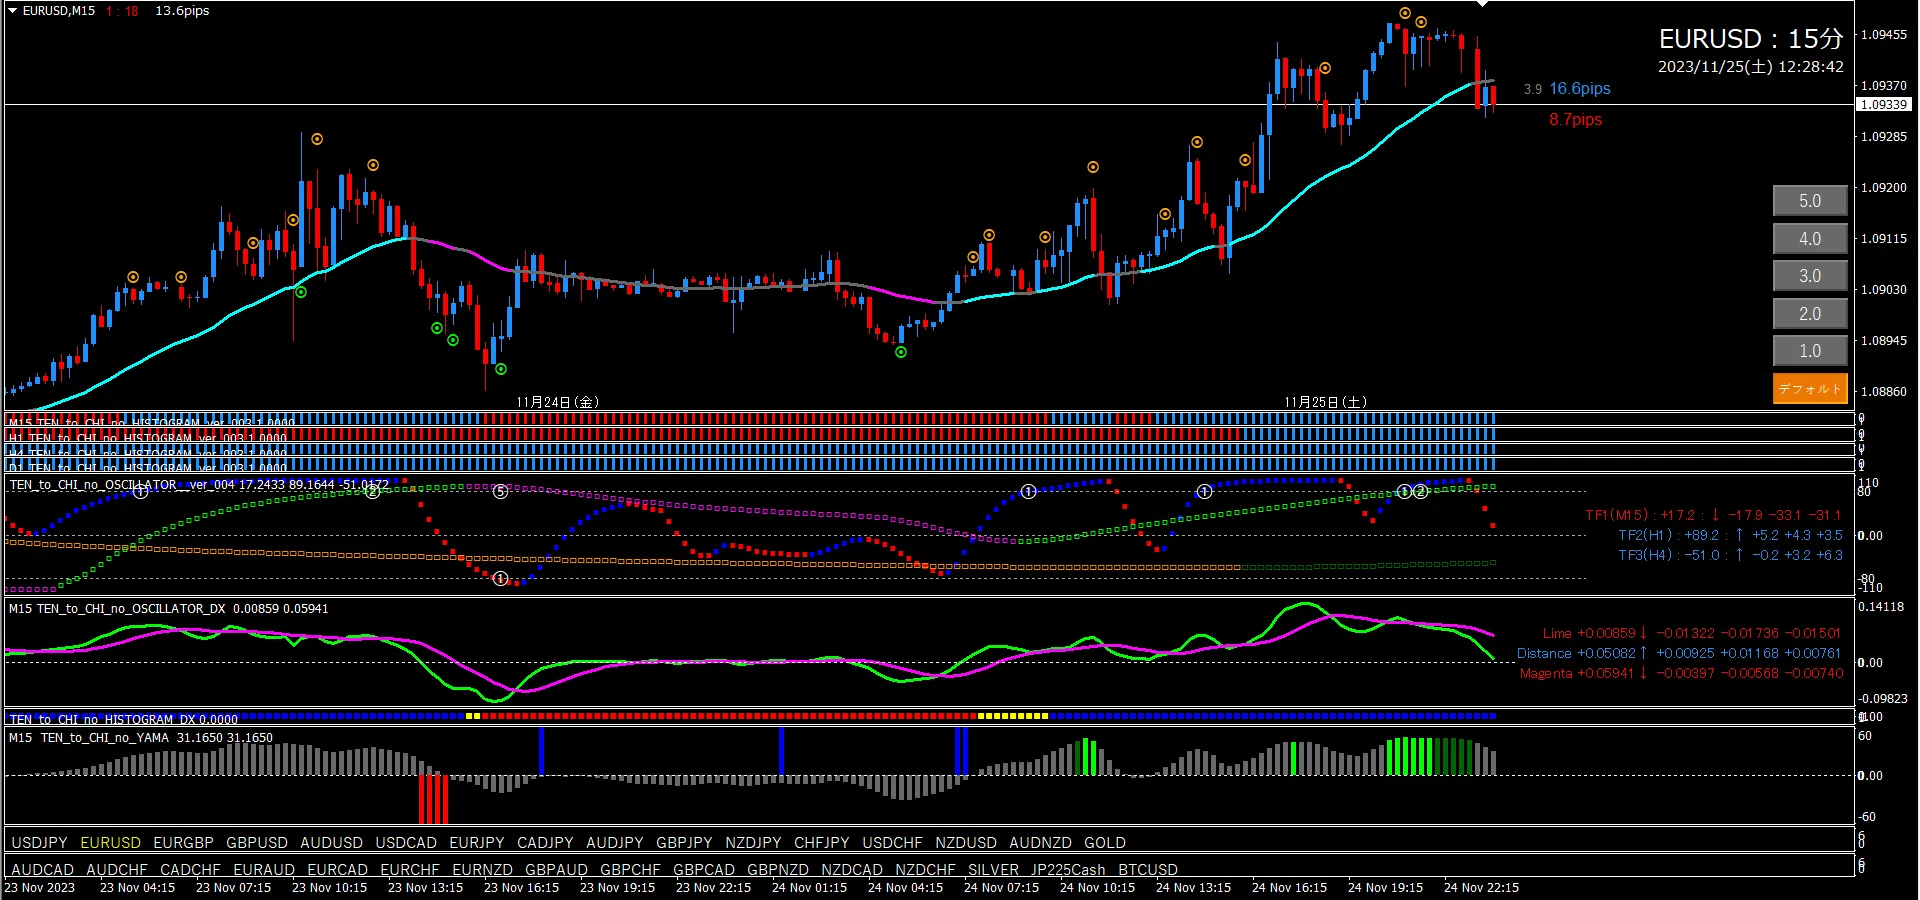
■ Heaven and Earth EA (to be used on the 15-minute chart)
Since the 4-hour already shows an up-side bias, set EA Pattern 1 as basic. For other setup conditions, please refer to USD/JPY.

■ 4-hour (environment recognition)
Oscillator TF2 is rising, long-entry signal expected in at least about 9.6 pips. However Oscillator DX is still in a down state. To confirm up-side bias, need long-entry signal + Oscillator DX rising cross (contraction).
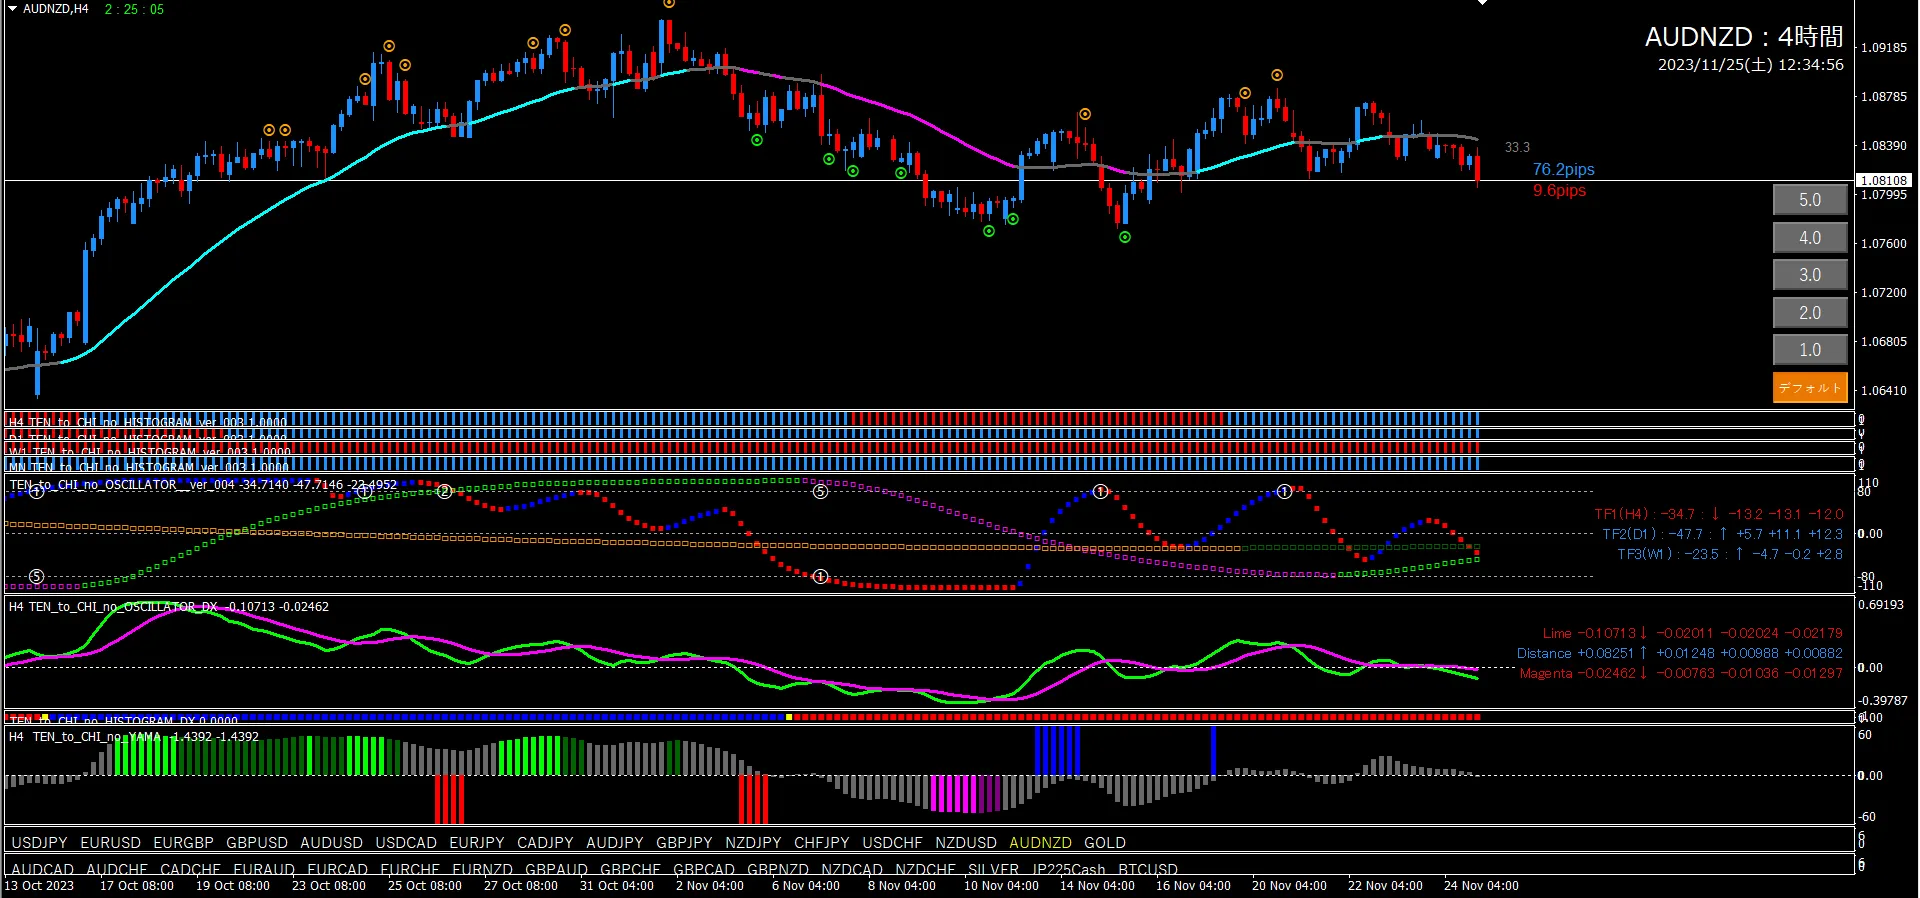
■ 15-minute (Entry trigger)
If the 4-hour indicates an up-side bias, target long entries only on the 15-minute chart.
The wicks are large; chart isn’t ideal. Hopefully by the time the 4-hour confirms up-side, the 15-minute will have settled. Going forward: after confirming up-side, first wait for the TF2 up-move, then wait for a long-entry signal and Oscillator DX upward cross. Also pay attention to TF1 position.
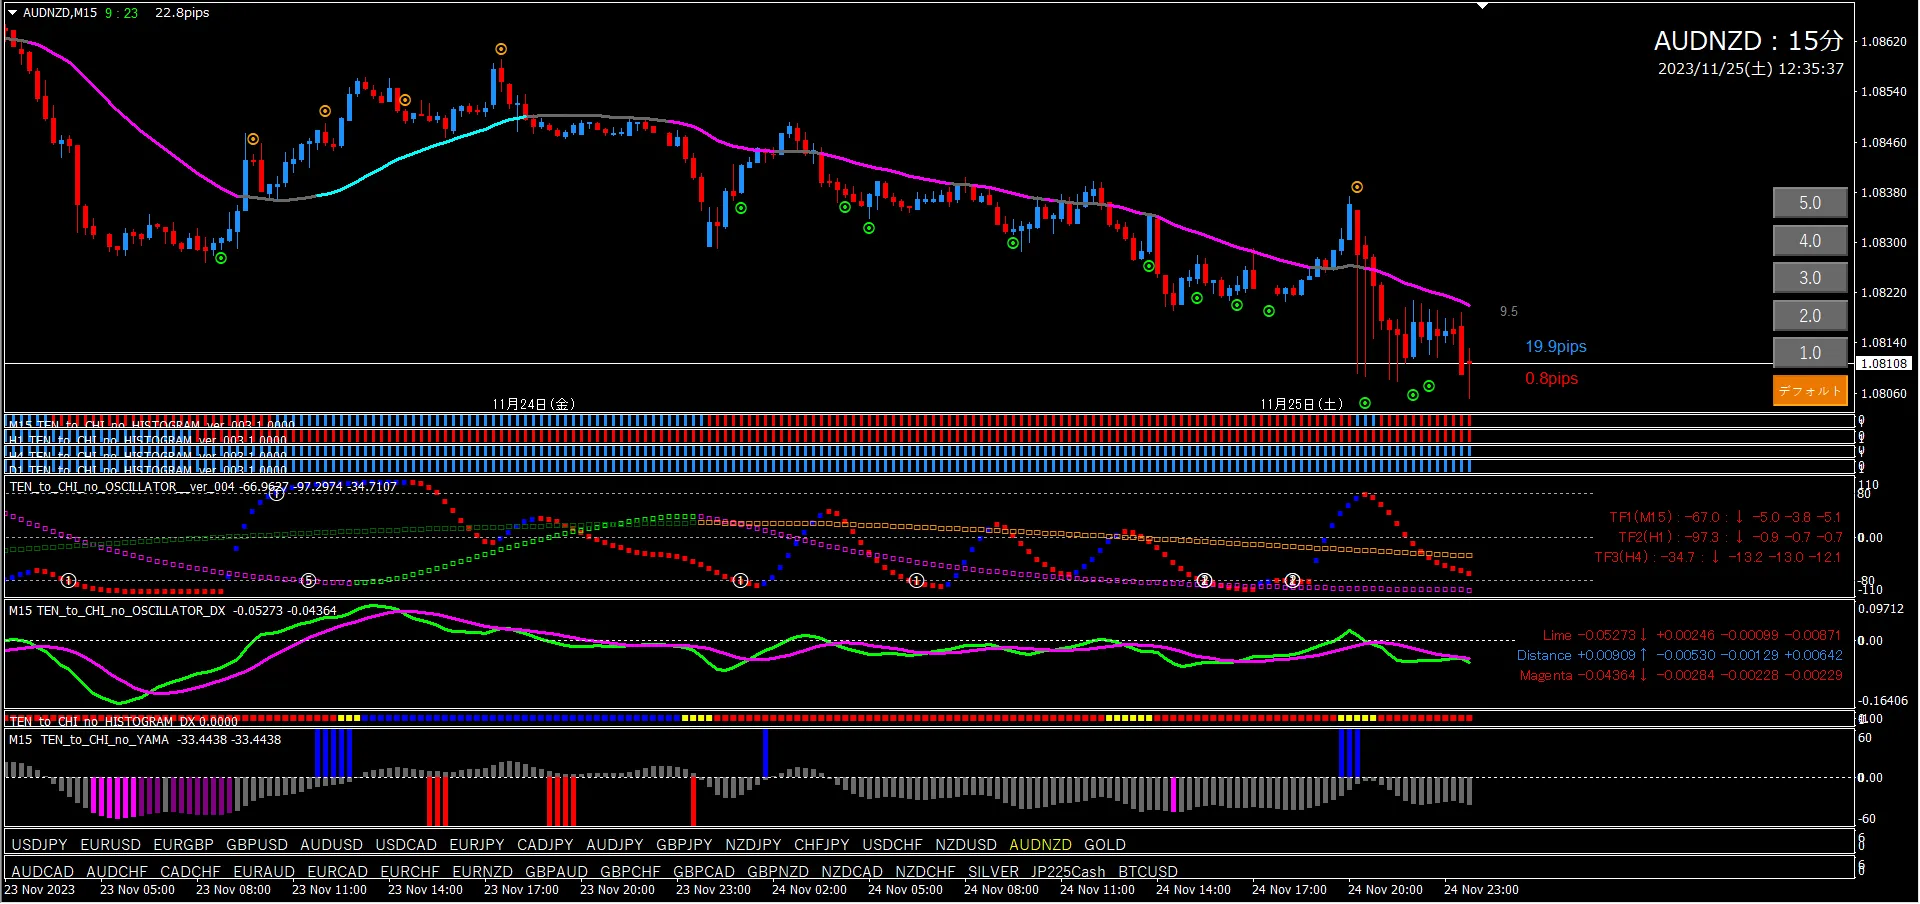
■ Heaven and Earth EA (to be used on the 15-minute chart)
Please refer to USD/JPY as a starting point.

■ 4-hour (environment recognition)
Oscillator TF2 is rising with a clean angle. TF1 has turned up recently. However the candlesticks are already above the line, so this is a short-term up-side bias. Since there is at least 63.3 pips to the short-entry signal, the up-side bias will continue until then. If Oscillator DX does not cross upward and remains open, resetting the up-side bias would be prudent.
■ 15-minute (Entry trigger)
Since we already have an up-side bias on the 4-hour, target long entries on the 15-minute chart.
At present, Oscillator TF2 is already rising, but the move may be near its peak, making entry points difficult. If TF2 continues to rise and the candlestick touches the line, a long entry often yields good results. There is still about 59.5 pips to the long-entry signal, so don’t rush. Oscillator DX is not in a good shape for grounds. If a valley lights up, that can be a trigger.
■ Heaven and Earth EA (to be used on the 15-minute chart)
Currently Oscillator TF2 is rising, so EA Pattern 1 is basic, but please remember it will take at least 59.5 pips for a long-entry signal since candlesticks are above the line. Look forward to a window opening at the start of the week.

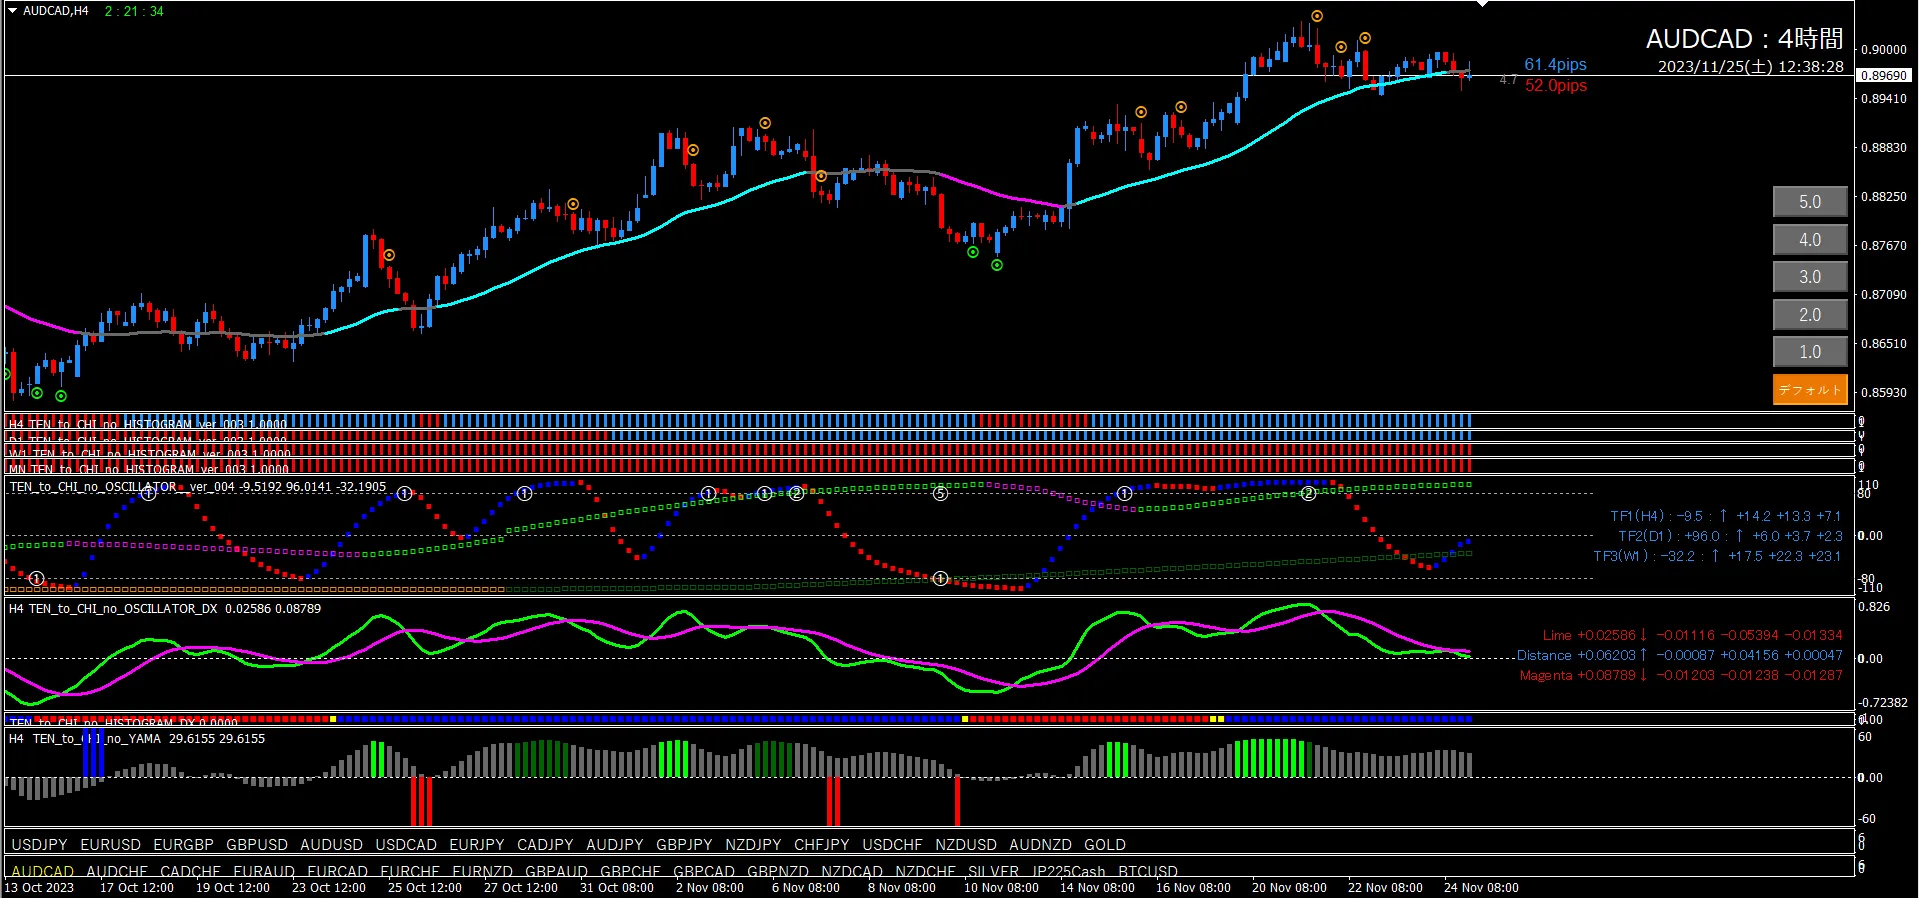
■ 4-hour (environment recognition)
Oscillator TF2 is at +96 and still rising. TF1 is also rising. However Oscillator DX is not in a good shape. If aiming for an up-side bias, the only viable entry is a long-entry signal. Long-entry signal is predicted to appear in at least another 52 pips. If TF2 turns downward, the up-side bias is reset.
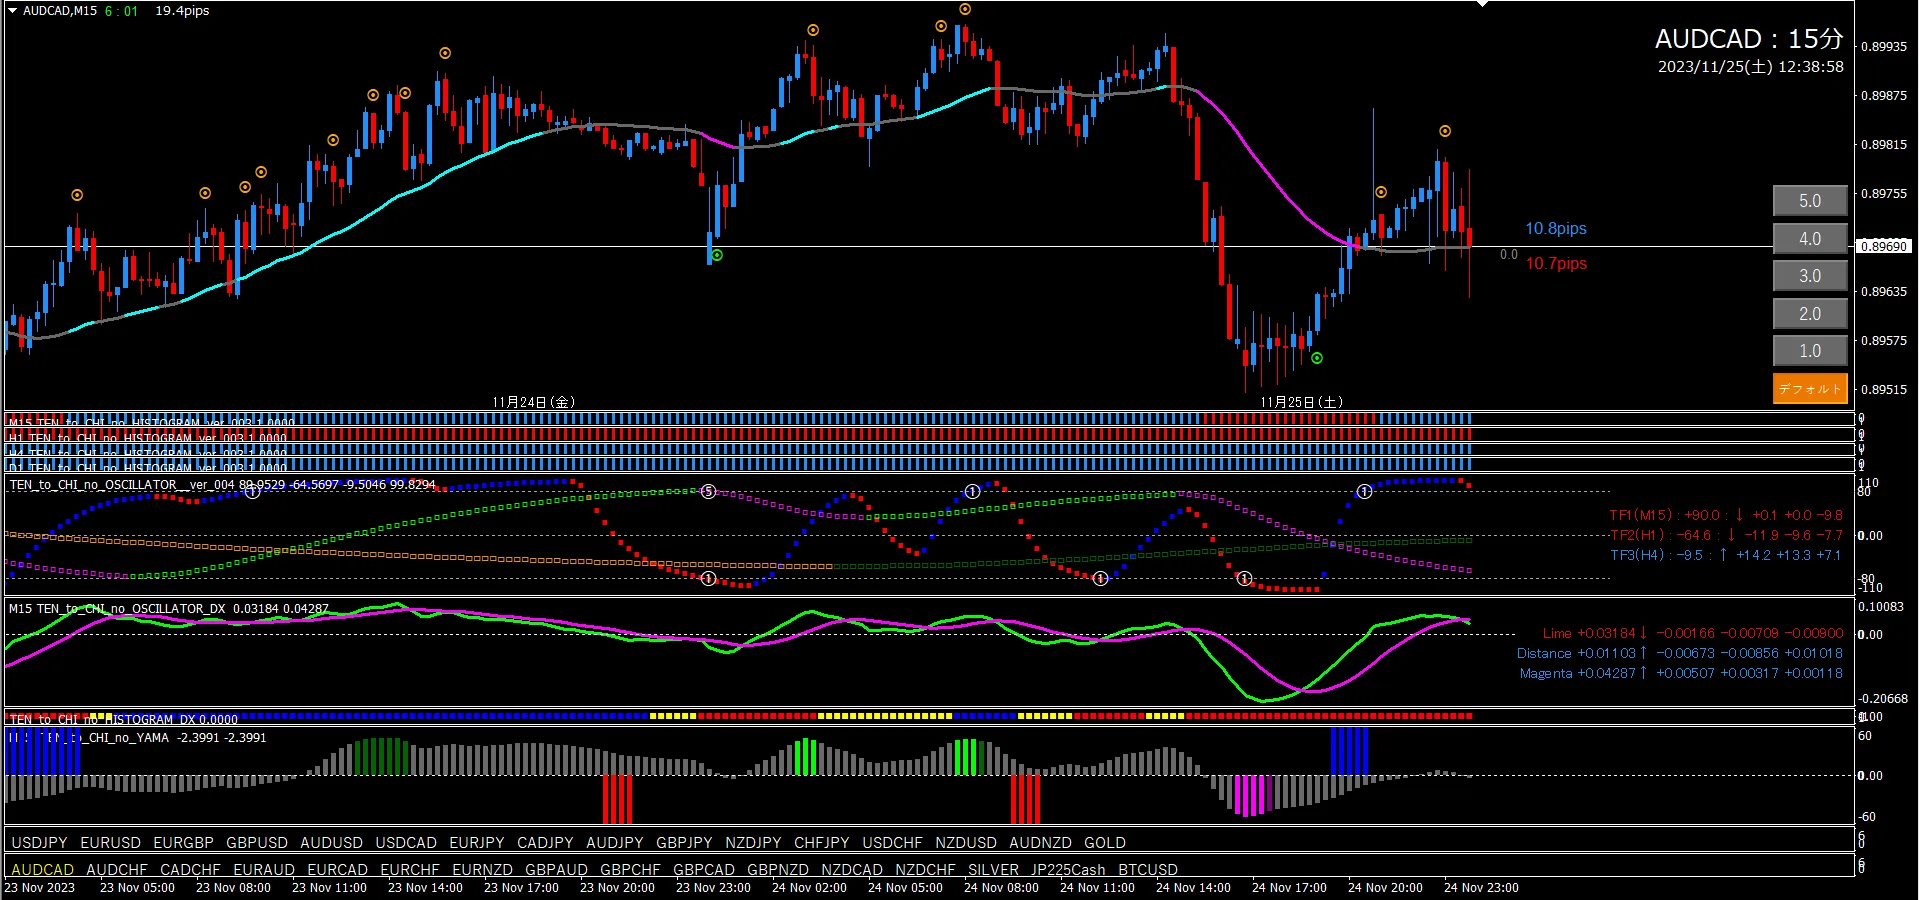
■ 15-minute (Entry trigger)
Since the 4-hour already shows up-side bias, focus on long entries on the 15-minute chart only.
Currently Oscillator TF2 is rising, so going forward, wait for long trigger (dot, TF1, valley, and if the pattern is good, DX). Of course this assumes TF2 remains upward. If all patterns are good (see manual), you may also use a line trigger.
■ Heaven and Earth EA (to be used on the 15-minute chart)
Please refer to USD/JPY.

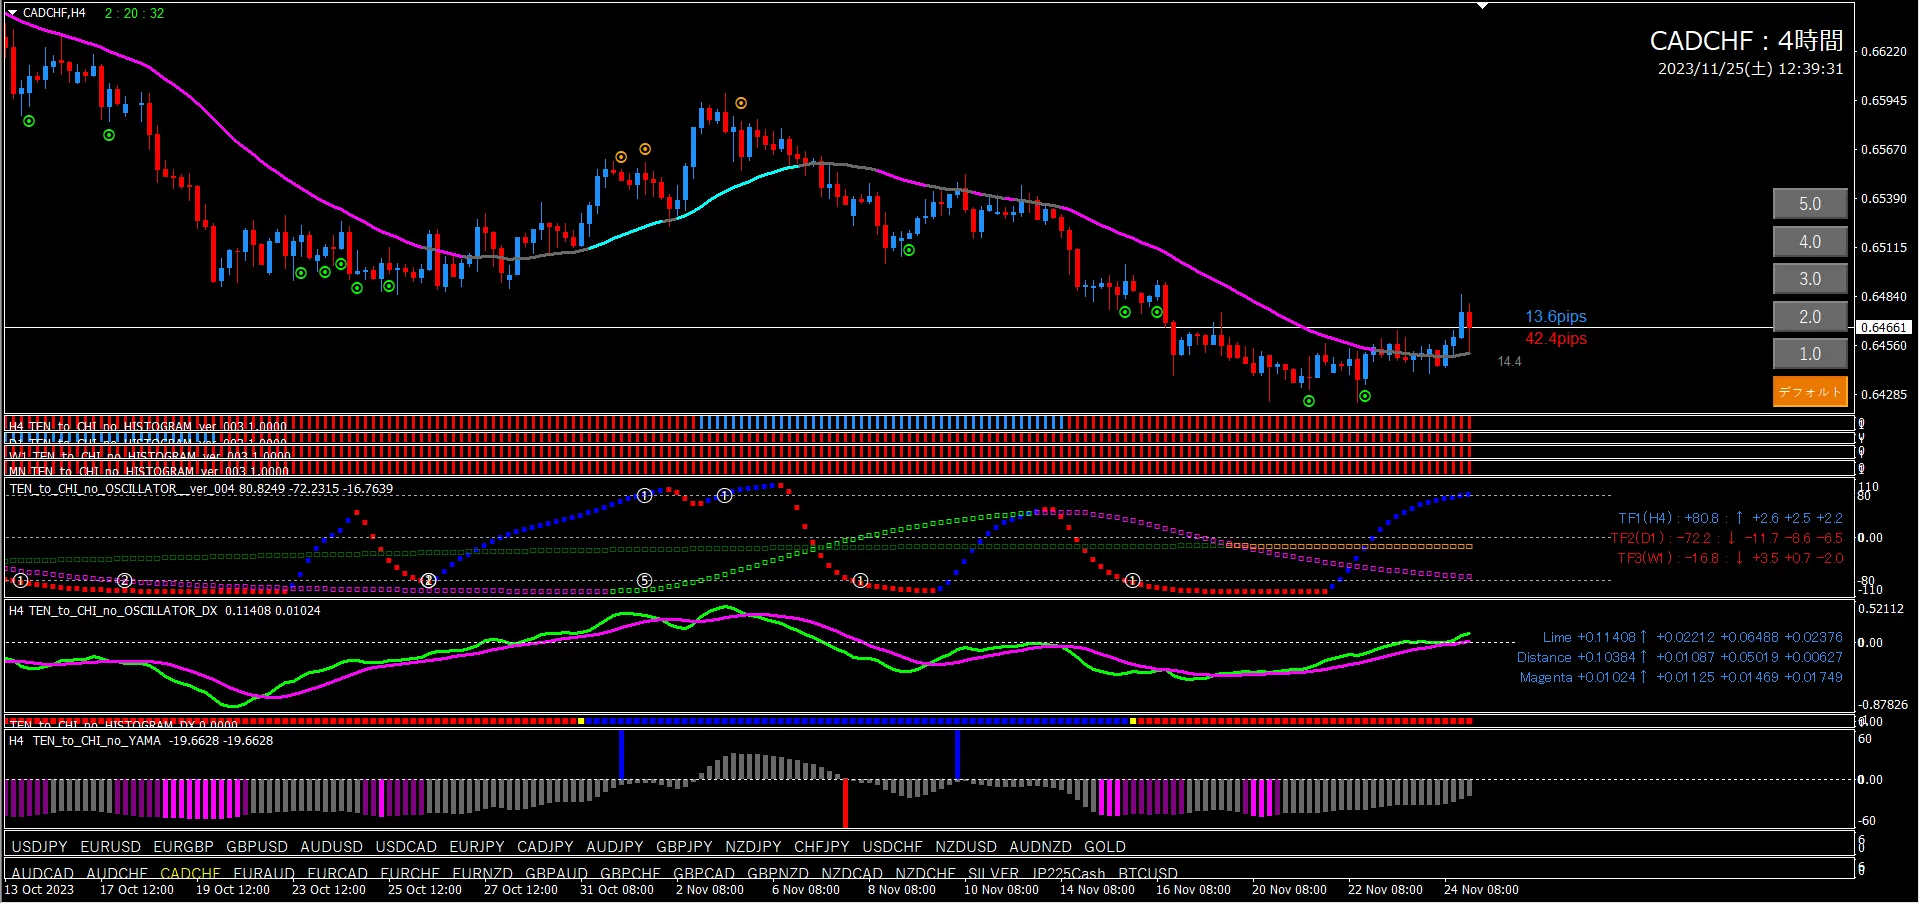
■ 4-hour (environment recognition)
Oscillator TF2 is descending; TF1 has reached +80. A favorable shape. Short-entry signal is predicted to appear in about 13.6 pips. When a short-entry signal appears, it is a down-side bias. To avoid false signals, also monitor Oscillator DX's shape.
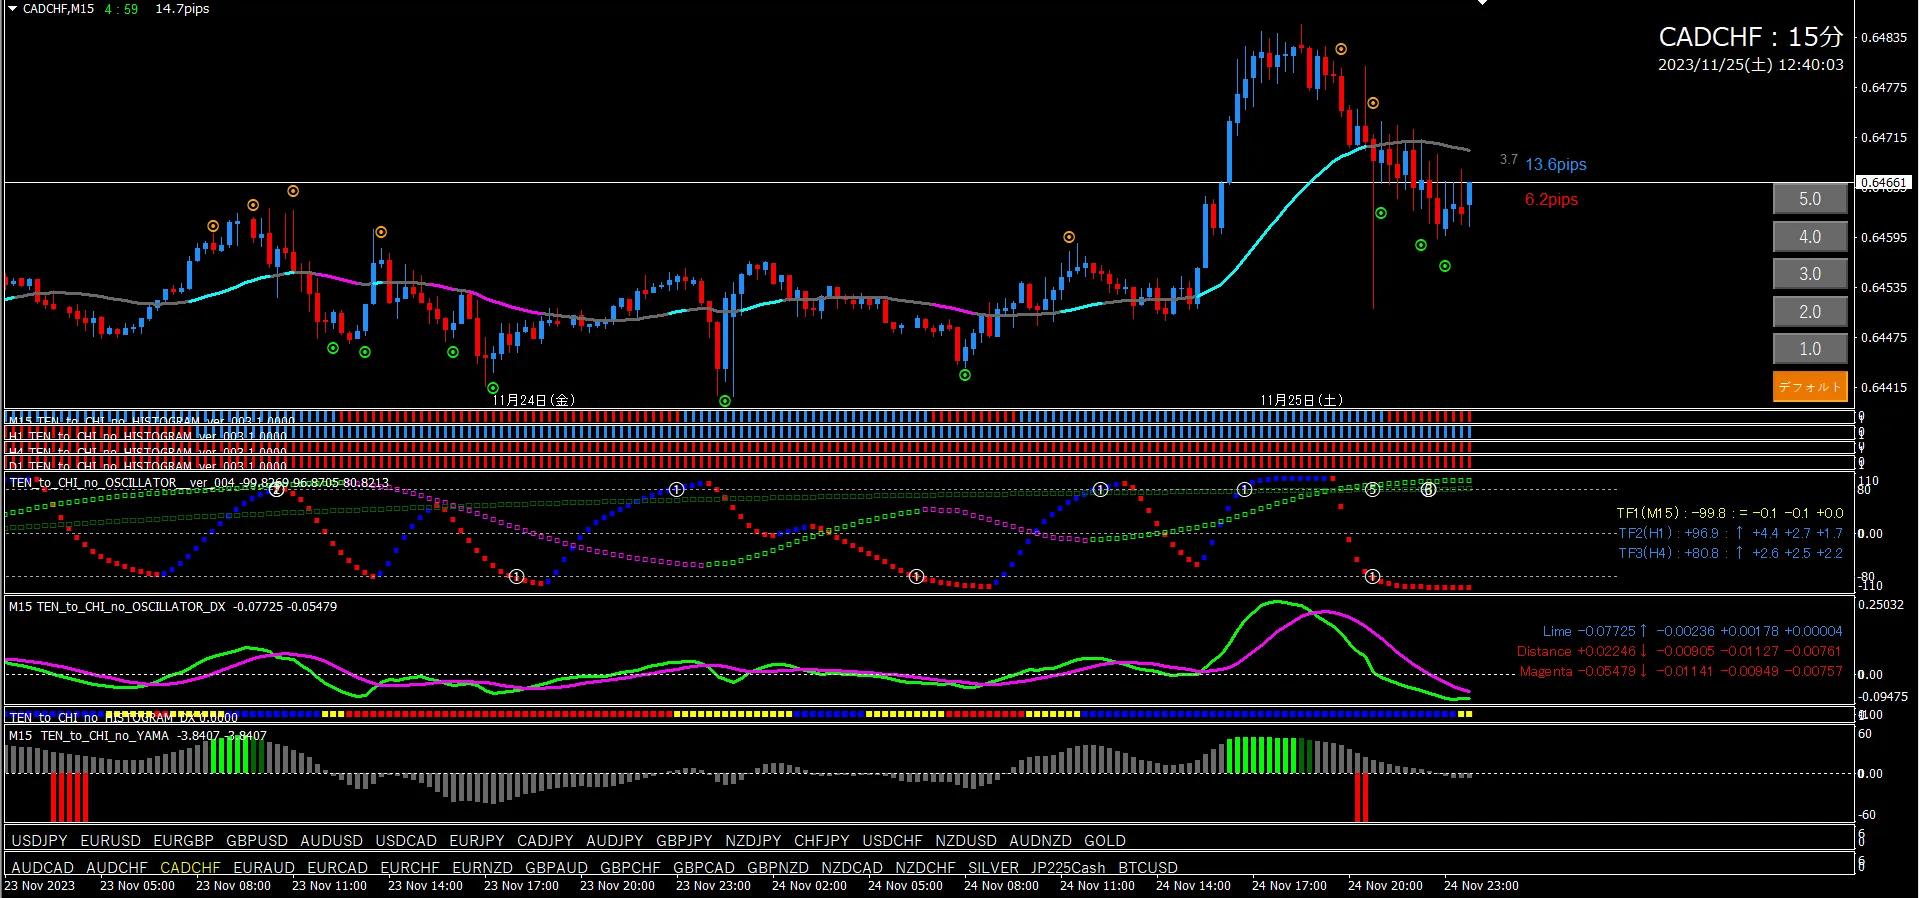
■ 15-minute (Entry trigger)
If the 4-hour shows down-side bias, target short entries on the 15-minute chart only.
Oscillator TF2 continues rising, so first wait for its downward move. Then wait for short trigger (dot, TF1, valley, DX if shape is good). Of course, TF2 descending is assumed. If all patterns are favorable (see manual), you may use a line trigger.
■ Heaven and Earth EA (to be used on the 15-minute chart)
Refer to USD/JPY.

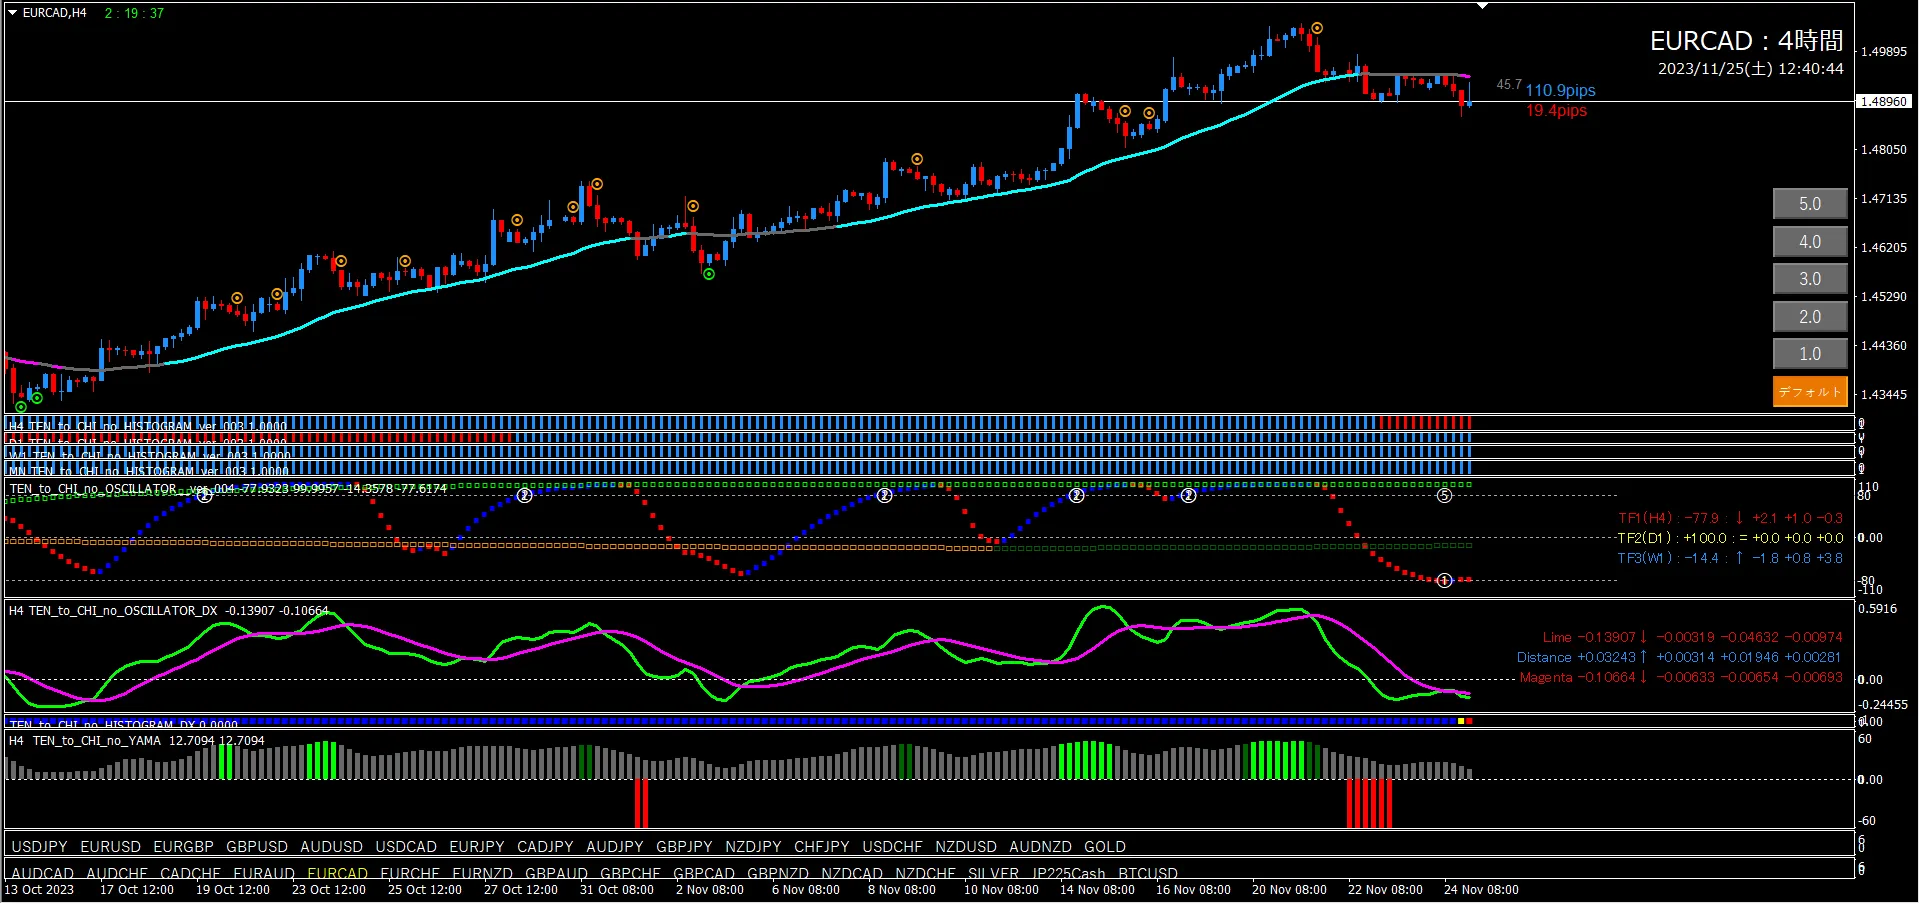
■ 4-hour (environment recognition)
Oscillator Signal ⑤ is appearing. Good shape for a pullback buy. Long-entry signal is predicted to appear in at least 19.4 pips. A long-entry signal will be considered as up-side bias once it appears. However Oscillator DX is wobbling and not in a good shape, so ensure a solid up-cross before using.
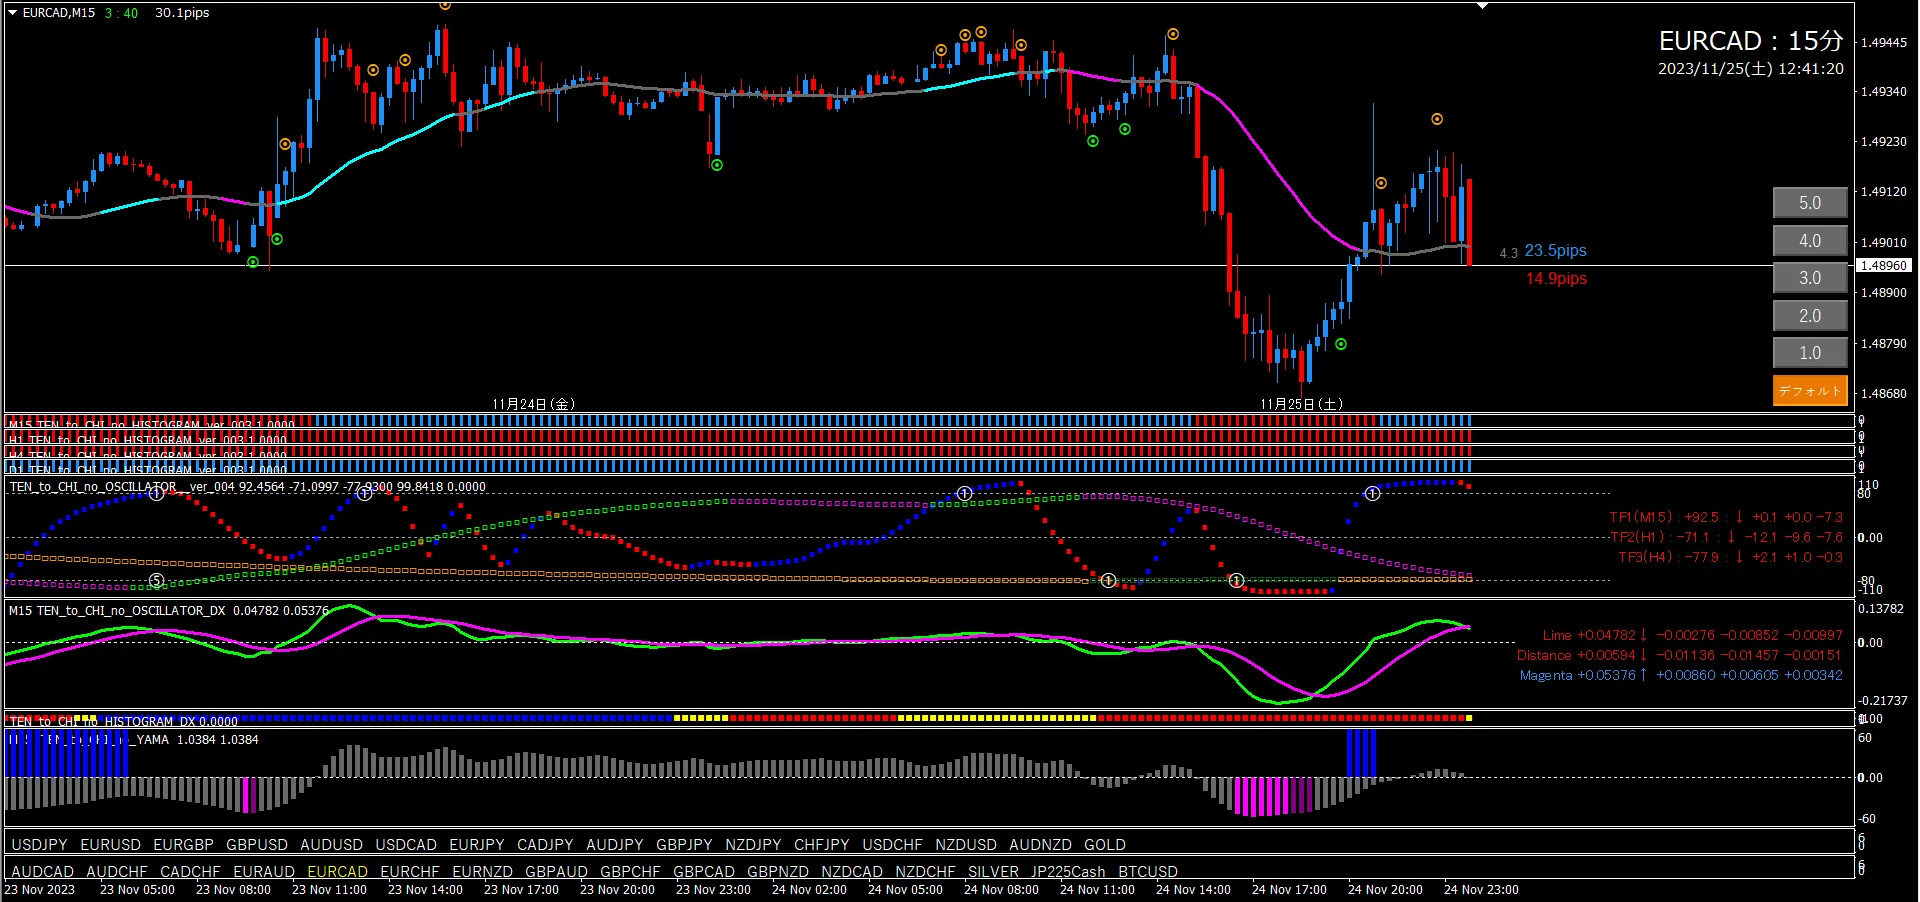
■ 15-minute (Entry trigger)
If the 4-hour shows up-side bias, target long entries on the 15-minute chart only.
The chart has many wicks; not ideal. It would be better when the 4-hour confirms up-side that the 15-minute settles. Going forward: after confirming up-side on the 4-hour, wait for the TF2 up-move, then wait for a long trigger (dot, TF1, valley, if pattern is good, DX). Of course assume TF2 rising.
■ Heaven and Earth EA (to be used on the 15-minute chart)
For USD/JPY refer to item ①.

■ 4-hour (environment recognition)
Oscillator TF2 is rising and staying elevated, TF1 is also rising. Since candles are near the line, a short-entry signal can be considered up to the line. Short-entry signal is predicted to appear in at least 48.1 pips. Oscillator DX is not in a good shape, so not used as grounds.
■ 15-minute (Entry trigger)
Since the 4-hour already shows up-side bias, focus on long entries on the 15-minute chart.
The chart is full of wicks; not ideal. If TF2 turns upward after confirming up-side on the 4-hour, wait for a long trigger (dot, TF1, valley, if good, DX). Of course assume TF2 rising. If all patterns are favorable (see manual), you may use a line trigger.
Refer to USD/JPY as in item ①

Final: Here is the current 4-hour dashboard image.
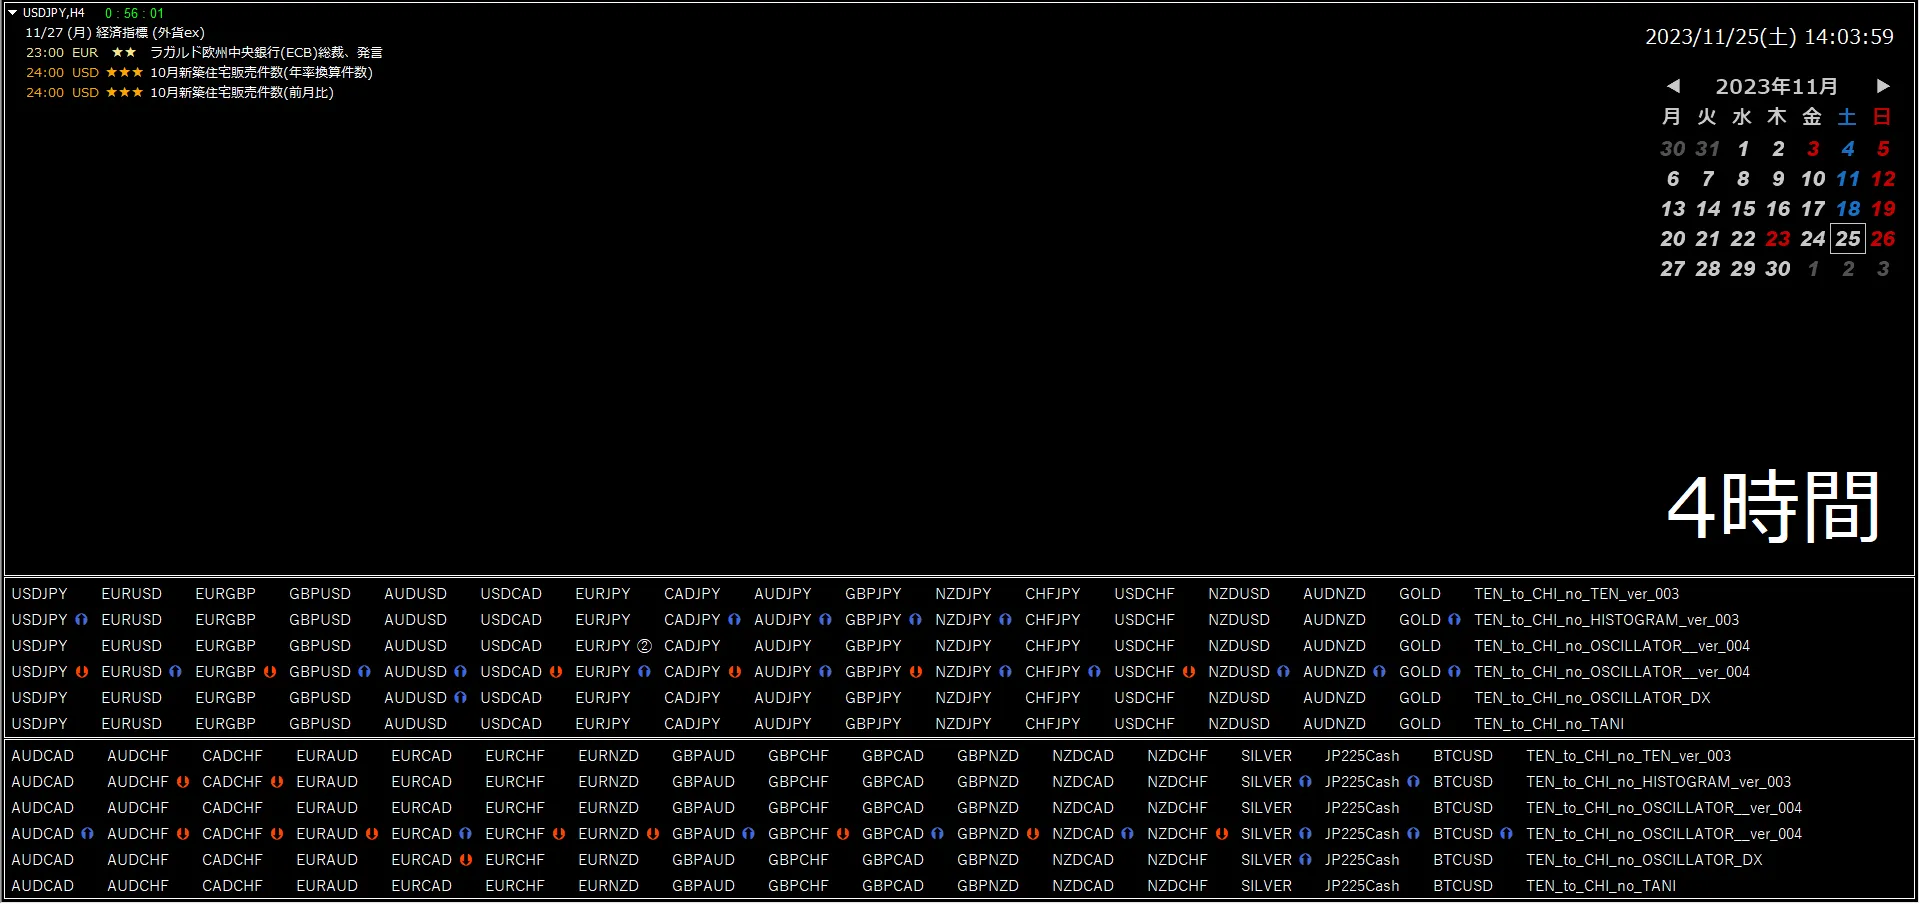

That’s all.
Hope this provides some guidance for everyone.
