

Usage of "Visualization Indicator" (Part 122)
“Visualizing Indicator” usage (part122)”
1. Further evolve the “28 Currency Pair List Indicator” into an indicator
“8CP Visualization Indicator”forAUDUSD charting
The “8CP Visualization Indicator” includesOceania version,London version,NewYork version,AnyCP version. This time, theNewYork version was used.
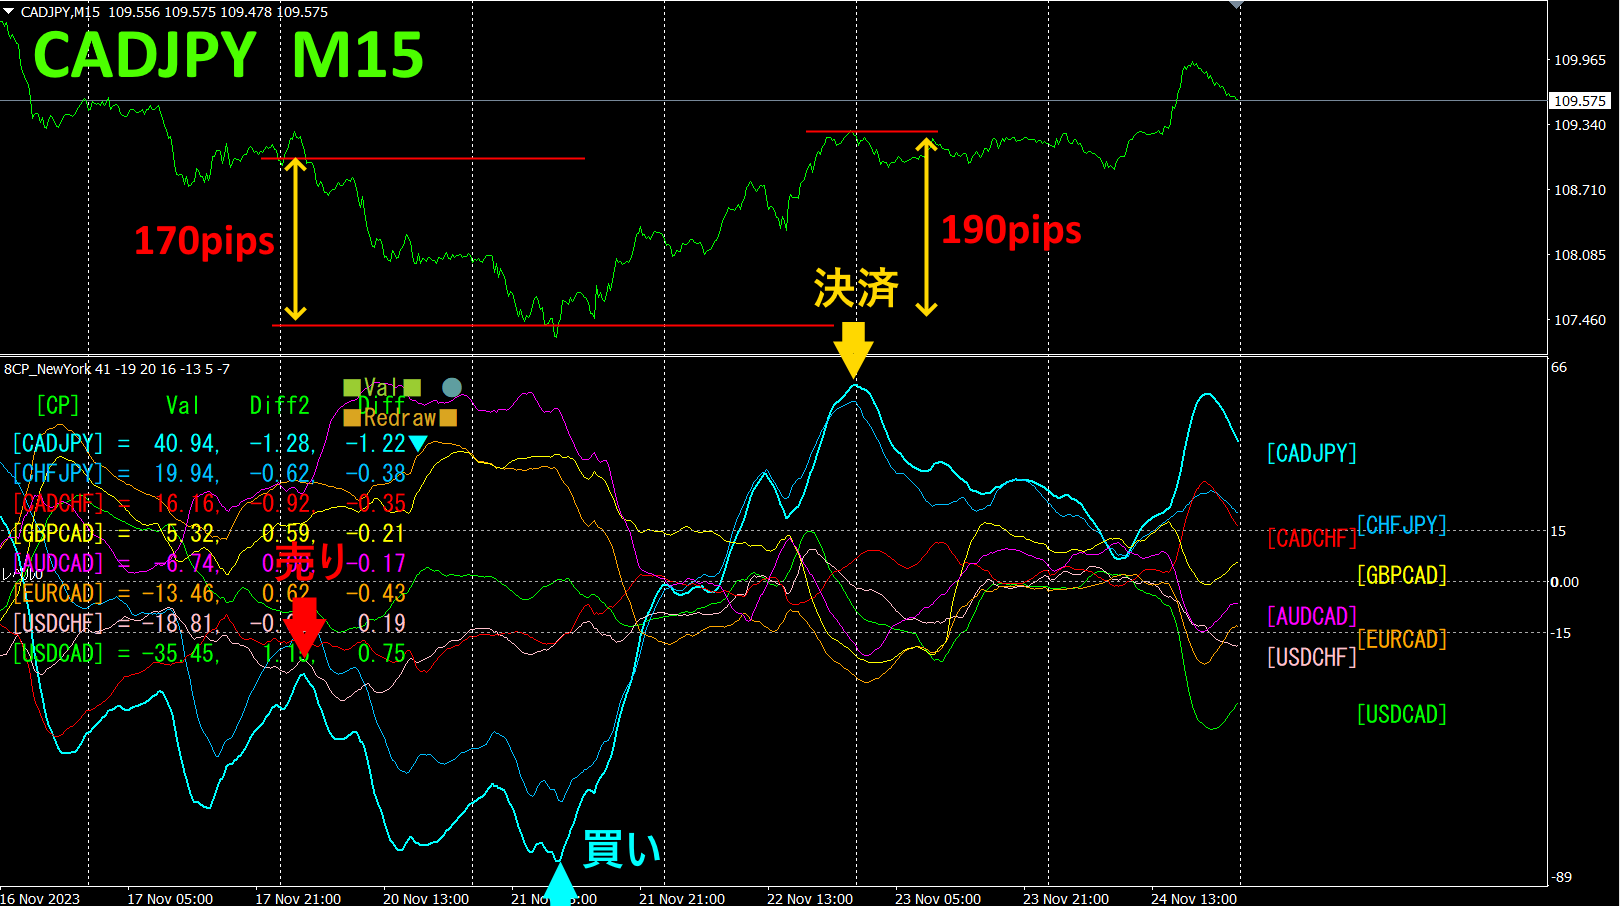
The top half is a 15-minute chart ofCADJPY. The bottom half is from the “8CP Visualization Indicator.” The light blue thick line graph corresponds toCADJPY.
On Monday, CADJPY broke below the cluster of graphs, so a short entry was made. At the trough on Tuesday, the short position was closed and a reverse long position was opened. The peak on Wednesday was closed.Profit from short: about170pips; profit from long: about190pips; total aboutprofitwas obtained. With the “8CP Visualization Indicator,” you can focus on the most volatile currency pair and trade efficiently.
2. Best SelectTry the Indicator
The figure below shows a screenshot taken on2023 year11 month20 day11:41 (JST)

The numbers are sorted in descending order. The bottom row’s USDJPY is red across all timeframes,USDJPY showing a total value of-3165.31 as a large negative number.USDJPY indicates a strong downward trend.
Now, let us look at USDJPY’s chart.
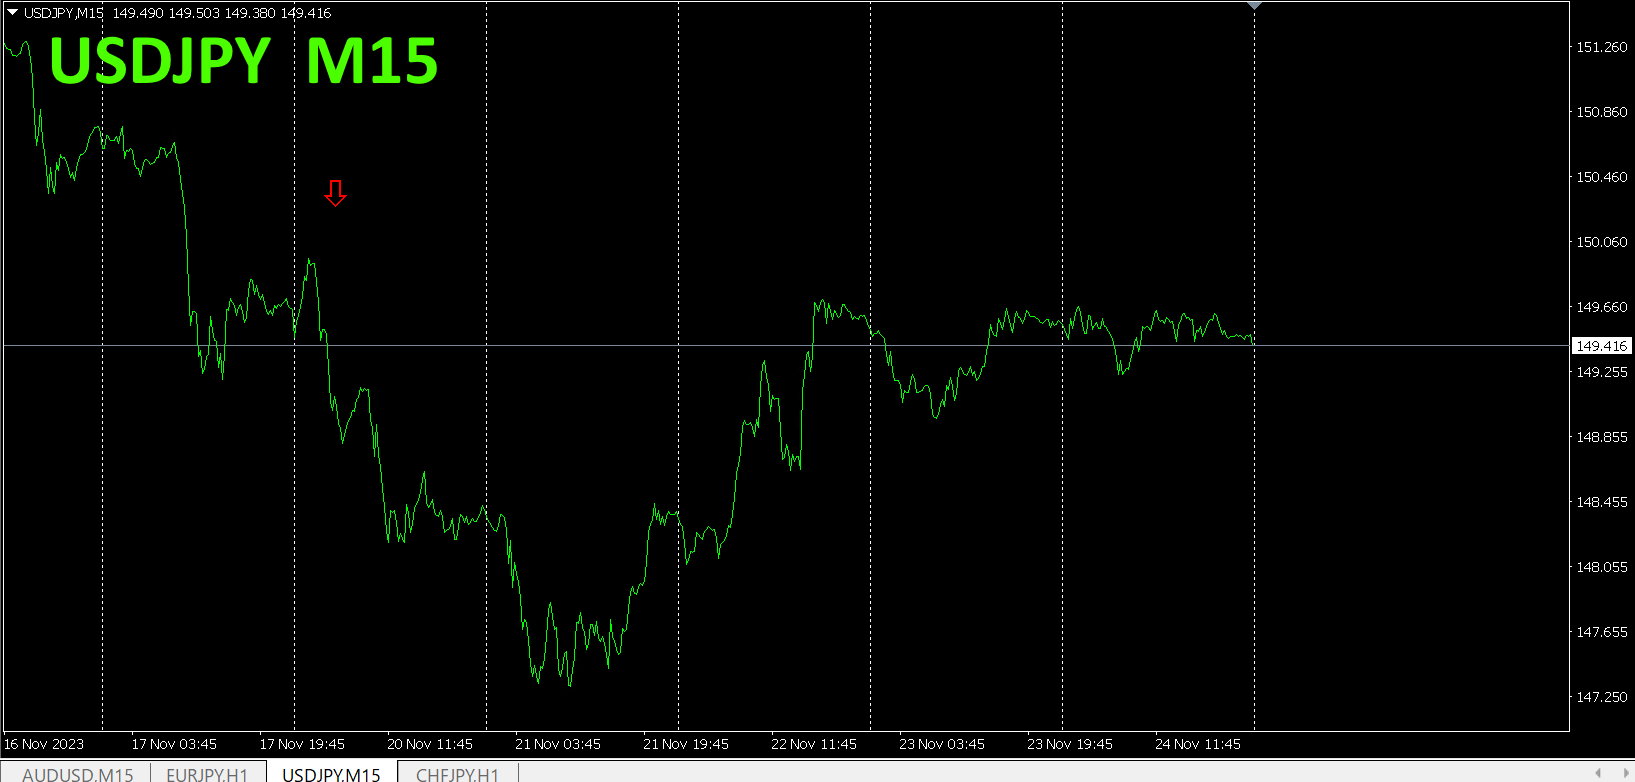
The red arrows mark where the screenshot was taken. They clearly capture the decline. If you sold here and closed at the next day’s trough, you would have earned about200pips profit.
“28 Currency Pairs Best Select
“28 Currency Pairs Best Select Indicator”
https://www.gogojungle.co.jp/tools/indicators/35128

3. What about EURJPY since May of the year before last (two years ago)? movements have been tracked.
Since May,2021 year5 month, EURJPY
To view the overall trend, I’ve drawn about30 minutes of the most recent3 weeks.
Last time I wrote the following.
EUR is rising, butJPY is rising more steeply thanEUR.From the 4-hour currency strength chart’s direction, EURJPY is expected to fall.
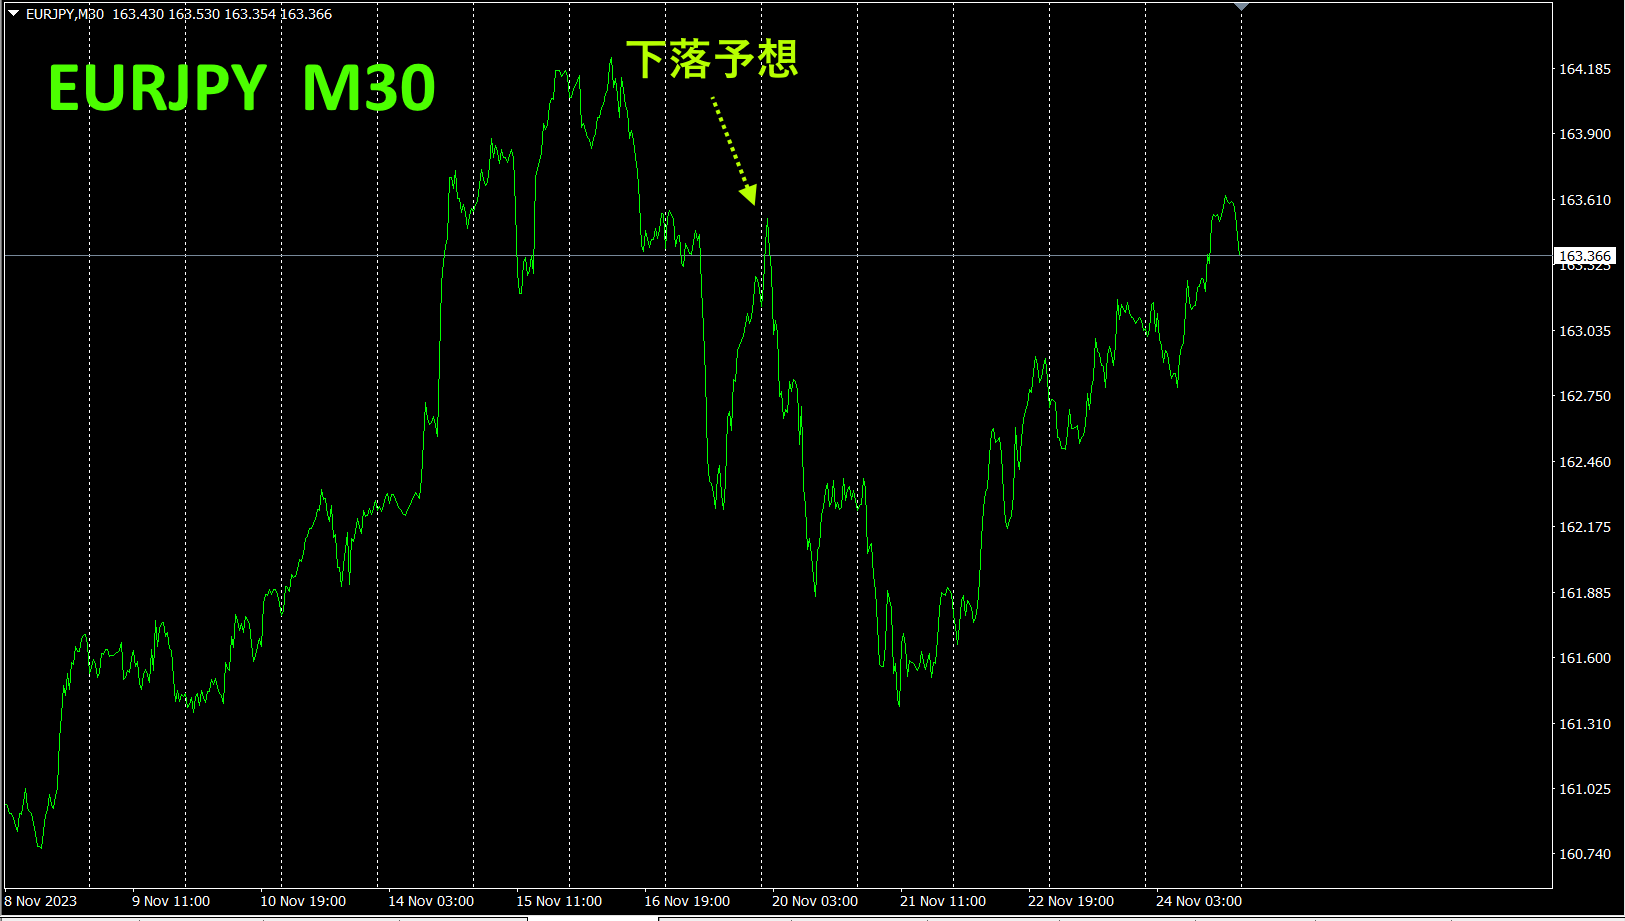
As expected, it fell.
4 Time-frame currency strength chart.
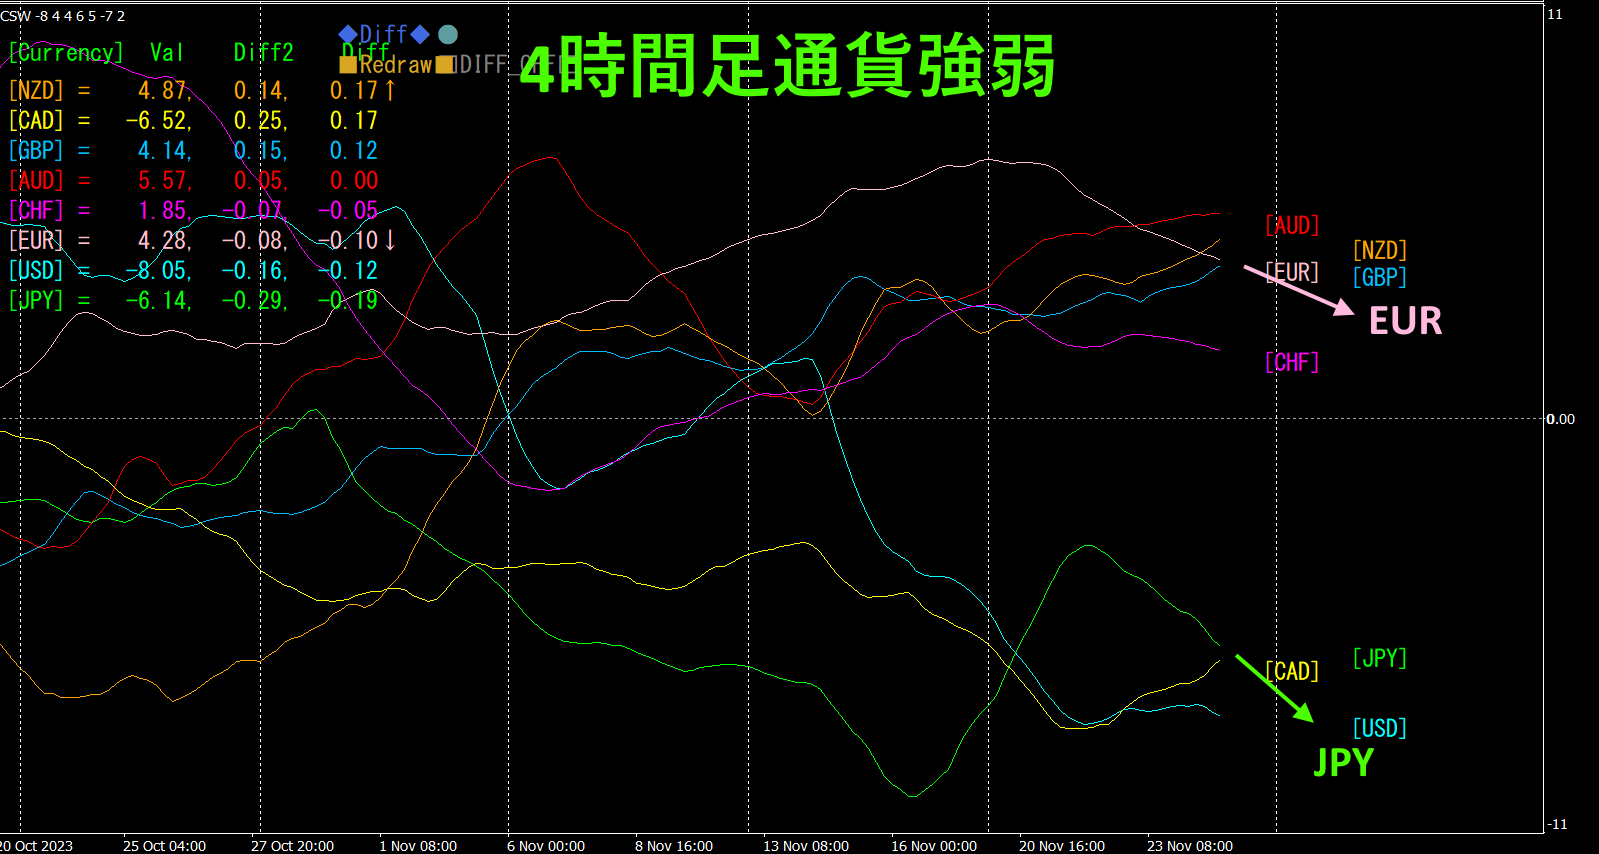
Pink isEUR, green is.JPYEUR is also moving down, butJPY is moving down more steeply than EUR.
4. Search the whole currency set for peaks and troughs and formulate a trend strategy (target: NZDCHF))
Using the “天底Search Indicator and selecting NZDCHF as the pair located at the bottom, aiming for a rebound from the bottom.
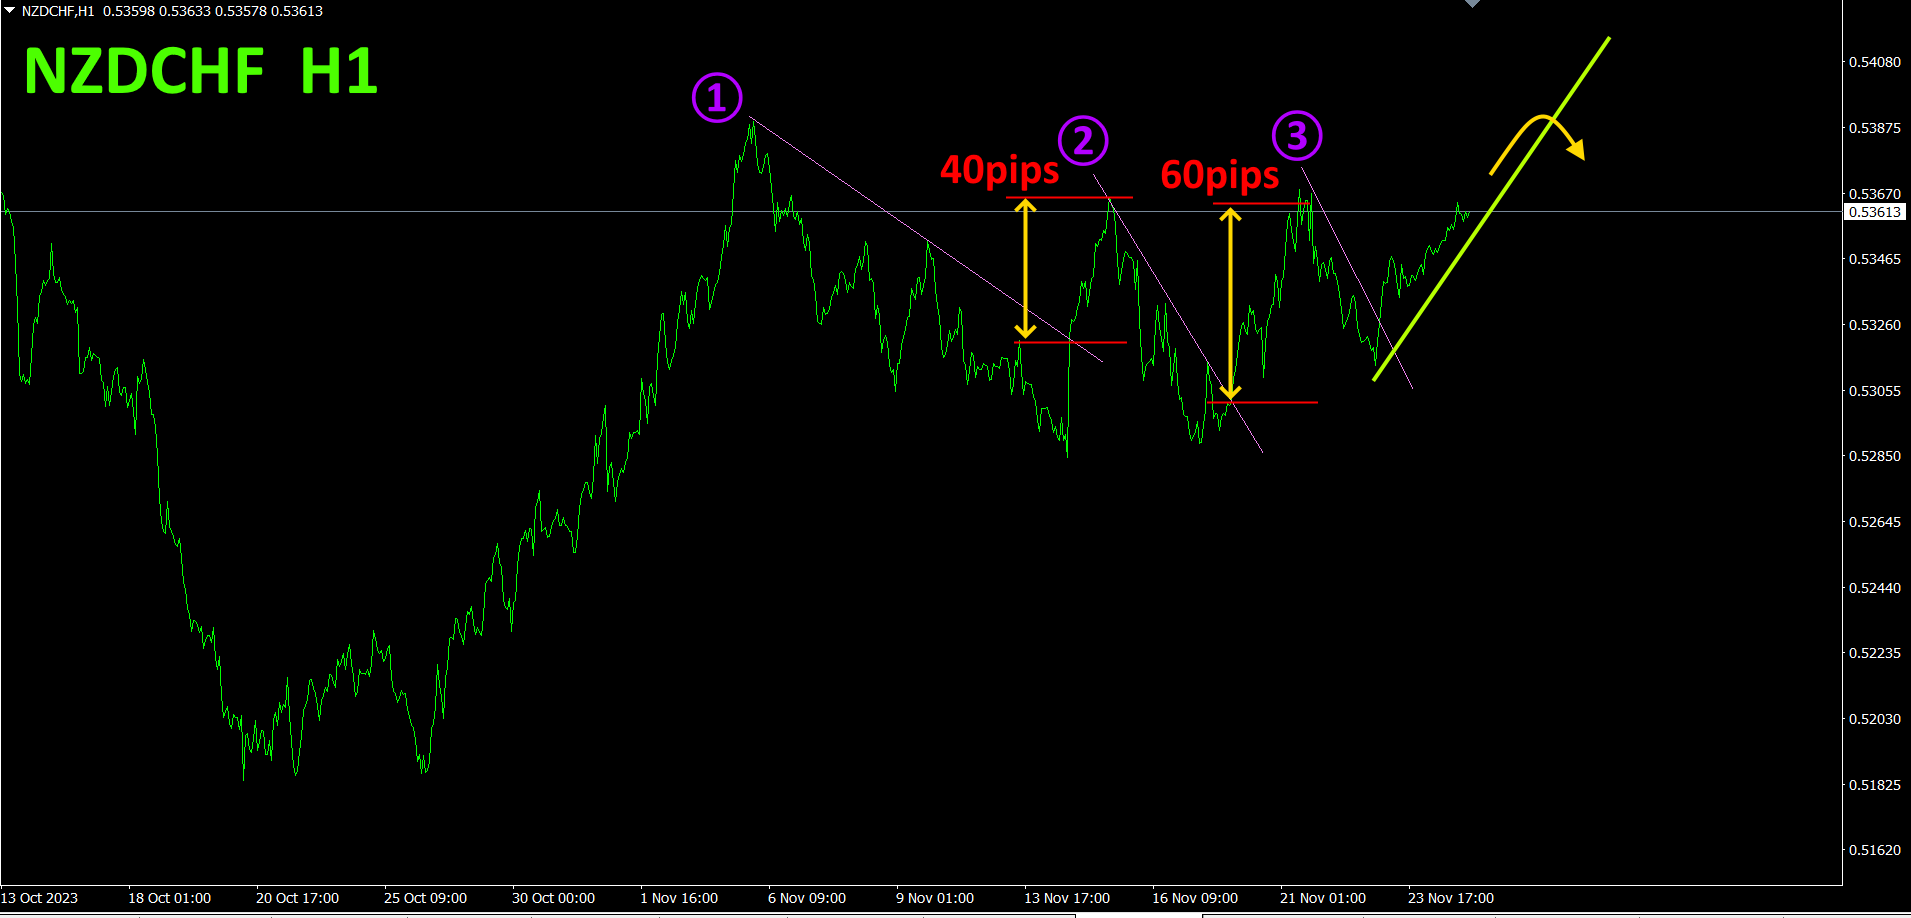
1st, 2nd, 3rd breakpoints on the downsloping lines are bought when broken upward, and closed when the rising line is broken downward. At ①,40pips; at ②,60pips; total profit100pips is achieved. Currently, I hold a long position and plan to close if the rising trend line is breached as shown by the yellow arrow. Focus on buying and continue trading.
Refer to the 4-hour timeframe currency strength chart.
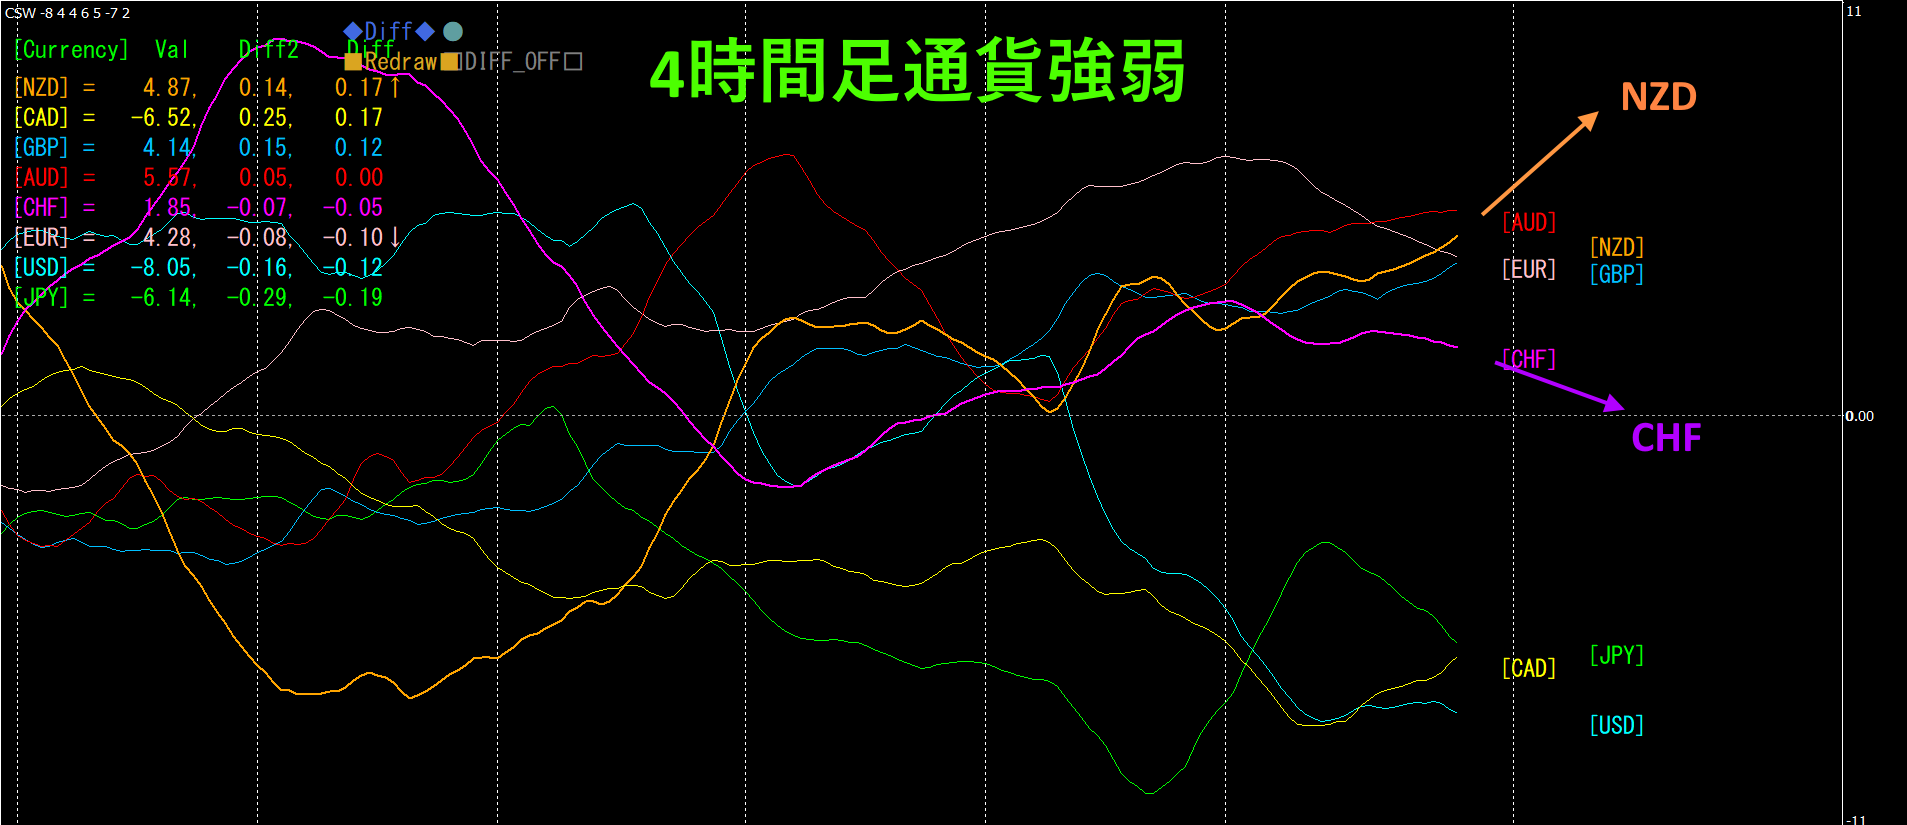
Red-purple isCHF, orange isNZD.NZD has clearly turned upward. Meanwhile,CHF is downward. Going forward, the gap between NZD and CHF is likely to widen, so NZDCHF is expected to continue rising. Since I hold a long position, I can enjoy paper profits increasing for a while as I trade.
【Bonus】
NZDCHF chart and currency strength chart (showing only NZD (orange) and CHF (red-purple); other currencies are hidden) drawn on a single graph.
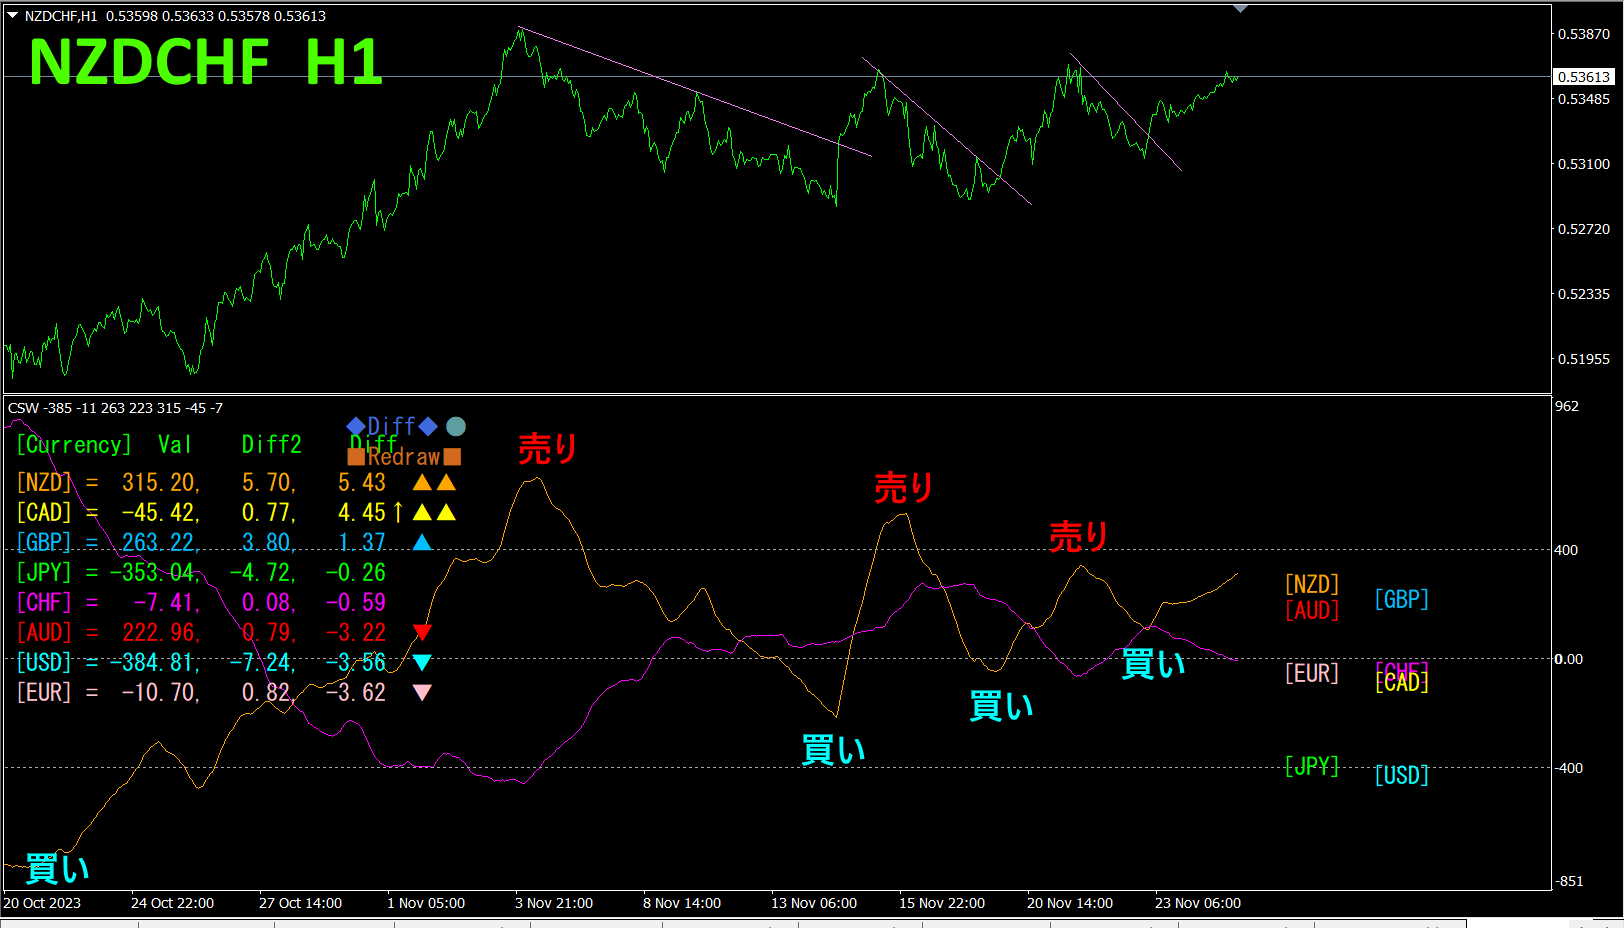
NZD andCHF’s currency strength forms a remarkably perfect“inverse correlation”. If you are greedy, you might even try chasing both buy and sell via reverse trades.
“Find beautiful charts through inverse correlation!” is the key to trading mastery.
Semi-automaticEA’s “Trend Line EX” allows drawing diagonal down-sloping lines for automatic buy when broken upward, and automatic exit when the rising line is breached, enabling a passive trading style.
※“”

https://www.gogojungle.co.jp/tools/indicators/42257
“8C Currency Strength Visualization Indicator”
If you are interested in theMT4 currency strength visualization indicator, please refer to the following pages. version https://www.gogojungle.co.jp/tools/indicators/39150
MT5 version https://www.gogojungle.co.jp/tools/indicators/39159
【My listed products】


