

Use of the “Visualization Indicator” (Part 121)
“Visualization Indicator” usage (part121)”
1. Further evolve the “28 Currency Pairs List Indicator” into an indicator
“8CPVisualization Indicator”to drawAUDUSD.
There are versions: Oceania版、London版、NewYork版、AnyCP edition. This time, the Oceania version was used.
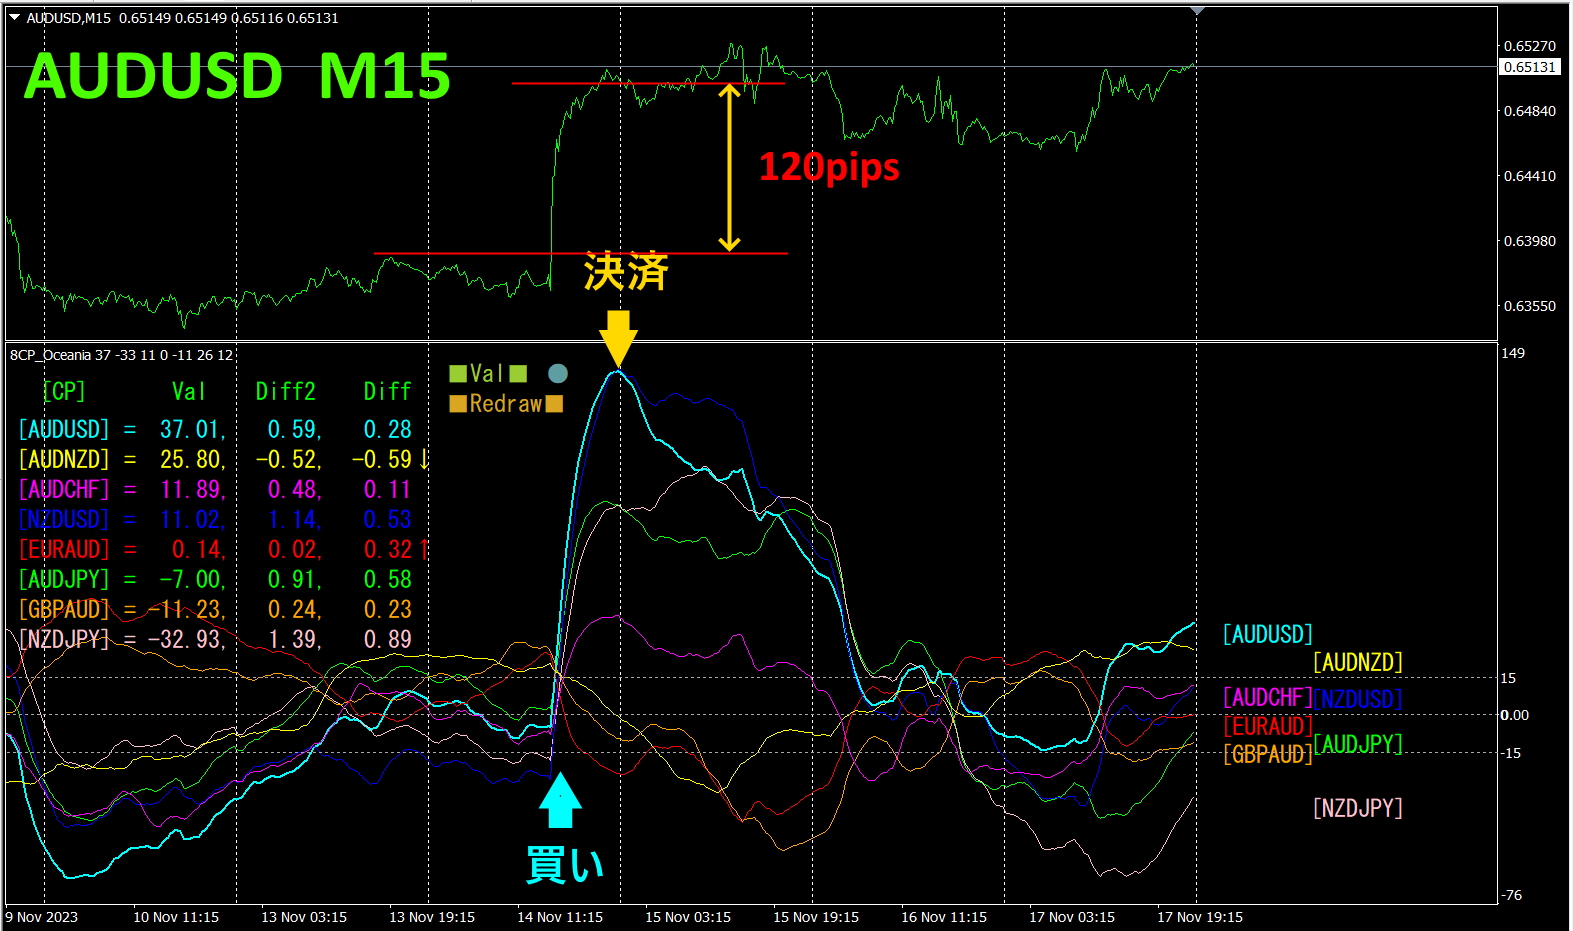
The upper half is a 15-minute chart ofAUDUSD. The lower half is from the “8CPVisualization Indicator.” The light blue bold line graph corresponds toAUDUSD.
On Tuesday, AUDUSD jumped above the chart group, so I entered a buy. It peaked on the day, so I closed the position.About120 pips of profitwas obtained. With the “8CPVisualization Indicator,” you can trade by focusing only on the most volatile currency pairs’ divergence/convergence.
2. Best SelectTry the Indicator
The following figure is a screenshot taken on2023 year11 month14 day22:30 (JST)
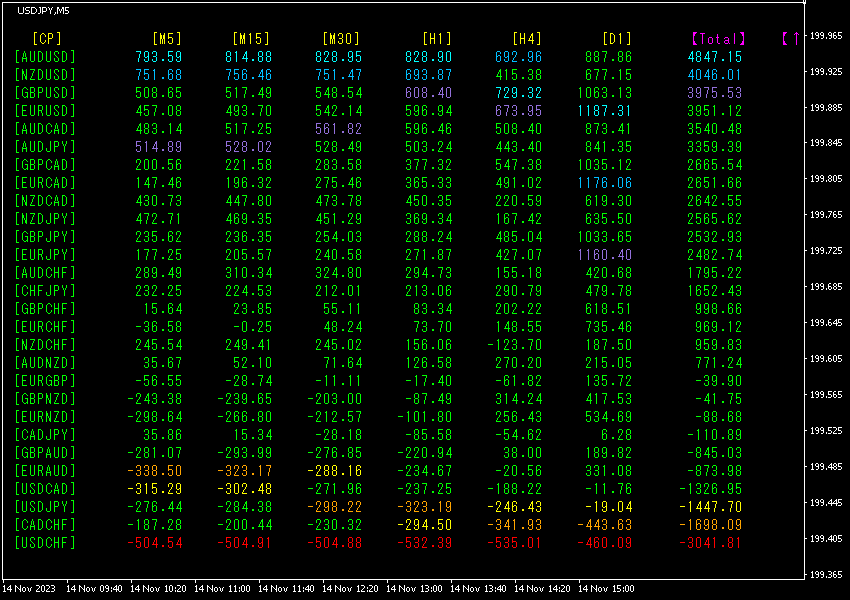
Total values are sorted in descending order. The lowest line,USDCHF, is red across all timeframes, and theTotal-3041.812 value is, a large negative number.This indicates a strong downtrend in USDCHF.
Now, let’s look at the chart ofUSDCHF.
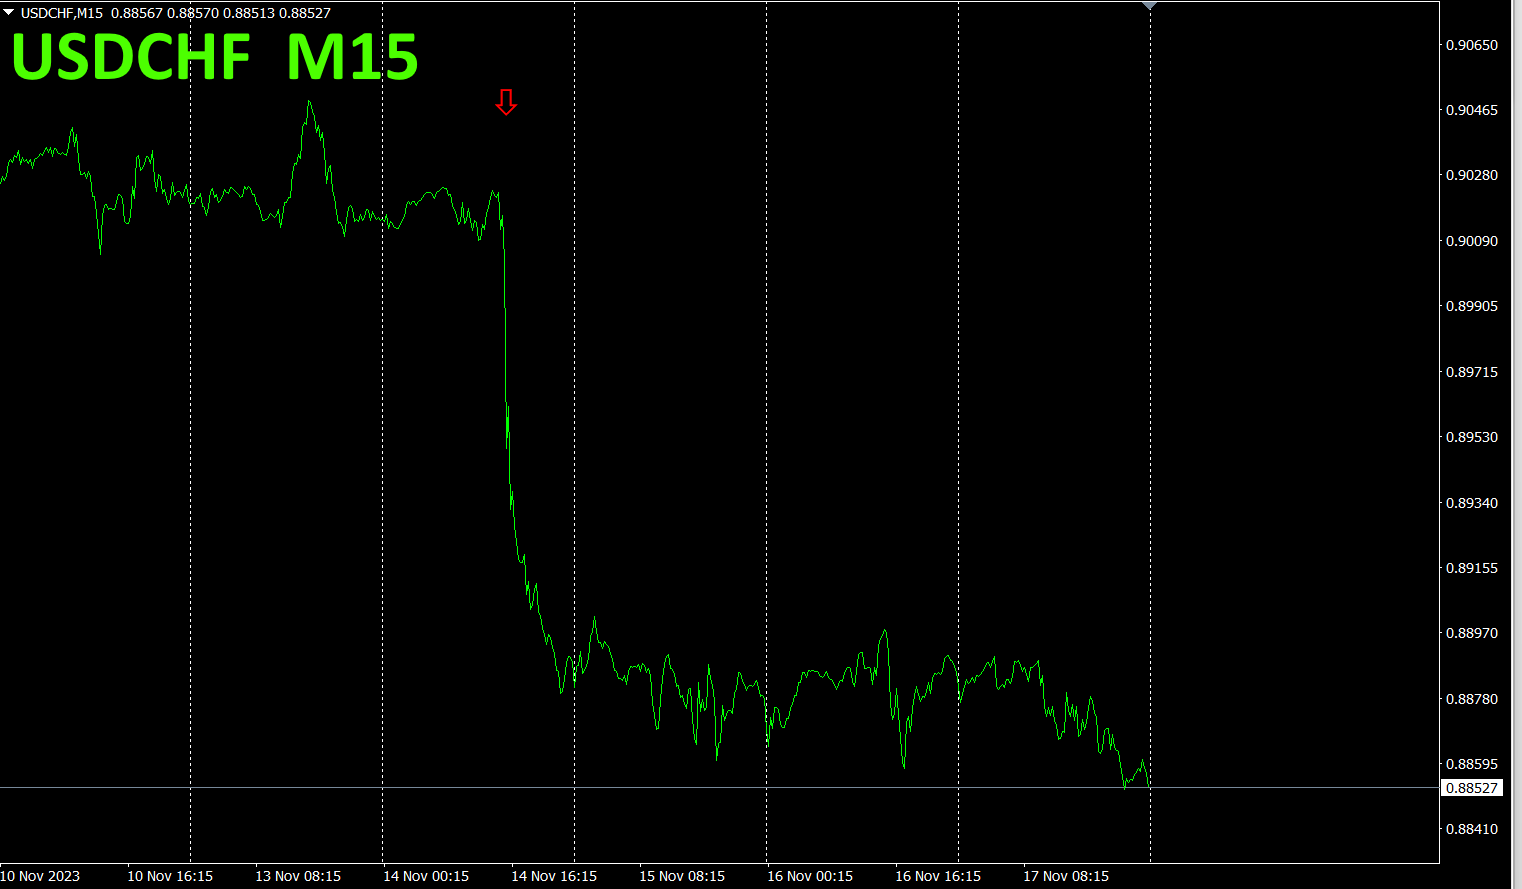
The red arrows mark the point where the screenshot was captured. It accurately captured a sharp decline. If you had sold from here, you could have earned about155pipsby the weekend.
The “28 currency pairs Best Select indicator makes it easy to identify which currency among the 28 pairs is currently exhibiting the strongest trend. It also tells you whether you should trade now with numbers and colors. It’s an excellent indicator for judging the overall movement of all currency pairs at a glance.
“28 currency pairs Best Select
https://www.gogojungle.co.jp/tools/indicators/35128

3. What happened to EURJPY, which I have been following since May of the year before last?
Since May2021, I have been tracking EURJPY.
To view the overall trend, I have drawn roughly the last three weeks on a 30-minute chart.
Last time, I wrote the following.
is rising, but is flat. EURJPY is expected to rise.
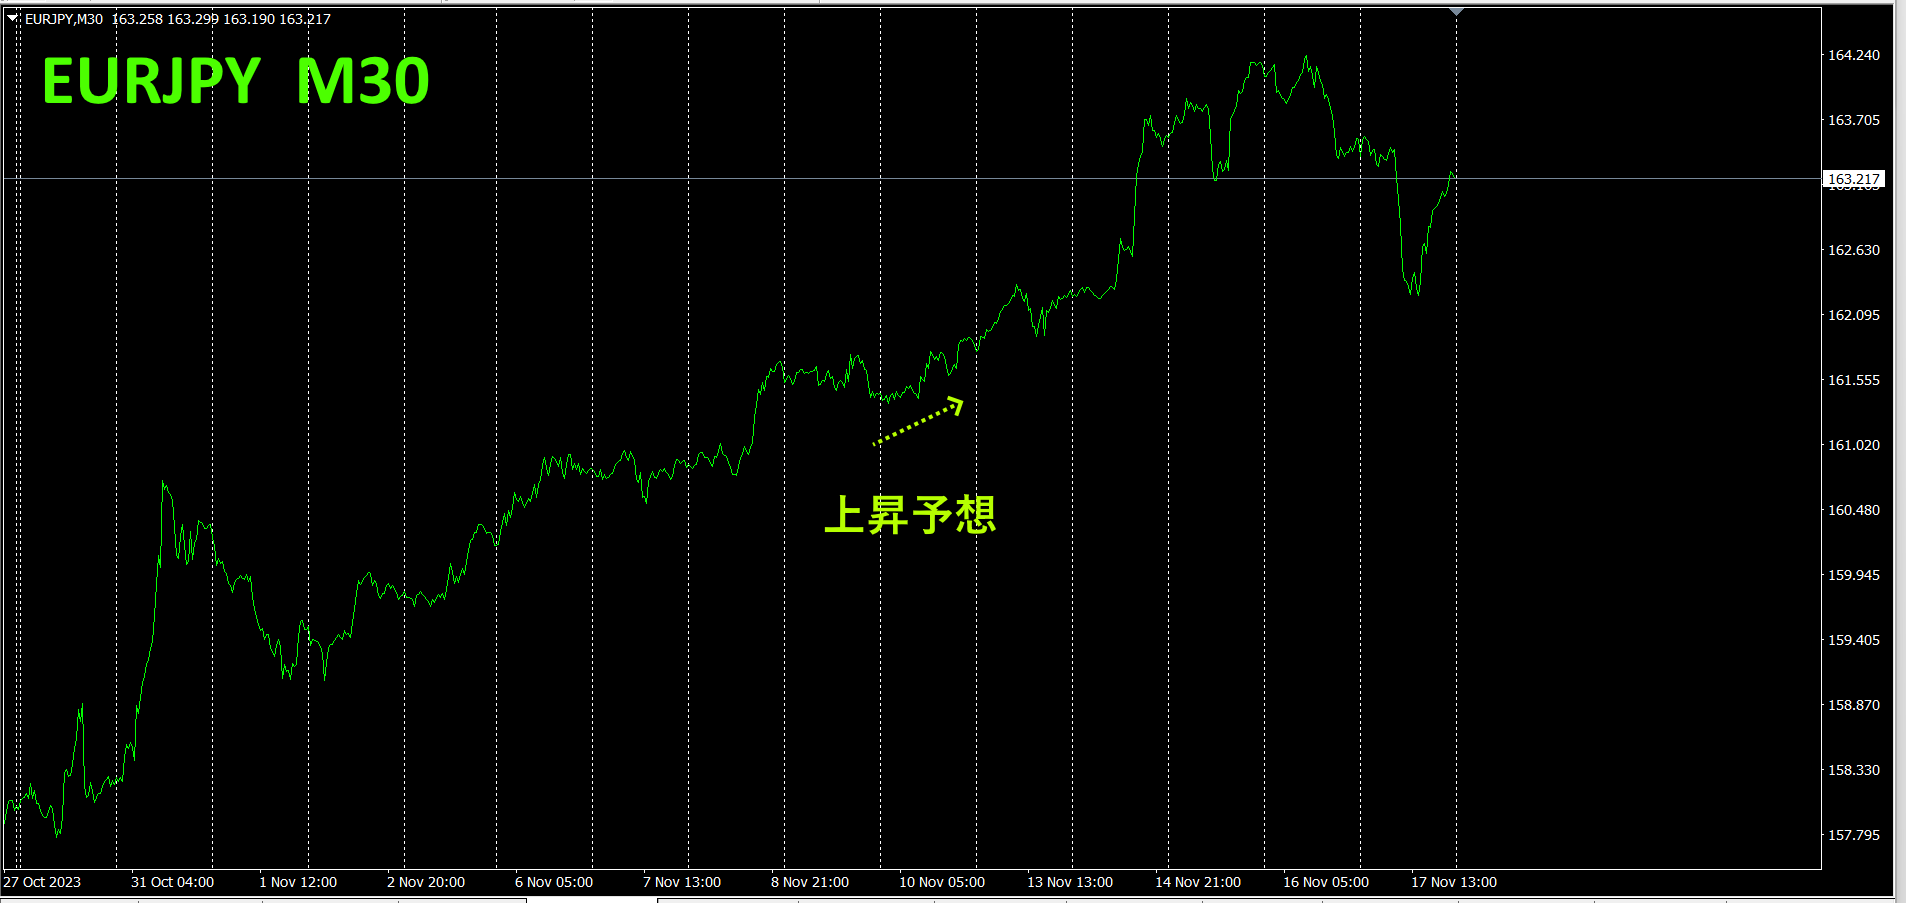
As predicted, it rose.
4Timeframe currency strength chart.
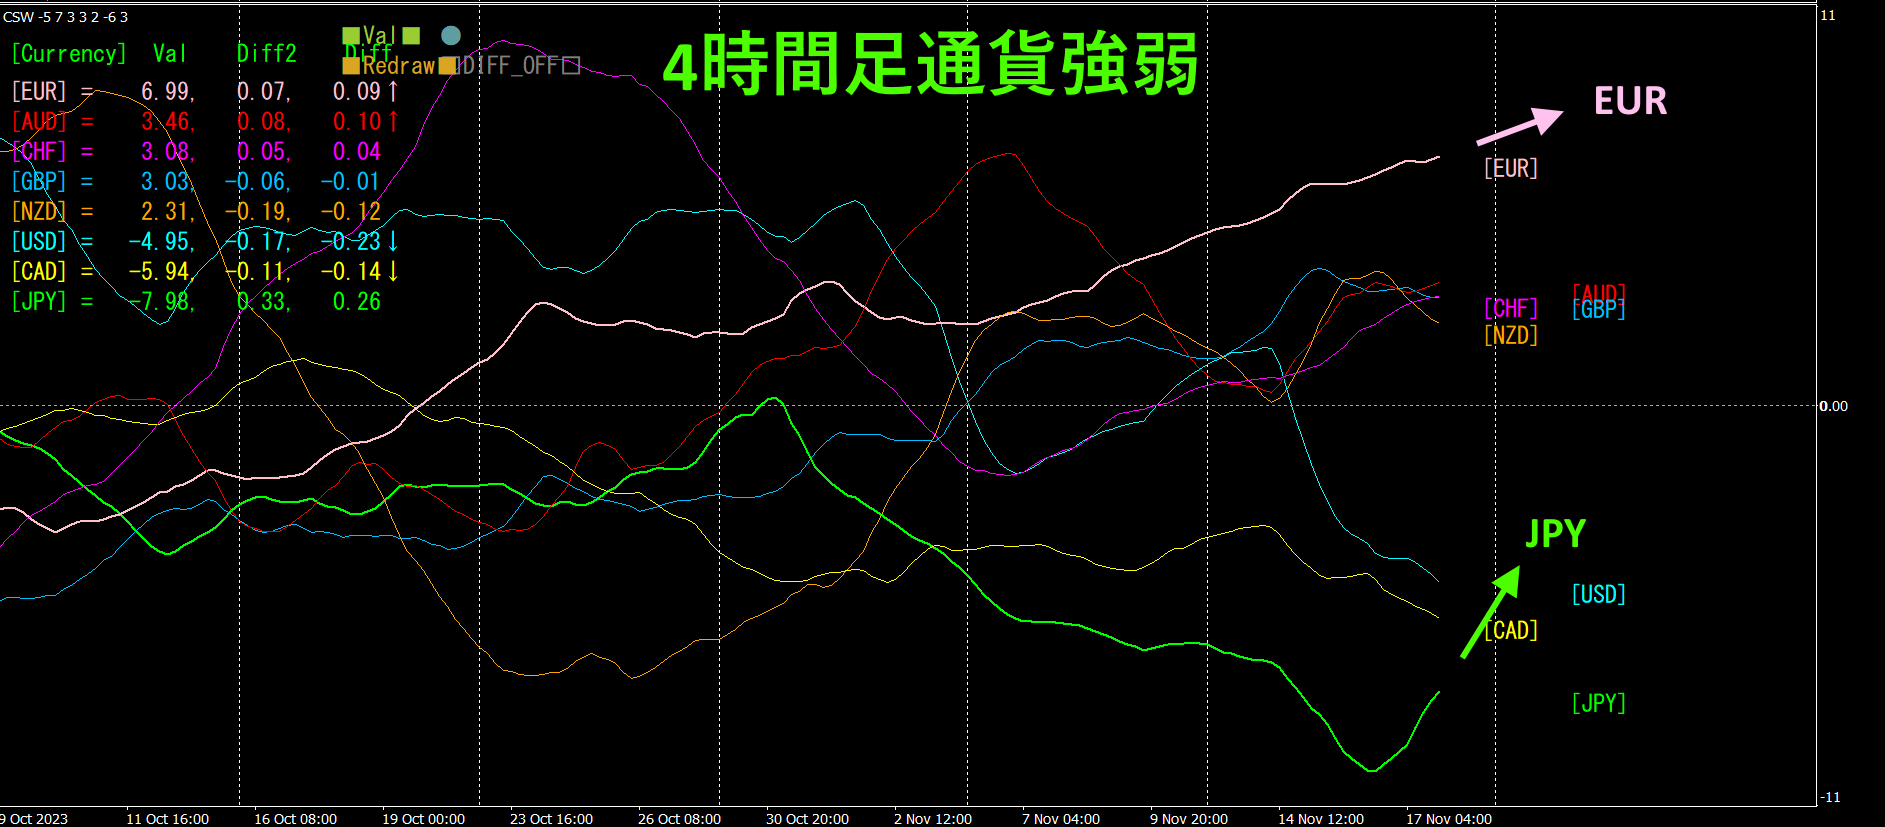
Pink isEUR, green is has risen, butJPY.EURJPY is rising at a steeper angle than EUR.Timeframe currency strength chart indicates that EURJPY is expected to fall in the future.
4. Find bottoms and tops from all currency pairs and form a trend strategy (target isNZDCHF)
Previously,2505“Bottom Search was used, and the next new target chosen wasNZDCHF. I’m aiming for a rise from near the bottom.
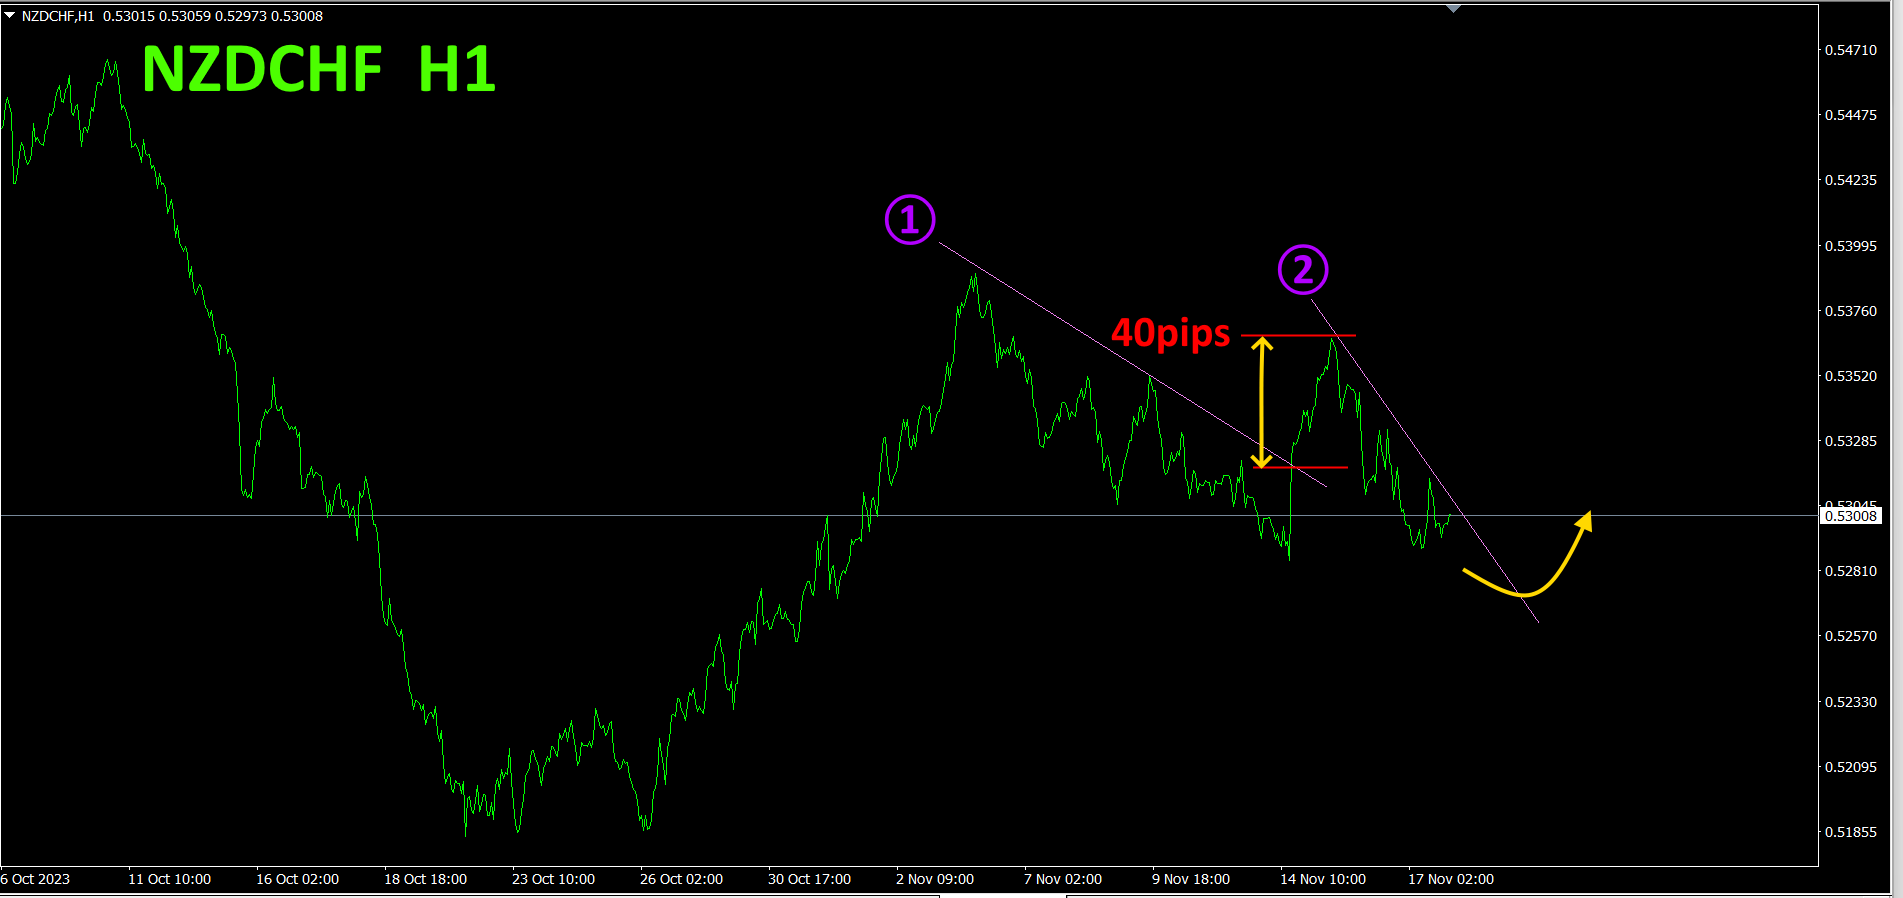
When the first down-sloping line was breached, I opened a buy position, but I only captured about40pips and it fell. I will draw the second down-sloping line and wait for a breach to occur. Focus only on buying.
Refer to the four-hour currency strength chart.
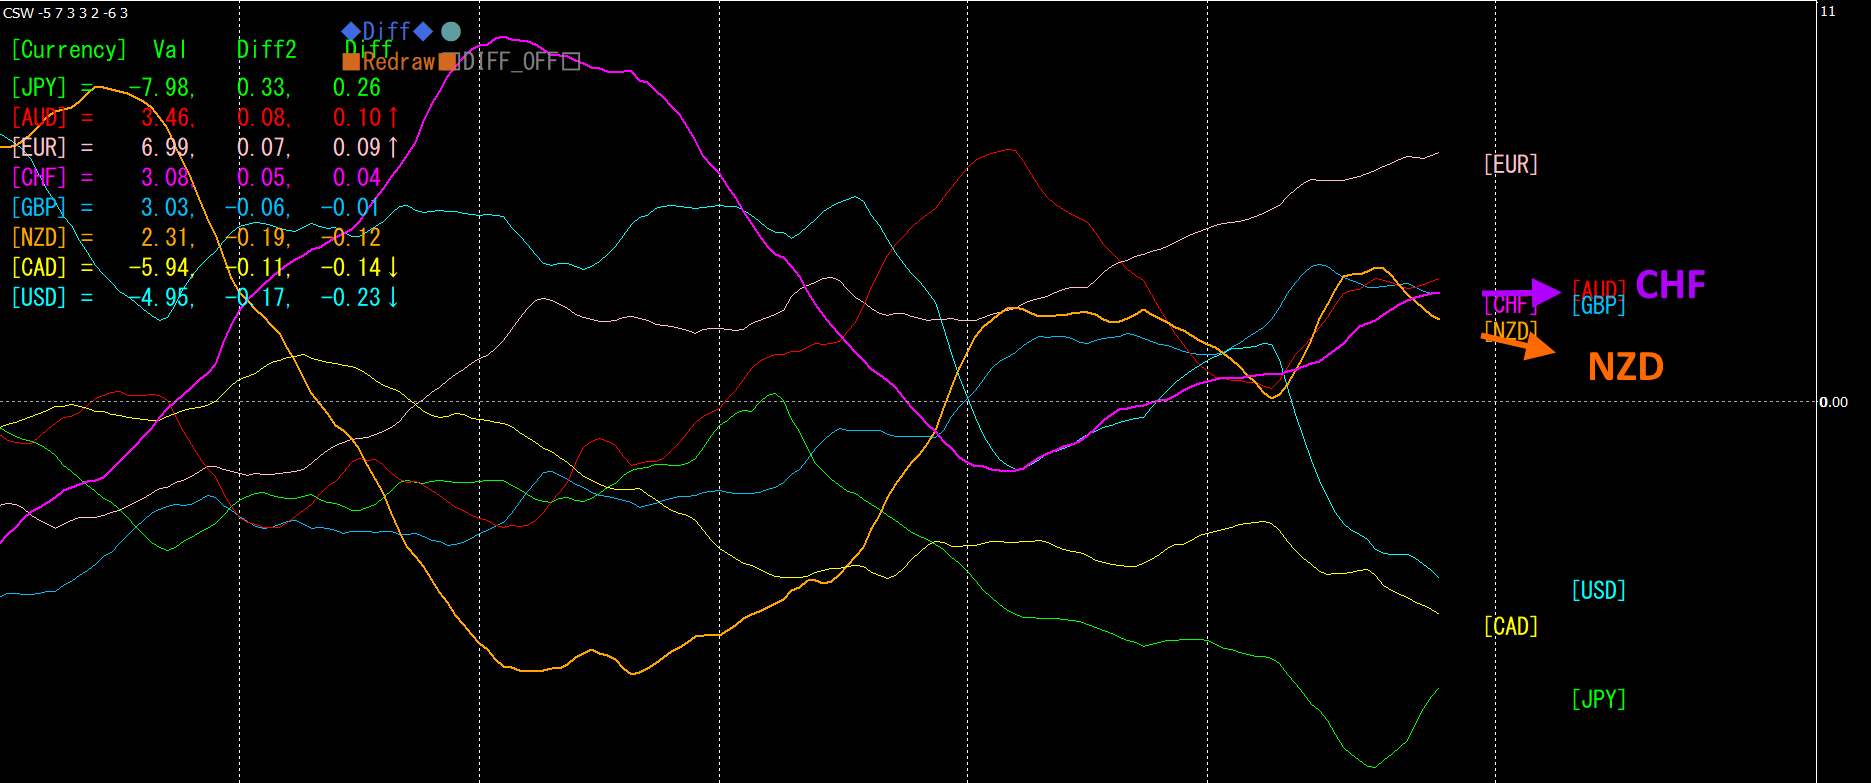
Red-purple isCHF, orange isNZD. The chart lacks a clear direction, but currentlyCHF is slightly upward,NZD is downward, soNZDCHF is expected to fall. After some time, whenCHF turns downward andNZD turns upward, I will enter a buy.
With a semi-automaticEA, the “Trend Line EX” allows you to draw a slanted down line and automatically buy when breached, and automatically close when the rising line is breached, providing a set-and-forget style of trading.
※“Trend Line EX

https://www.gogojungle.co.jp/tools/indicators/42257
“8Ccurrency strength visualization indicator”
MT4 version https://www.gogojungle.co.jp/tools/indicators/39150
MT5 version https://www.gogojungle.co.jp/tools/indicators/39159
【My listed products】


