

Use of "Visualization Indicators" (Part 120)
Usage of the " Visualization Indicator" (its120)
1. Further evolve the "28 Currency Pairs List Indicator" into an indicator
“8CP Visualization Indicator”to plotGBPUSD.
The “8CP Visualization Indicator” includesOceania version,London version,NewYork version,AnyCP version. This time, we used theLondon version.
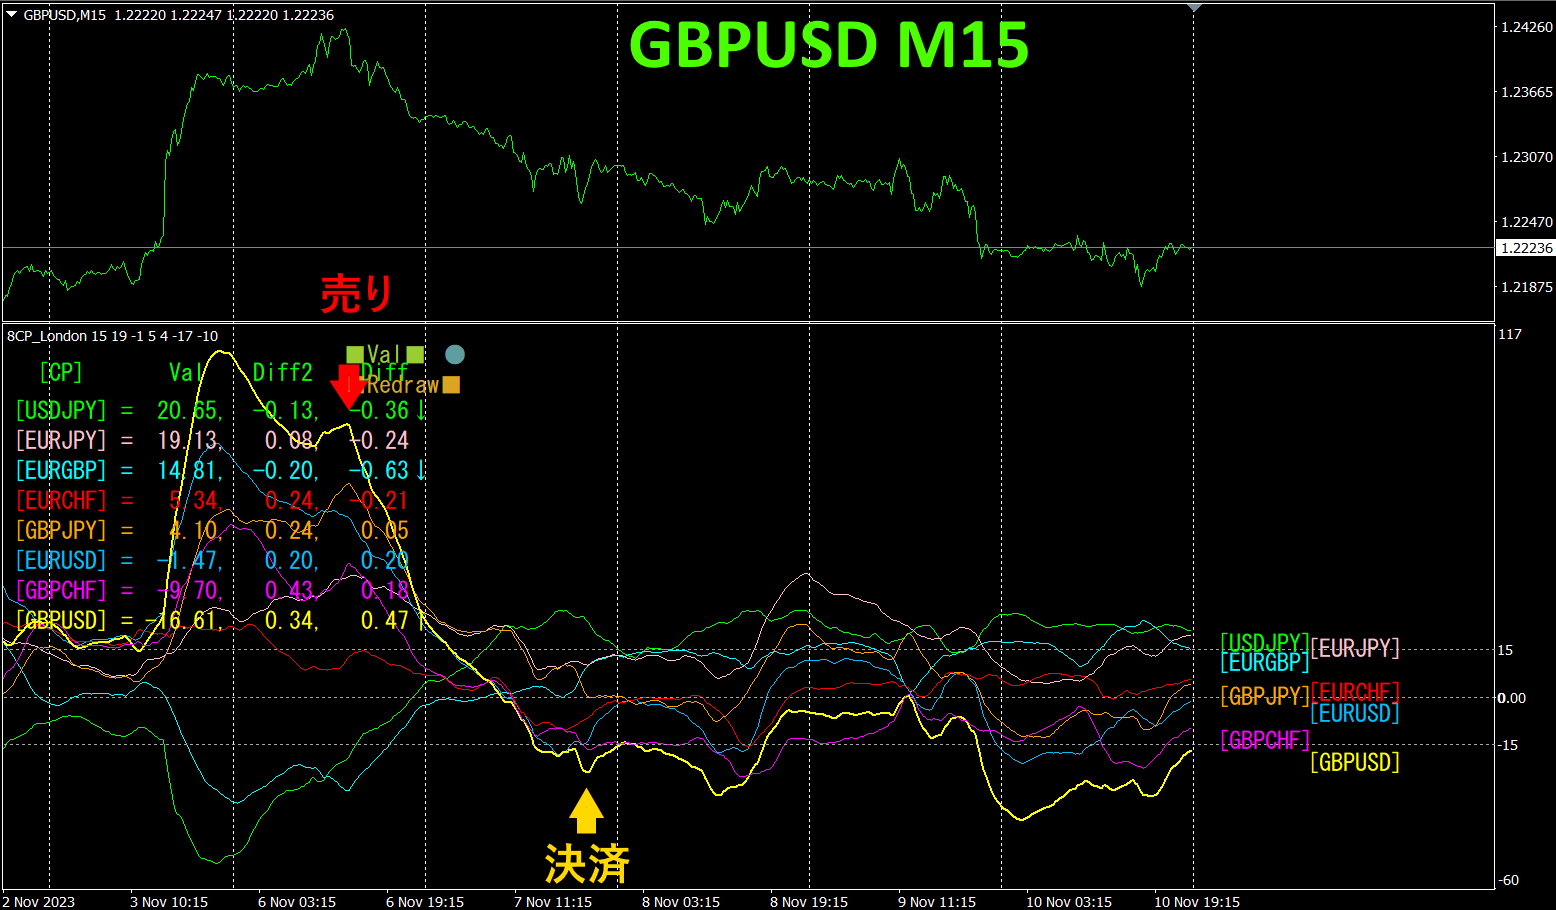
The upper half is the 15-minute chart ofGBPUSD. The lower half is from the “8CP Visualization Indicator”. The yellow bold line graph corresponds toGBPUSD.
On Monday, sinceGBPUSD moved from the positive region toward a decline,GBPUSD was sold. I will close the position at Tuesday’s low.About150pips of profitwas obtained. With the “8CP Visualization Indicator”, you can focus trades only on the currency pairs with the largest movement and the widest deviation/convergence.
2. Best SelectTry the indicator
The following chart is a screenshot taken onNovember,092023 at 00:40 (JST)..
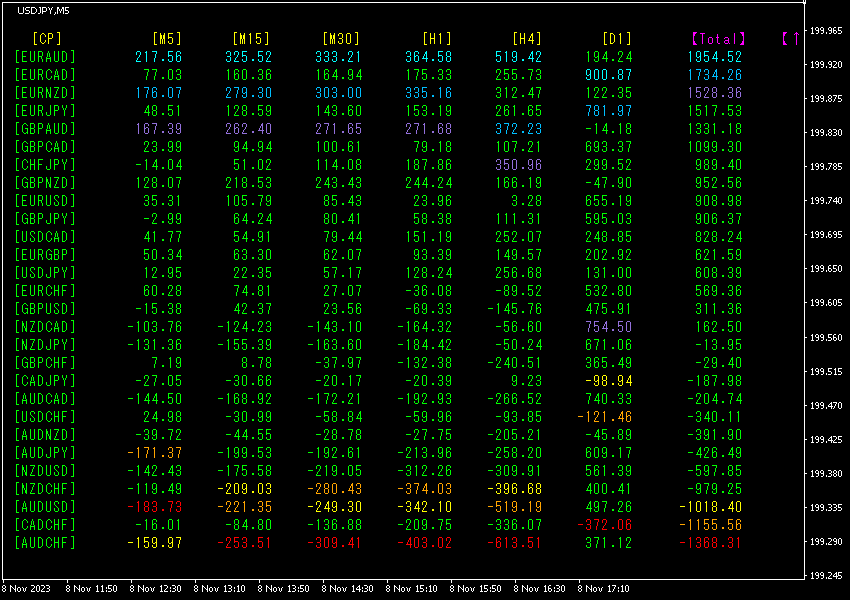
Totalnumbers are sorted in descending order. The top row’sEURAUD shows[D1], excluding all timeframes, in a blue-toned color, and theTotalvalue is1954.52, a positive figure.EURAUD indicates a strong upward trend.
Now, let’s look at theEURAUD chart.
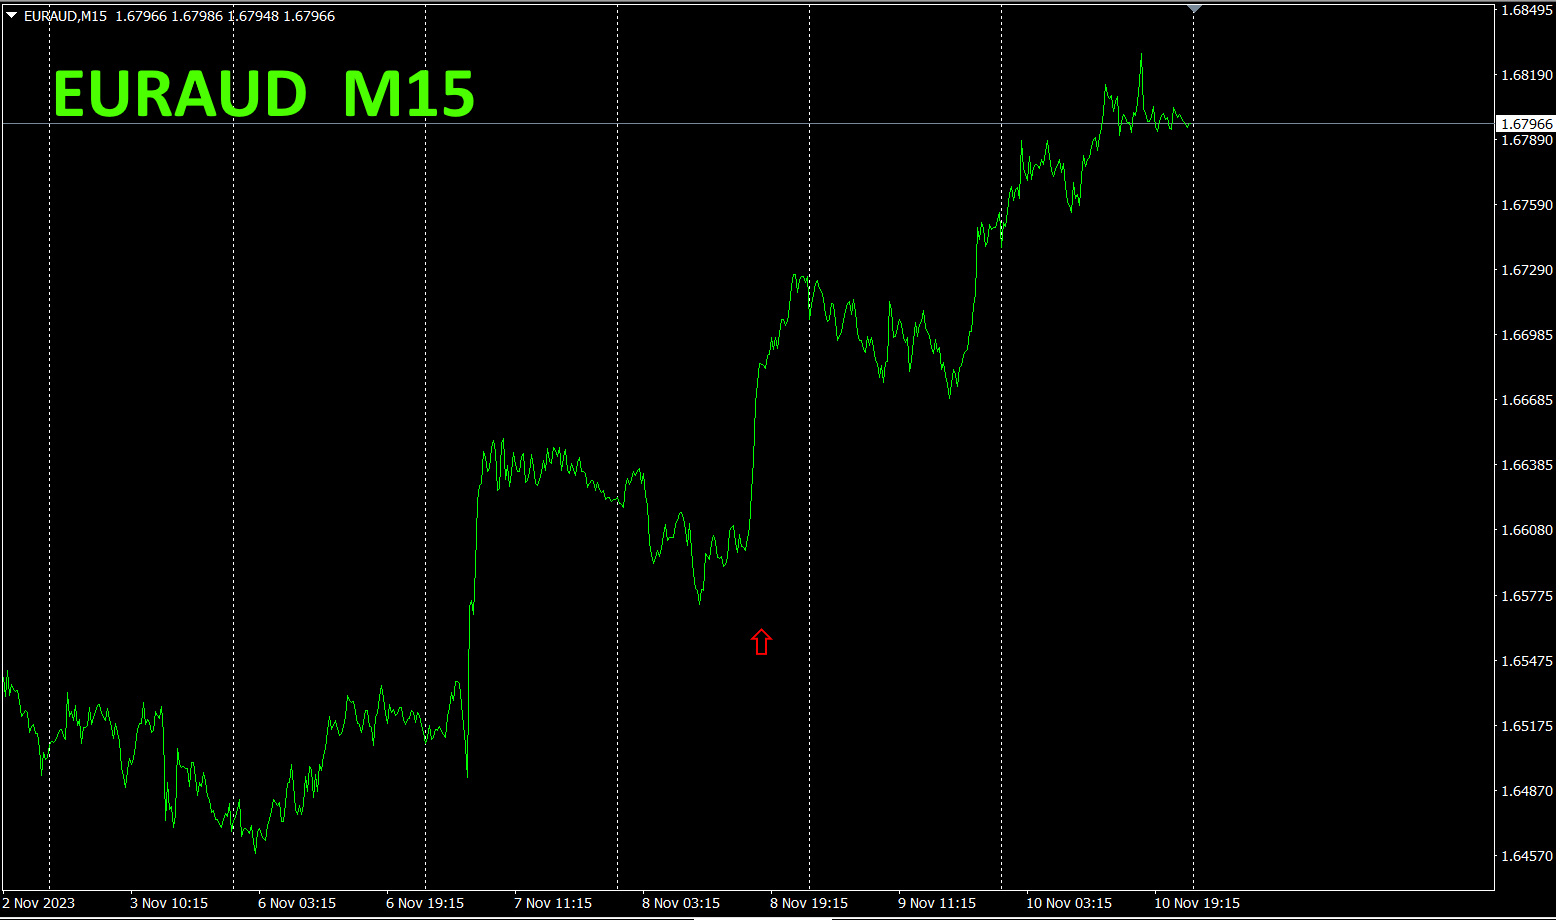
The red arrows mark the captured screenshot point. It captures a spike in the middle of an uptrend that is rising to the right.28 currency pairs, showing whether it is the steepest rise, isEURAUD.
“28 currency pairs Best Select lets you easily identify which currency among 28 pairs is showing the strongest trend. It also tells you, with numbers and colors, whether you should trade now. It is a great indicator for judging the overall market at a glance.
“28 currency pairs Best Select indicator”
https://www.gogojungle.co.jp/tools/indicators/35128

3. Since May of the year before last, what happened with EURJPY?
2021 year5 month onward, has been tracked.
To view the overall trend, a 30-minute chart covering roughly the last weeks is drawn.
Last time, I wrote the following.
4From the hourly currency- strength chart, EURJPY is expected to rise in the future.
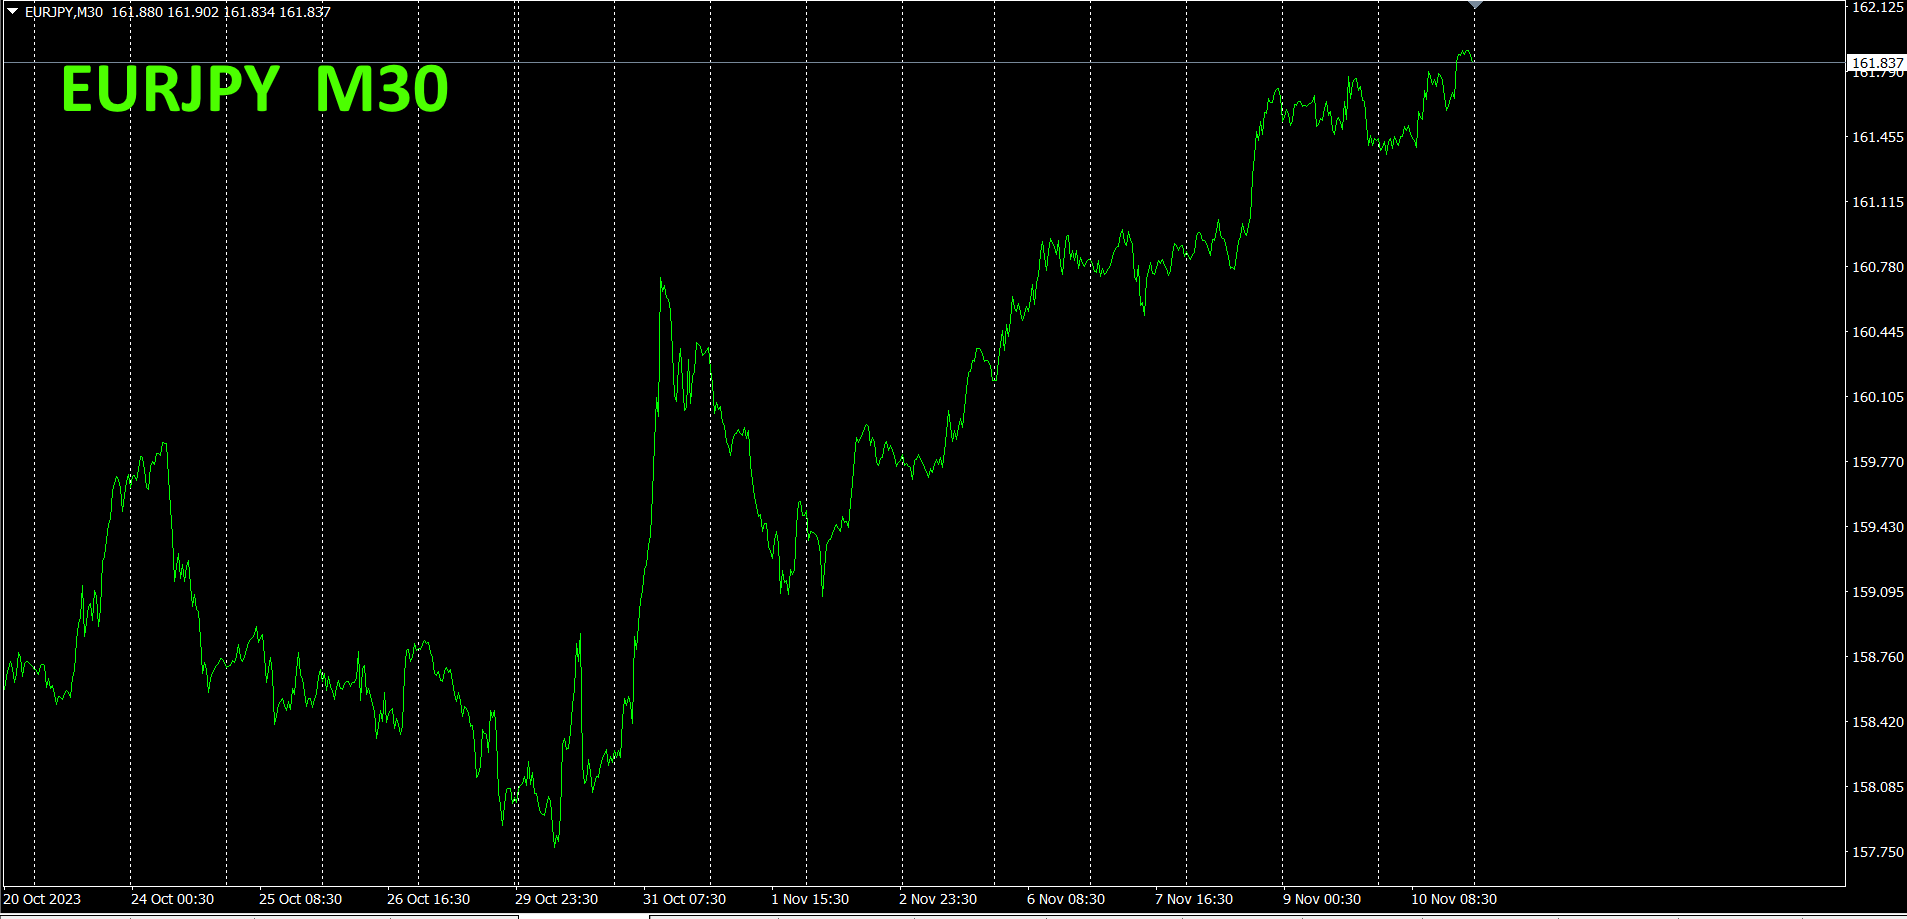
It is in an uptrend with a rising right shoulder.
4Hourly currency- strength chart.
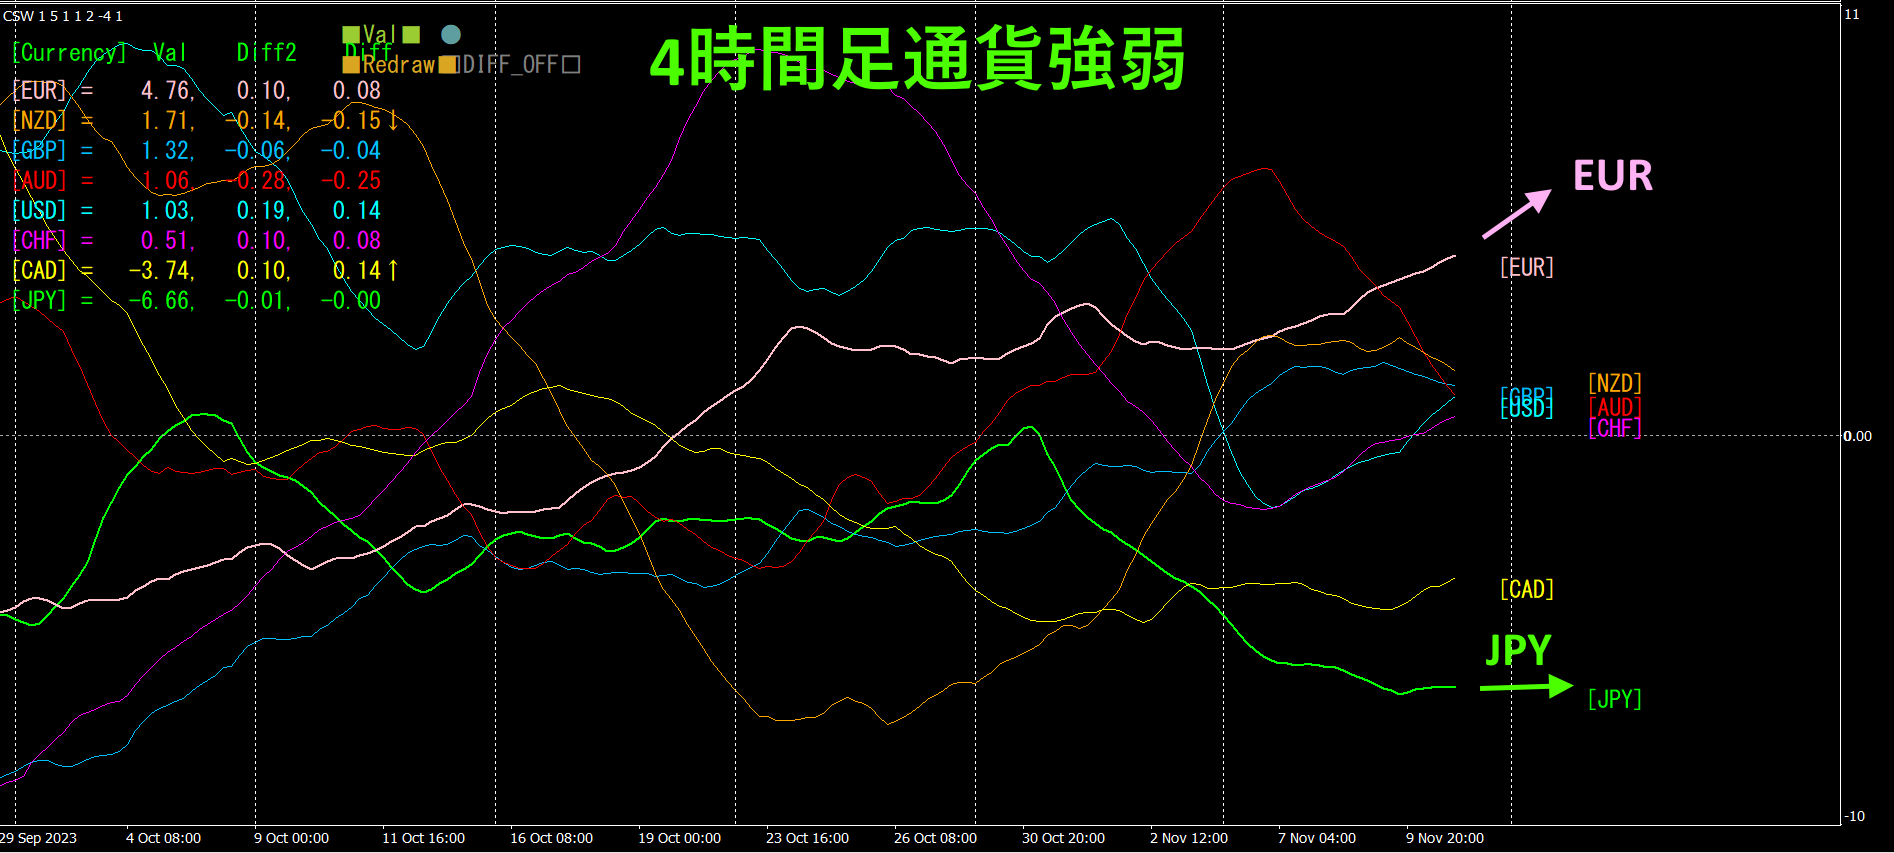
Pink isEUR, green isJPY. EUR is moving upward,JPY is flat. From the direction on the 4-hour chart, is expected to rise.
4. Find highs and lows across all currency pairs and form a trend strategy (target:NZDCHF).
2505“Trough-SearchIndicator”,I selected the next target,NZDCHF, aiming at a rise from the bottom.
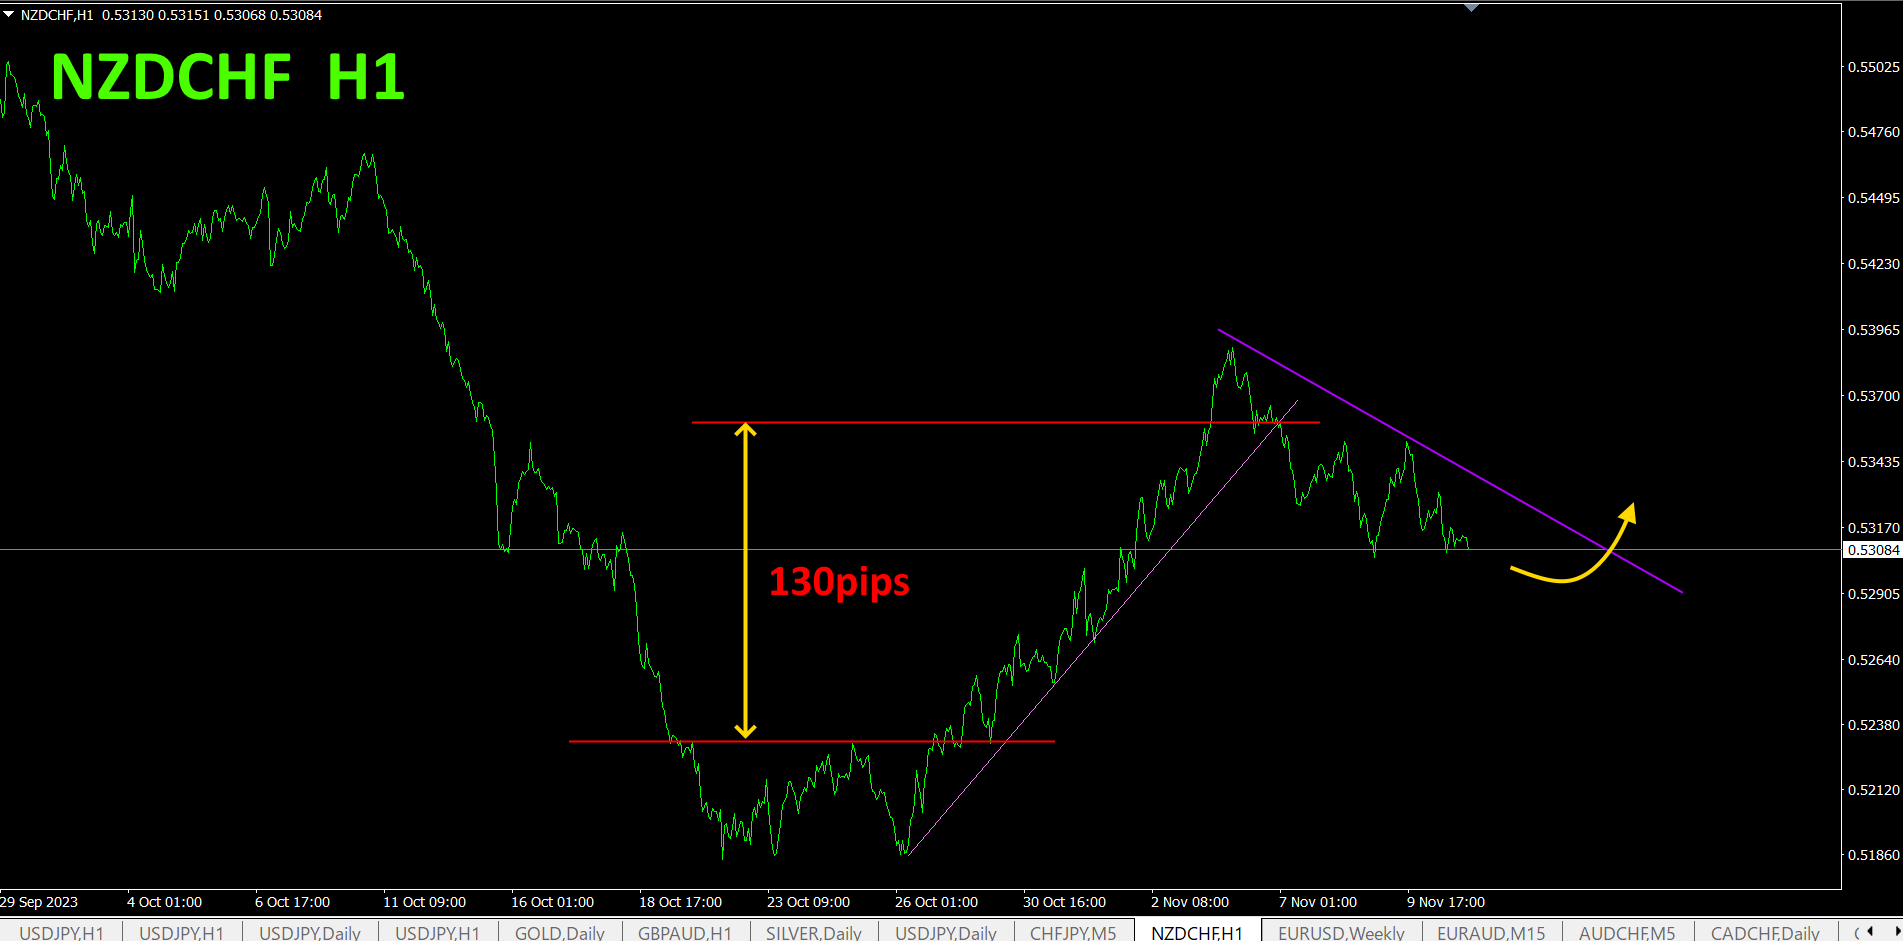
From Monday, it turned down. Since it broke the upward trend line, I took profits. Buying from the neckline yielded about130pips profit. Moving forward, I will draw a retrace line and if it breaks above, I will buy. Because it rose from a deep bottom, focus on buying only is sensible.
Refer to the 4-hour currency- strength chart.
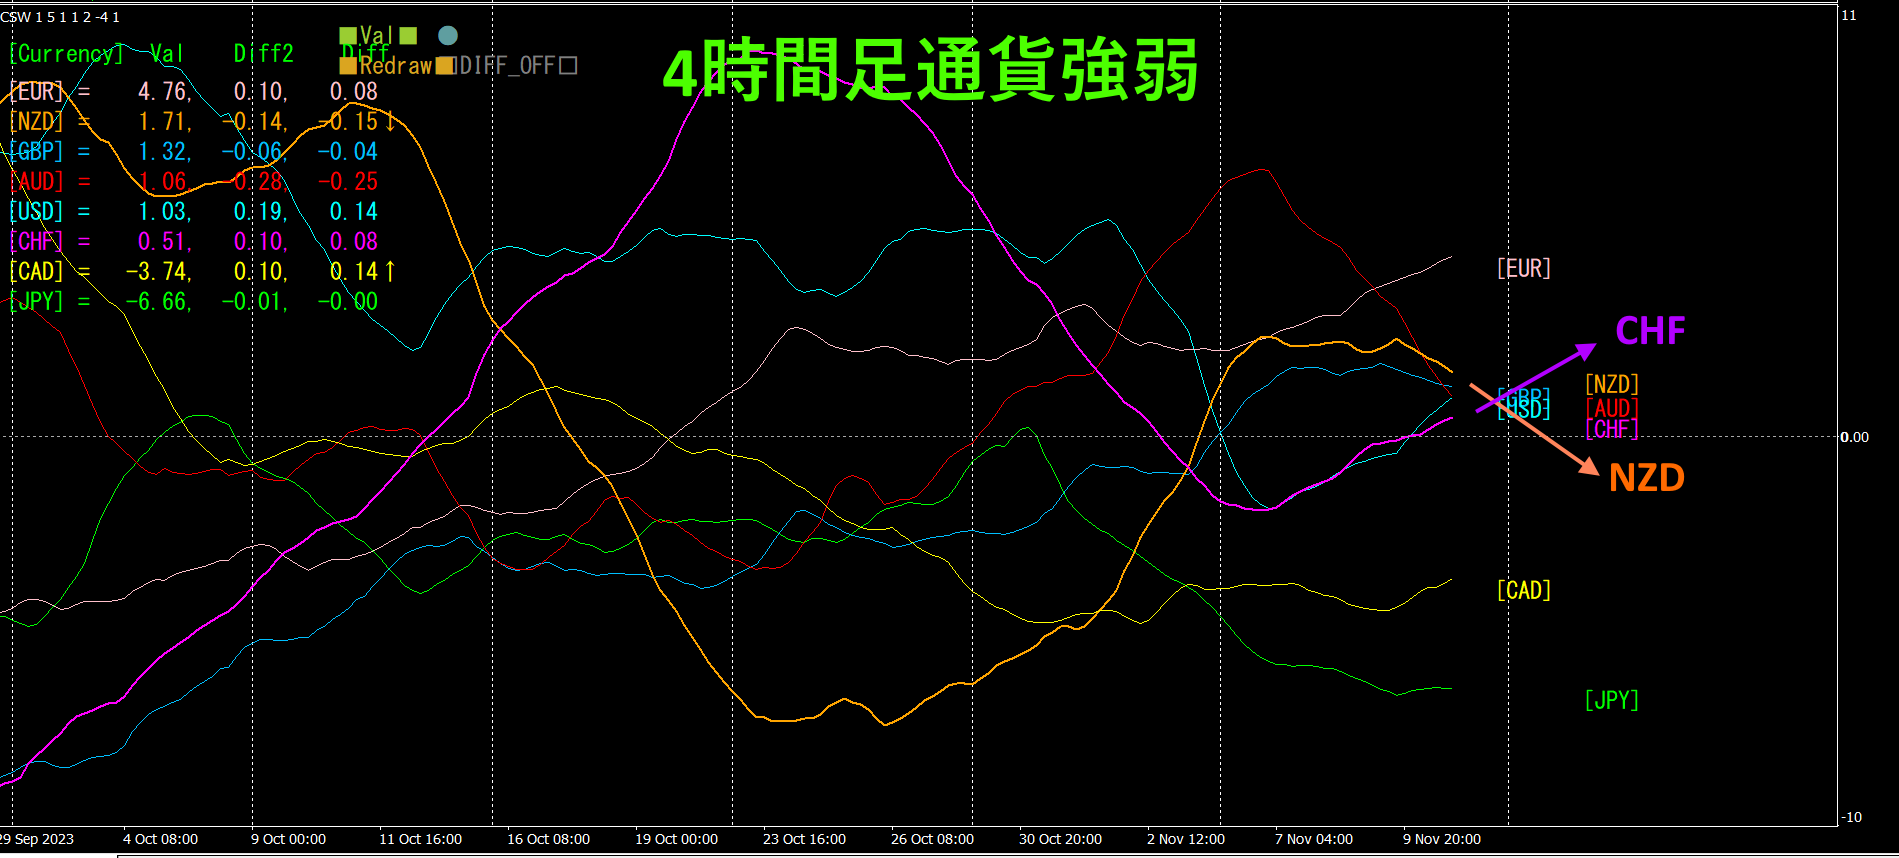
Red-purple isCHF, orange isNZD. For now,CHF is rising,NZD is falling, soNZDCHF from there.
Semi-automaticEA allows, with the, to draw an inclined downward line and automatically buy when it breaks above, and automatically exit when it breaks upward, enabling a passive trading approach.Trend Line EX
※“Trend Line EX”

https://www.gogojungle.co.jp/tools/indicators/42257
If you are interested in the “8C” currency strength visualization indicator, please refer to the following page.
MT4 version https://www.gogojungle.co.jp/tools/indicators/39150
version https://www.gogojungle.co.jp/tools/indicators/39159
【My items for sale】


