

[November 5, 2023] Chart analysis using the sky and earth indicators
Due to the impact of the employment statistics from the day before yesterday, there weren’t many good patterns, so this time there are a total of 5 currency pairs ( USD/CAD, CAD/JPY, USD/CHF, AUD/NZD, and Gold) discussed in chart analysis. I think a good shape will return from around Tuesday. I hope this serves as a reference for trading from tomorrow.
Table of Contents

・This article mainly consists of chart analysis and backtesting using the “Tento-ji Indicator”“Tento-ji Indicator”.
・The content is based on the use of the most accurate tool“15-minute + 4-hour simultaneous monitoring method”.
・This tool is a groundbreaking trading tool that can be used without understanding the traditional forex theories (Elliott wave, Dow theory, Grandville’s law, cycle theory, price action, Fibonacci, supports/resistance, channels, etc.).

The Tento-ji Indicator is a trading method that uses the original indicator developed by Abe-san, released in February 2022.
Thanks to everyone's support, we were awarded the“GogoJungle Award 2022”.
■ Tento-ji Indicator
https://www.gogojungle.co.jp/tools/indicators/35780
■ Tento-ji Mountain
https://www.gogojungle.co.jp/tools/indicators/37744
■ Tento-ji EA ~ Semi-discretionary Auto-Trade System ~
https://www.gogojungle.co.jp/tools/indicators/43213
■ Tento-ji Dashboard
https://www.gogojungle.co.jp/tools/indicators/46257
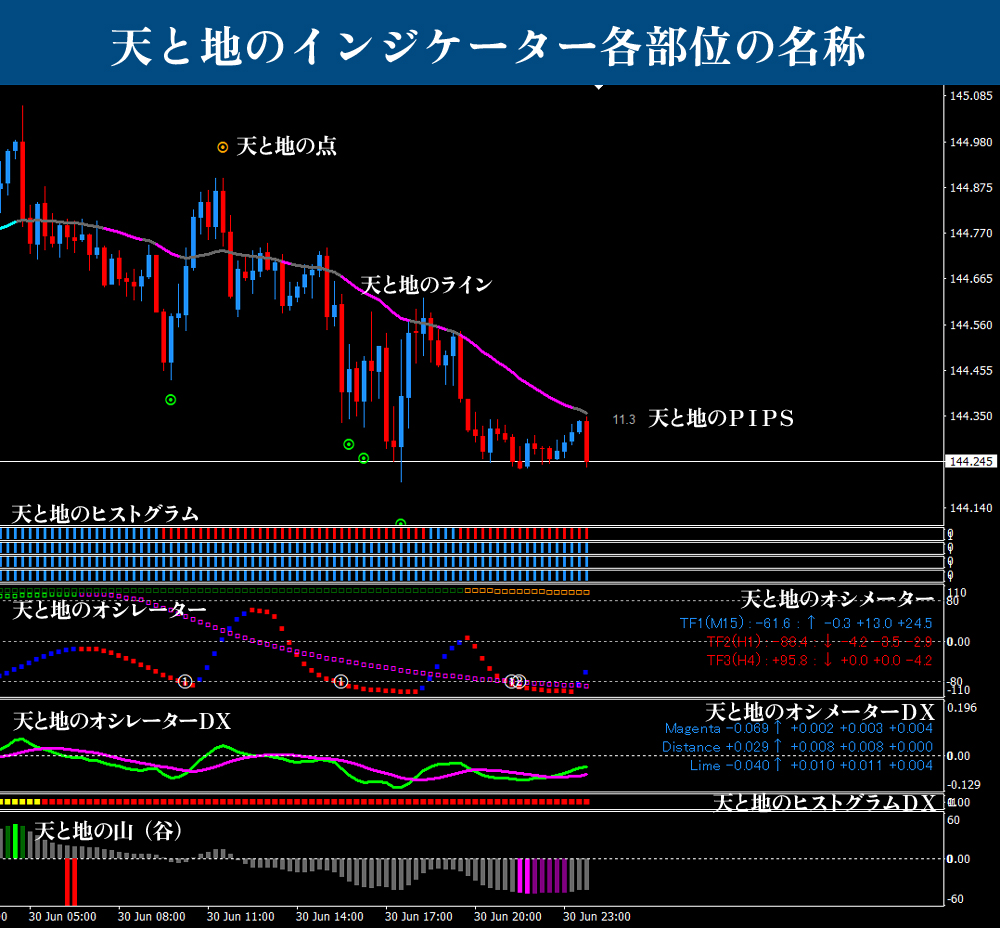
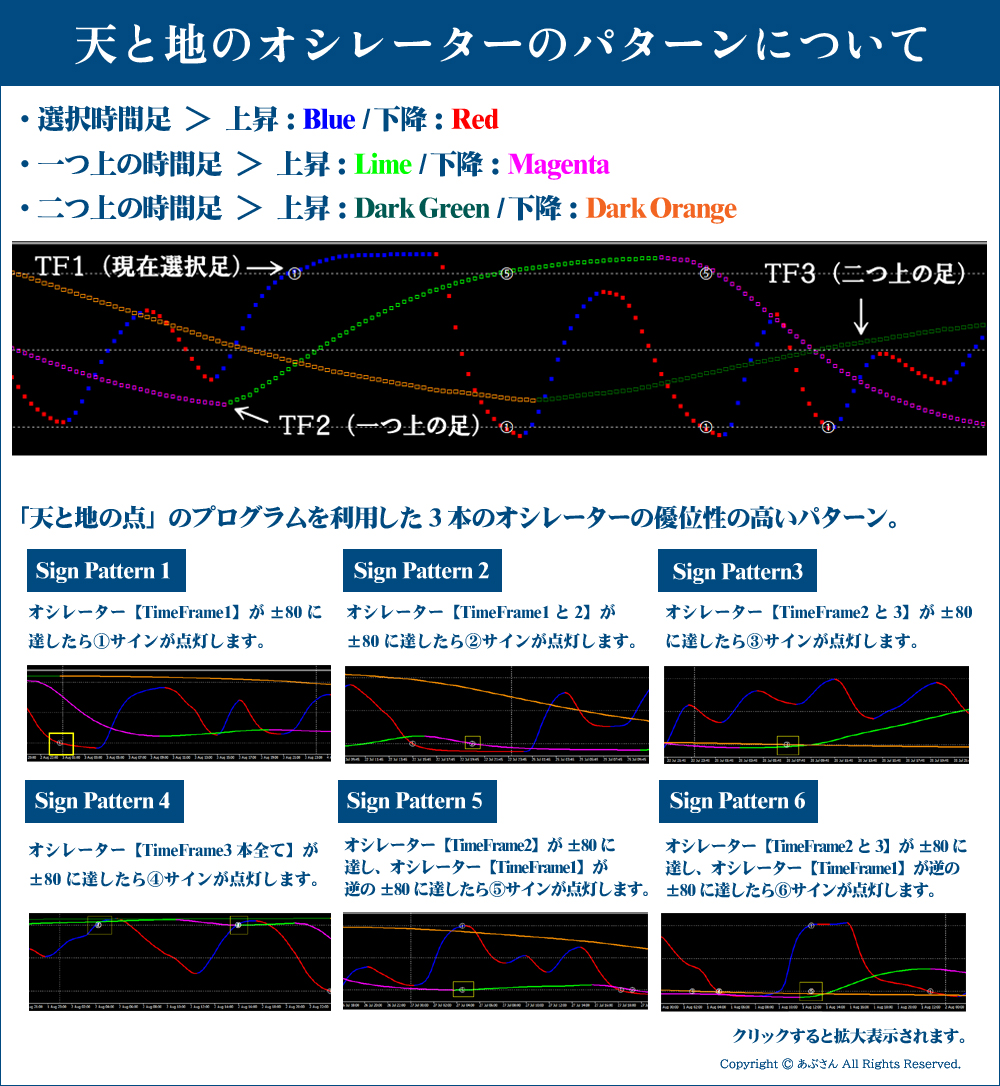
※For the specialized terms used in this blog, please refer to the following “Names of each part of the Tento-ji Indicator” and “Patterns of Tento-ji Oscillators.” If you have any other questions, please refer to the Tento-ji Indicator sales page. If you are already a user, just read the manual and you will be fine. Please refer to the descriptions on the pages for more details. If there are any uncertainties, refer to the sales page of the Tento-ji Indicator; most questions can be resolved there.
Now, I would like to move on to the analysis.
Thank you in advance!
※ All images enlarge when clicked.

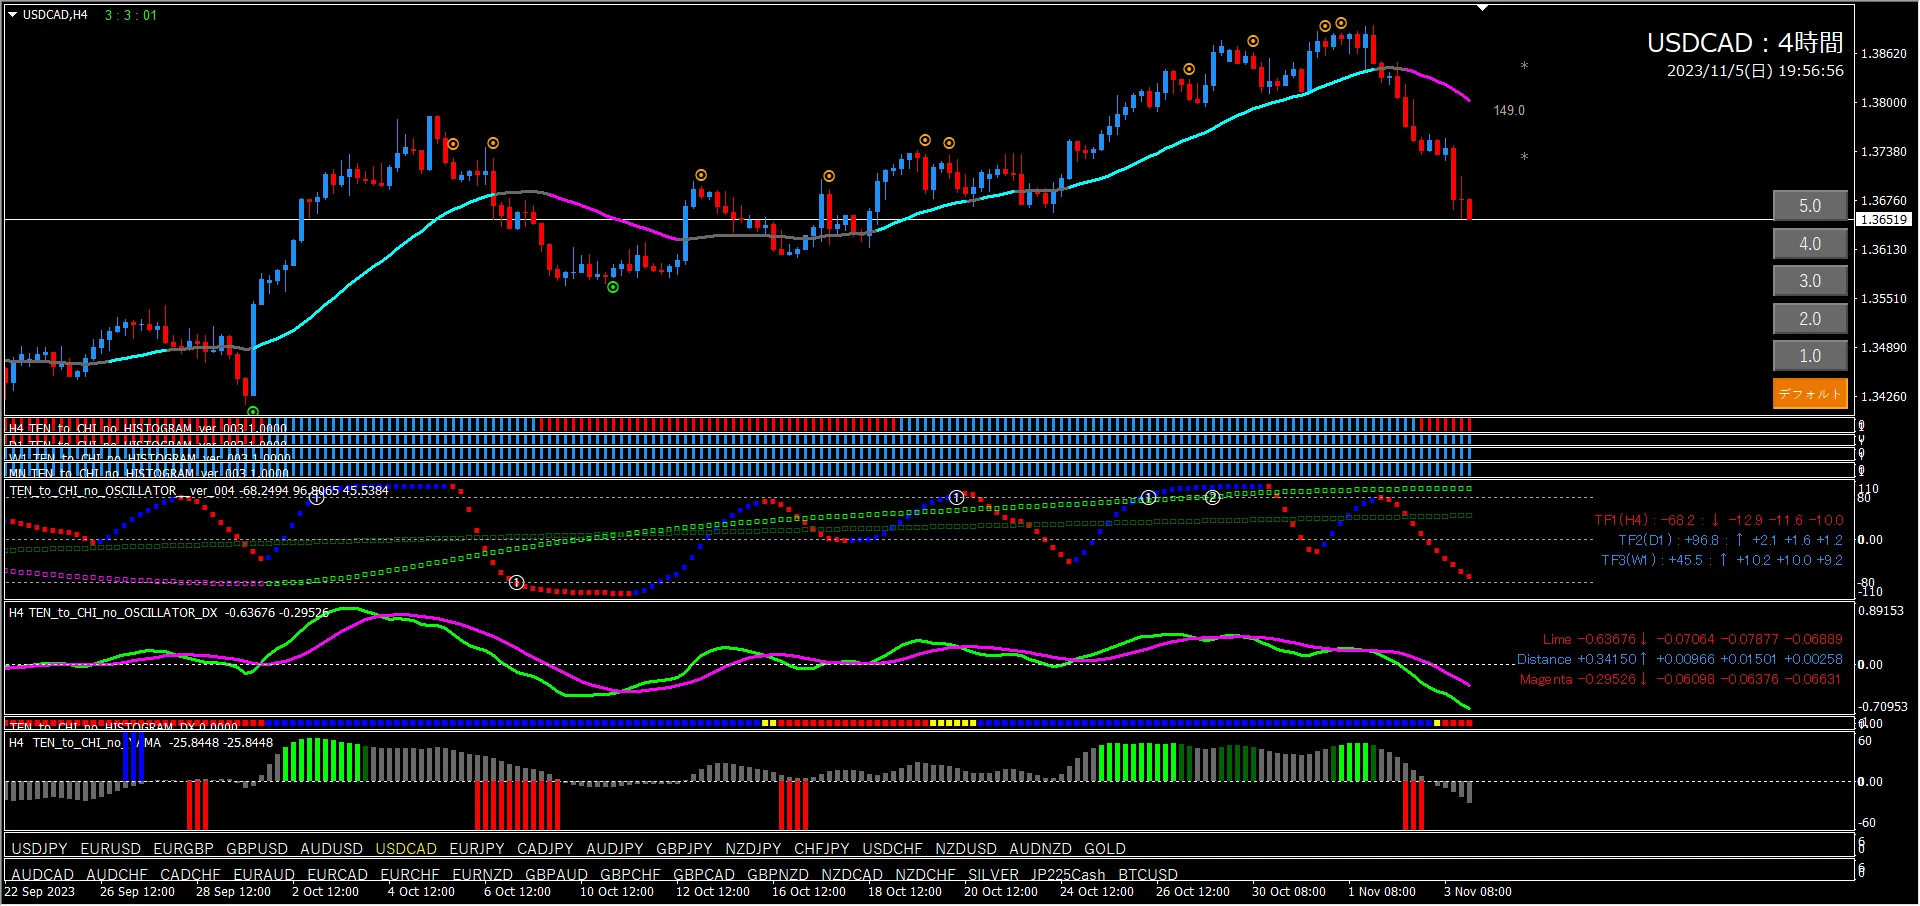
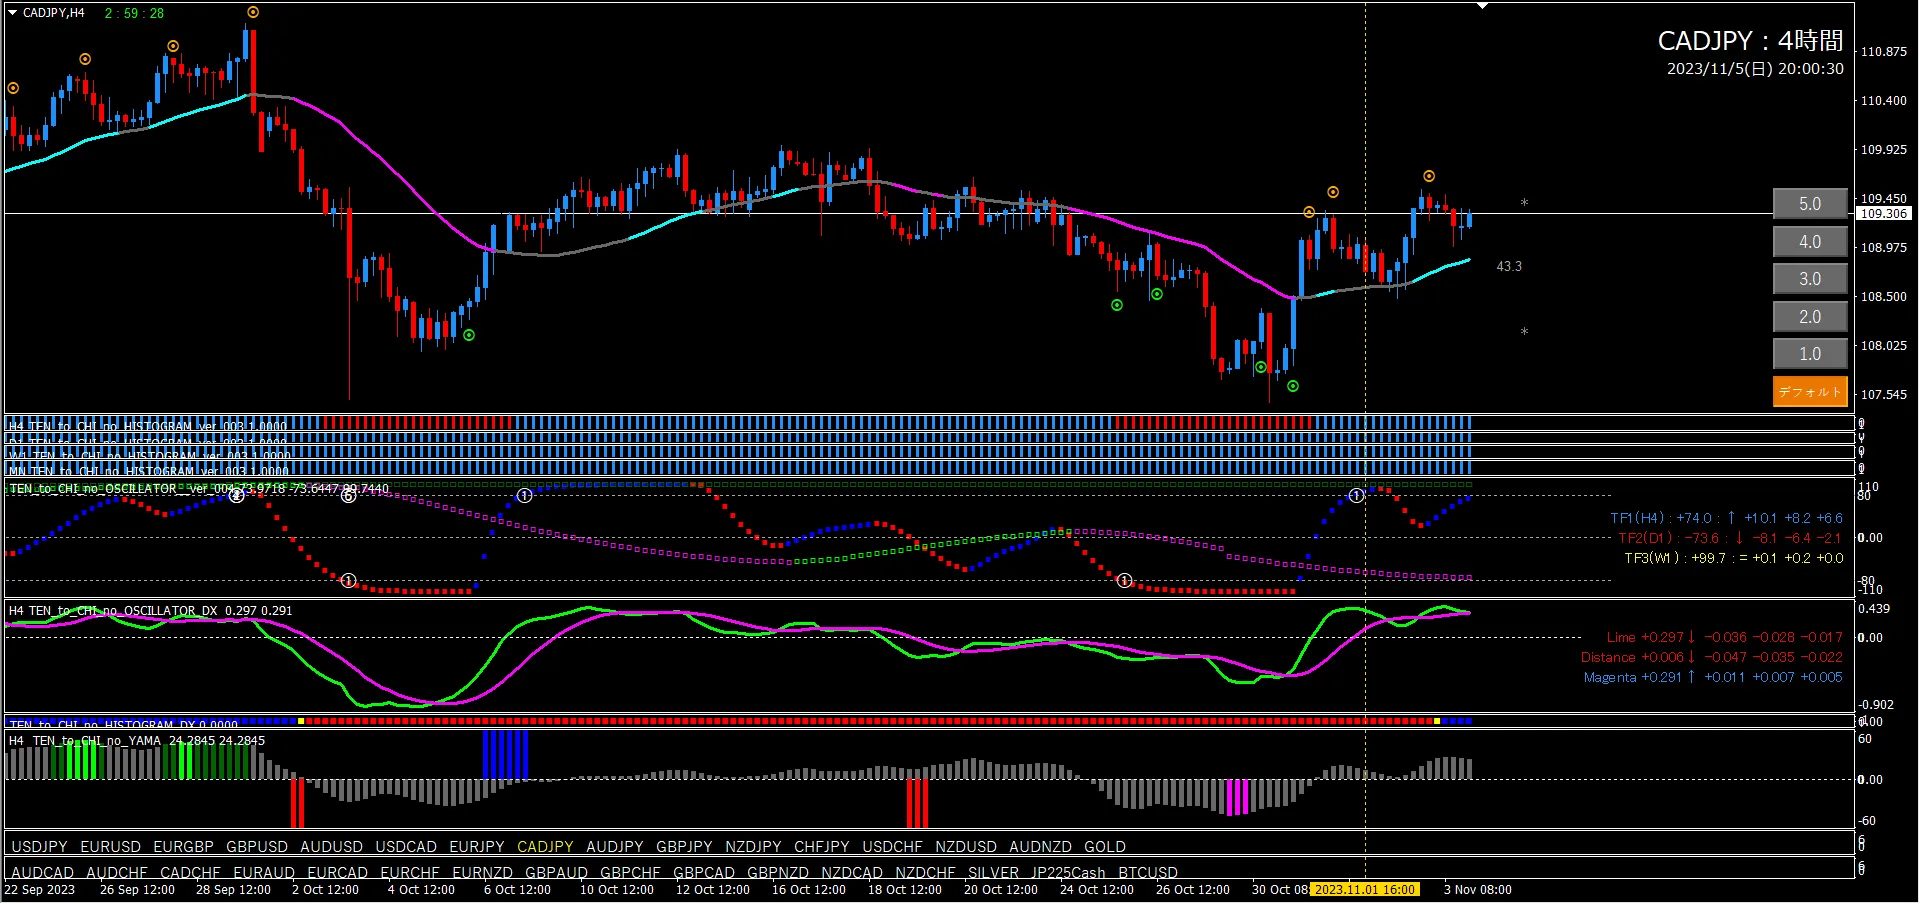
■ 4-hour (environment awareness)
First, look at the oscillator TF2. The oscillator is still rising at +96.8. TF1 is also in a good position around -80. A trough has appeared as well. This is a typical pullback-buy pattern. However, this alone cannot determine a bullish bias. In the future, we will judge an uptrend if a Long entry signal appears and the oscillator DX crosses upward (or contracts depending on the situation).
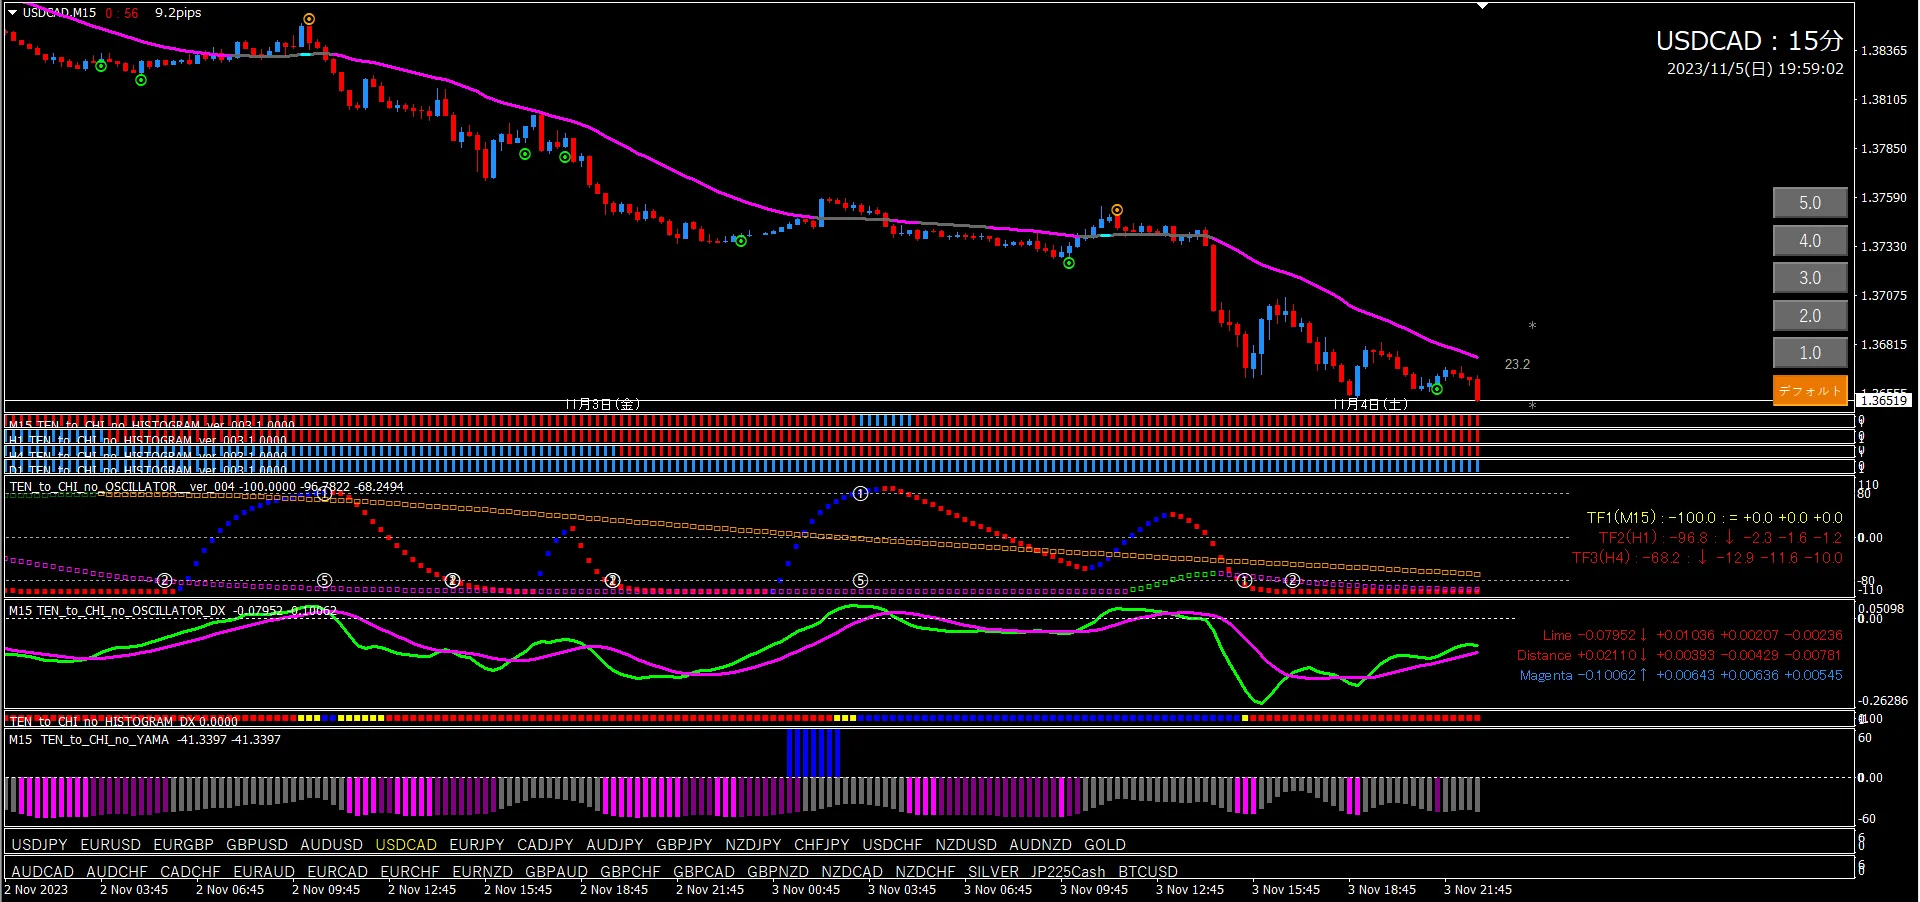
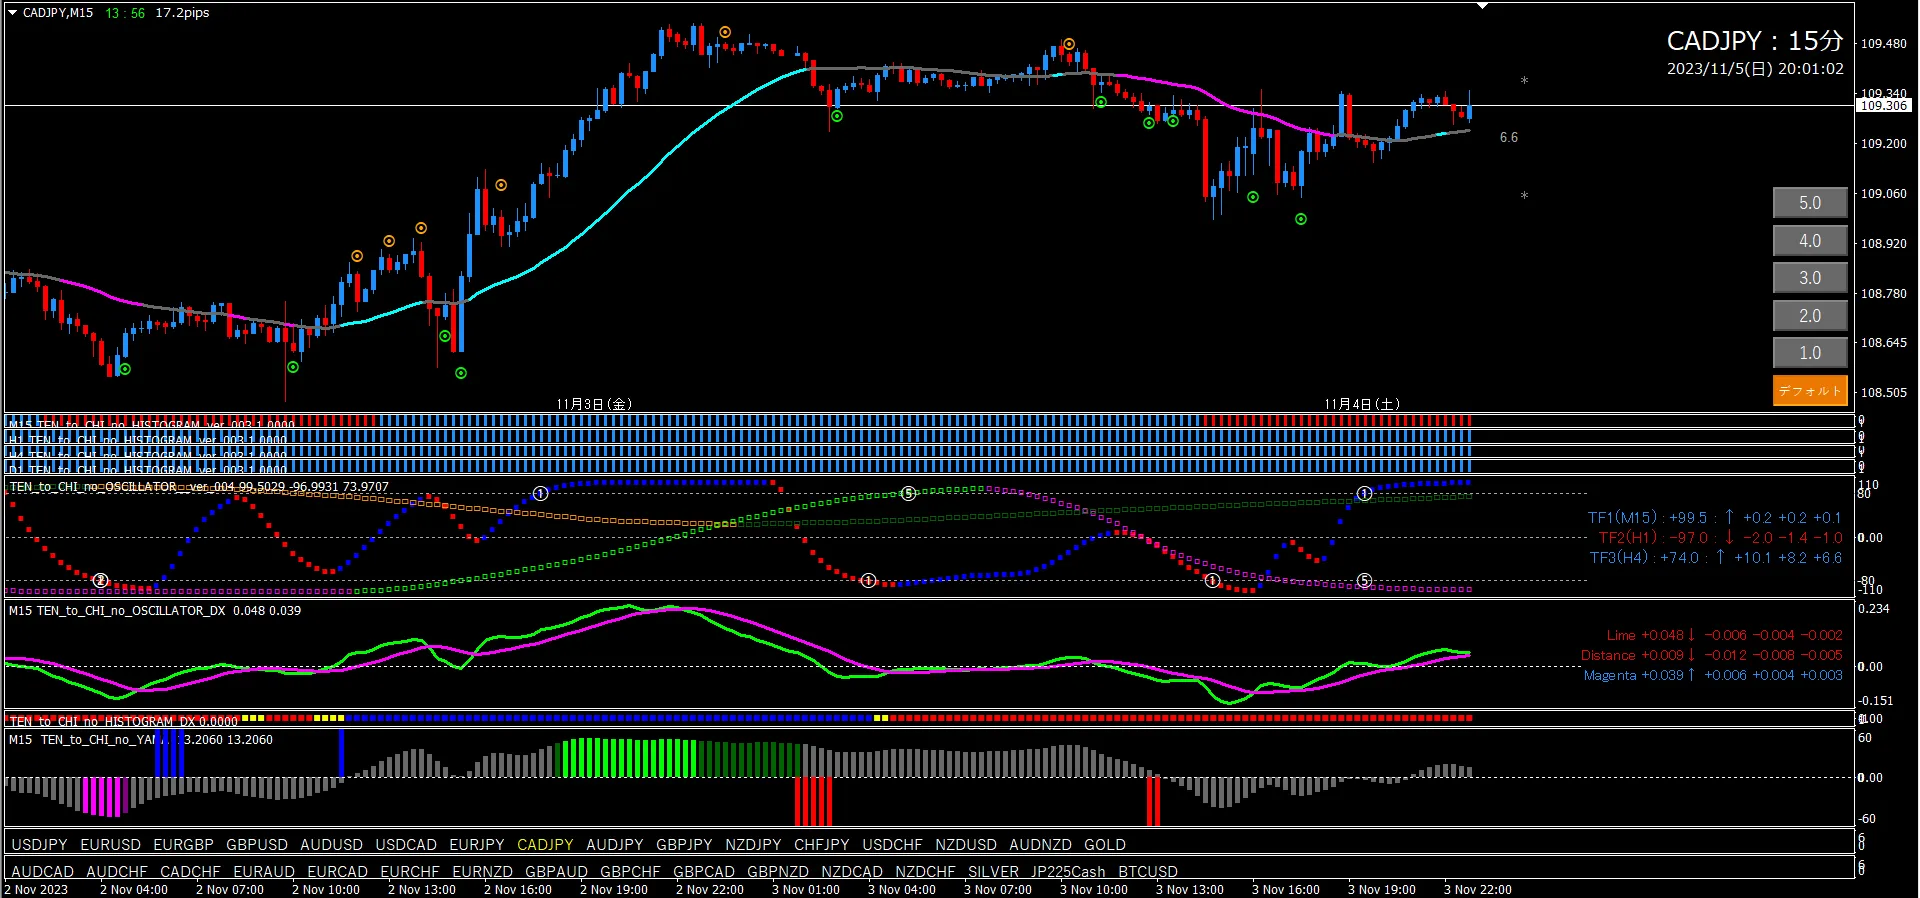
■ 15-minute (entry trigger)
Once an uptrend is determined on the 4-hour, only aim for long entries on the 15-minute chart.
The future scenario is: after confirming an uptrend on the 4-hour, oscillator TF2 will shift from being stuck to rising, and when a Long signal appears, enter. Of course keep an eye on oscillator DX.
■If using Tento-ji EA (used on 15-minute chart)
After confirming an uptrend on the 4-hour, check whether oscillator TF2 is rising.
If it starts rising, use the EA pattern that best fits the current situation.
If the current candlestick is below the line, the Long signal is more likely to appear, so set EA Pattern ①.
If TF1 is below the zero line, set EA Pattern ②.
If TF1 and TF2 reach -80 and Oscillator Signal ② appears, aim for EA Pattern ③.
If a trough lights up, set EA Pattern ④ at that time.
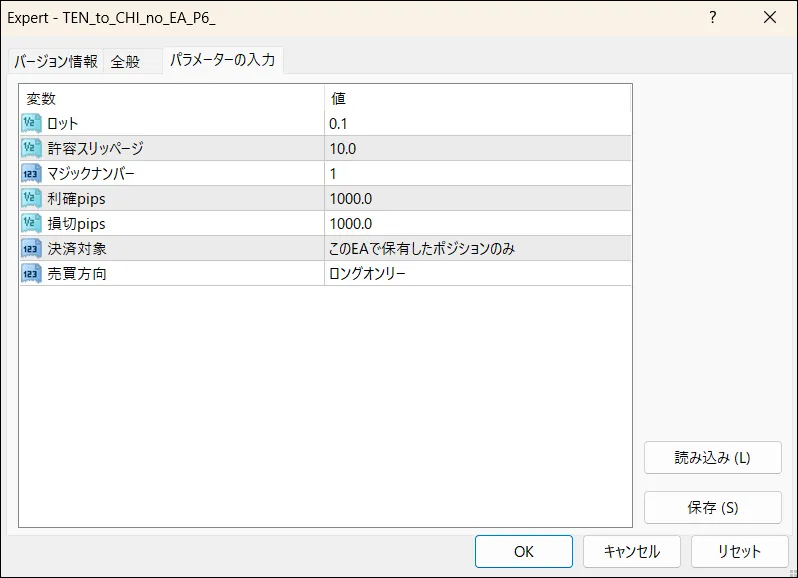
If a clear trend is confirmed on the 4-hour, you may also use the newly added “EA Pattern ⑥” for automated trading by changing the Tento-ji line colors today. This is a way to capture from end to end of the trend. The parameters for EA Pattern ⑥ are as follows for reference.
■If using Abe-san Signals (used on 15-minute chart)
If you have Abe-san Signals, you can enter long on Signal 1 after waiting on Signal 2. In Abe-san Signals, if the 4-hour timeframe has a clear bias, you can ignore the direction of oscillator TF2 and other justifications. It is a very strong trend-following signal, so no problem.The usage is the same for other currency pairs, so it will be omitted from the following analysis.

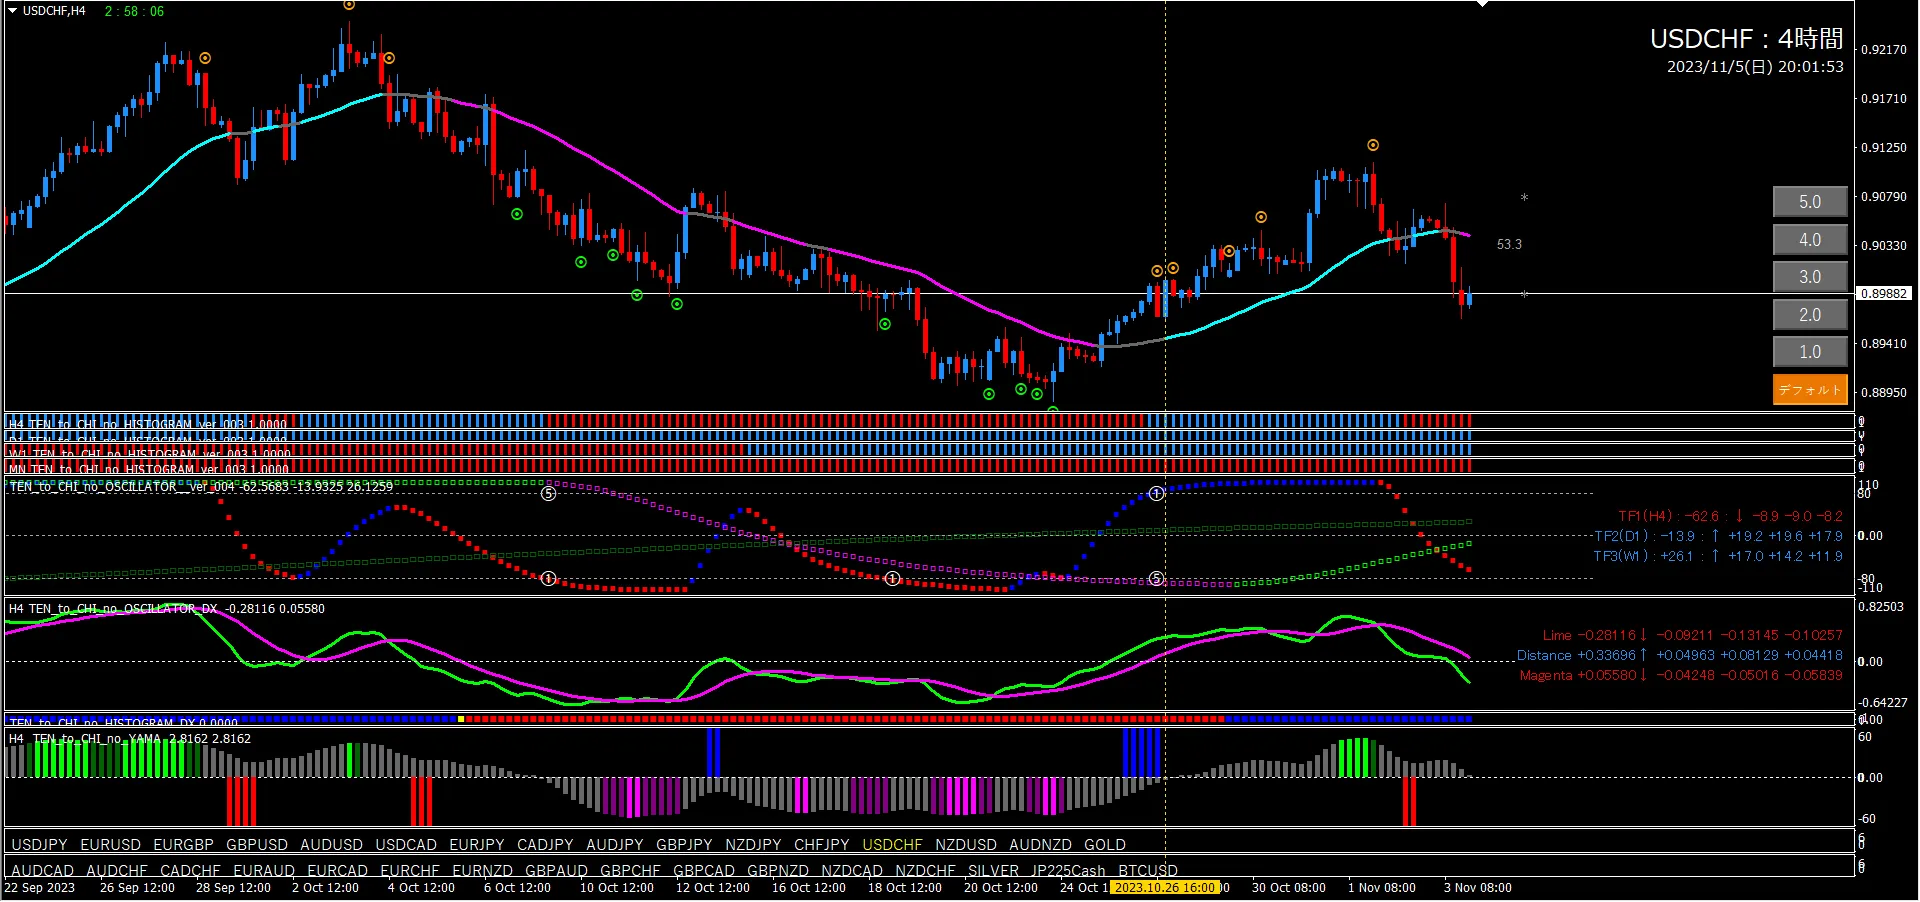
■ 4-hour (environment awareness)
Oscillator TF2 is descending, TF1 is near +80. However, since the recent short entry signal has passed and oscillator DX shape isn’t ideal, based on histogram and histogram DX it is still believed there is upward strength left. Therefore at this point it is a bit difficult to determine a bias. If TF2 descends to -80 and sticks, and a short entry signal and TF1 color change are confirmed, then a bearish bias will be judged. This time, a cautious approach.
■ 15-minute (entry trigger)
After judging a bearish bias on the 4-hour, target only short entries on the 15-minute.
As of now, oscillator TF2 is already descending, so the future scenario is after judging a bearish bias, using short triggers (point, TF1, trough, and if the pattern looks good, DX). Of course TF2 must be descending. If all patterns look good (see manual), a line trigger can be used.
■Tento-ji EA (used on 15-minute chart)
① USD/CAD reference

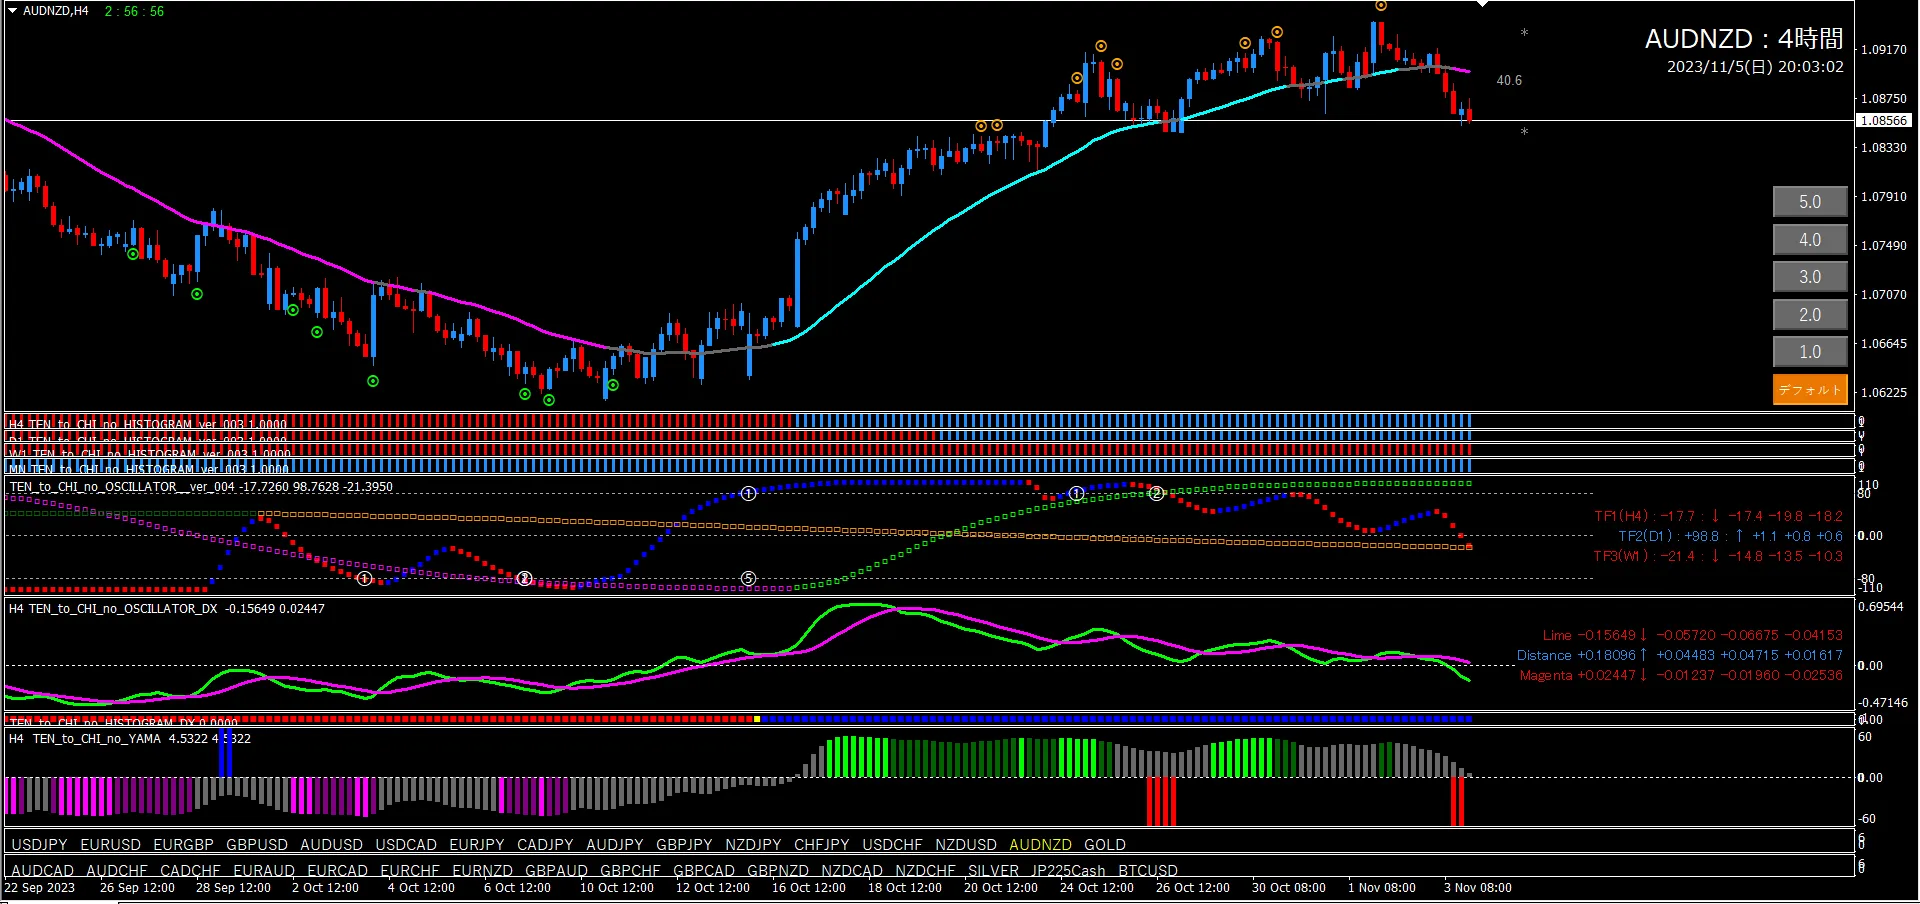
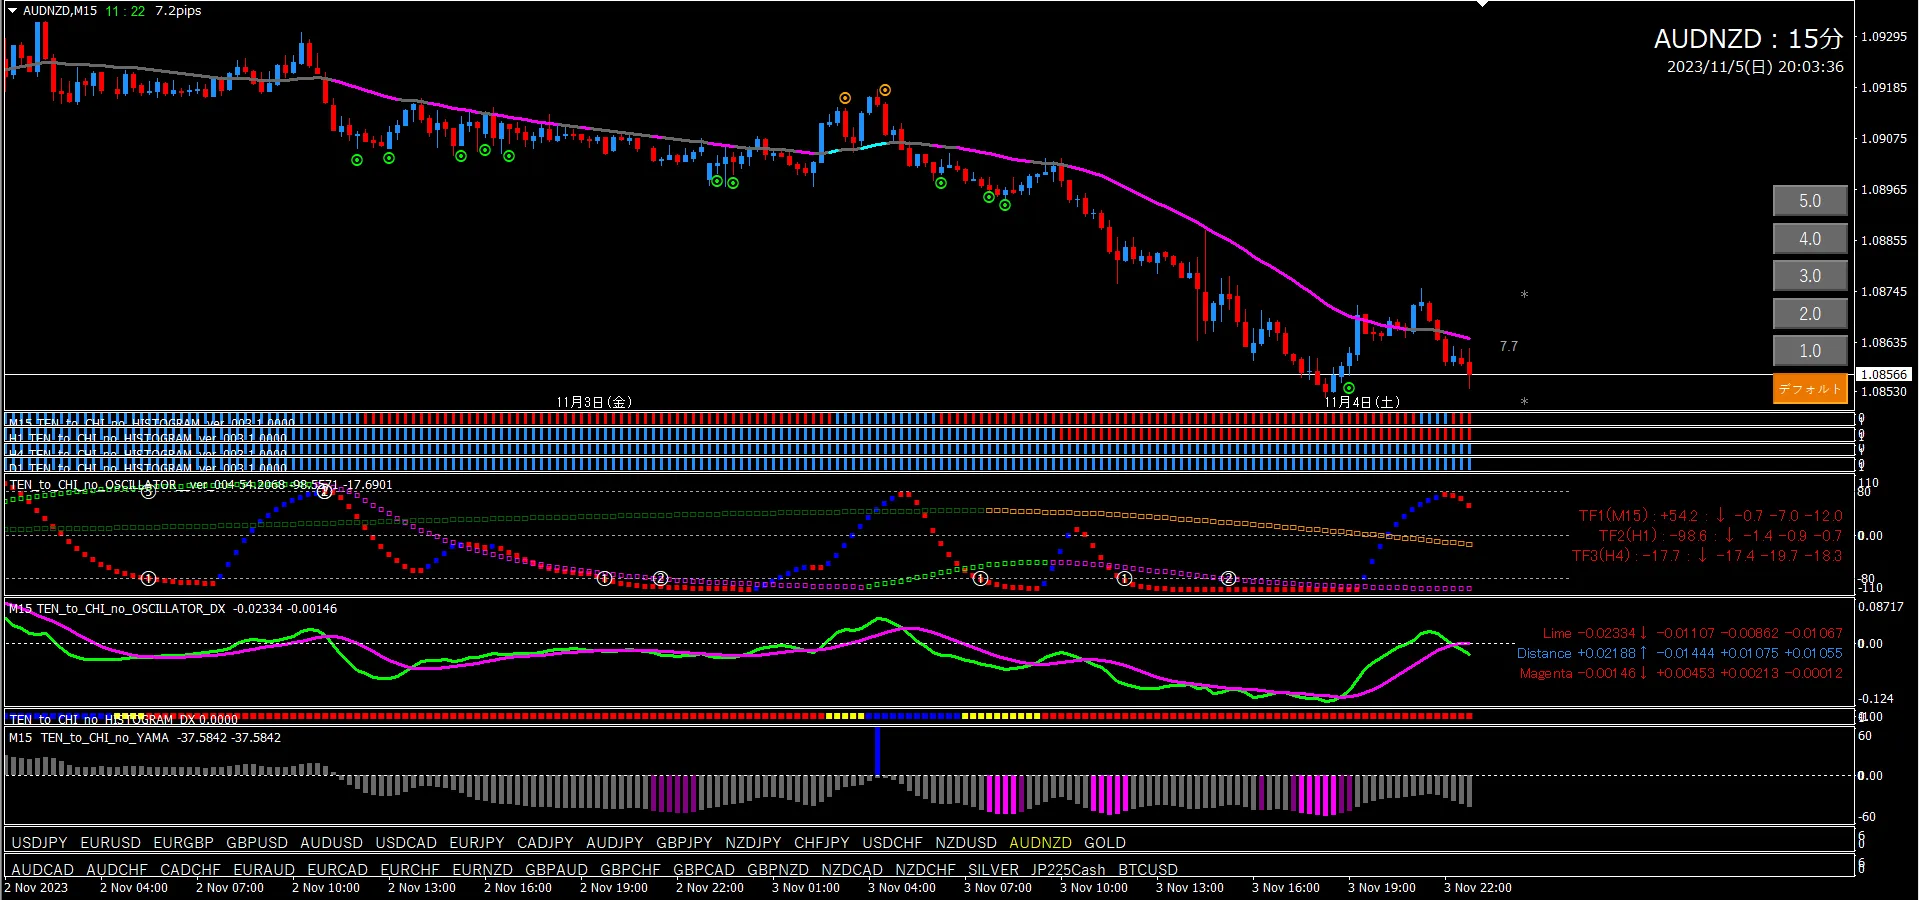
■ 4-hour (environment awareness)
First, look at oscillator TF2. It’s rising nicely. TF1 is heading toward -80. It’s a very good shape.
However, oscillator DX still has downward pressure, so going forward a long entry signal and an oscillator DX rising cross (or contraction depending on the situation) will determine an uptrend.
■ 15-minute (entry trigger)
After judging an uptrend on the 4-hour, target only long entries on the 15-minute.
Right now oscillator TF2 is descending and TF1 has reached +80, which is a pullback-sell pattern. The target is a long entry, but you could also use short entries leveraging the remaining downward force of the 4-hour oscillator DX. However since the plan here is to pursue long entries, first wait for TF2 to rise. After confirming the 4-hour bias, if TF2 turns upward, enter with a Long trigger (point, TF1, trough, DX if pattern good). If all patterns look good (see manual), a line trigger can be used.
■Tento-ji EA (used on 15-minute chart)
If you are using the 4-hour oscillator DX downward residue to pursue short entries quickly, since TF2 is already descending and a trough appears, EA Pattern ④ could be set.

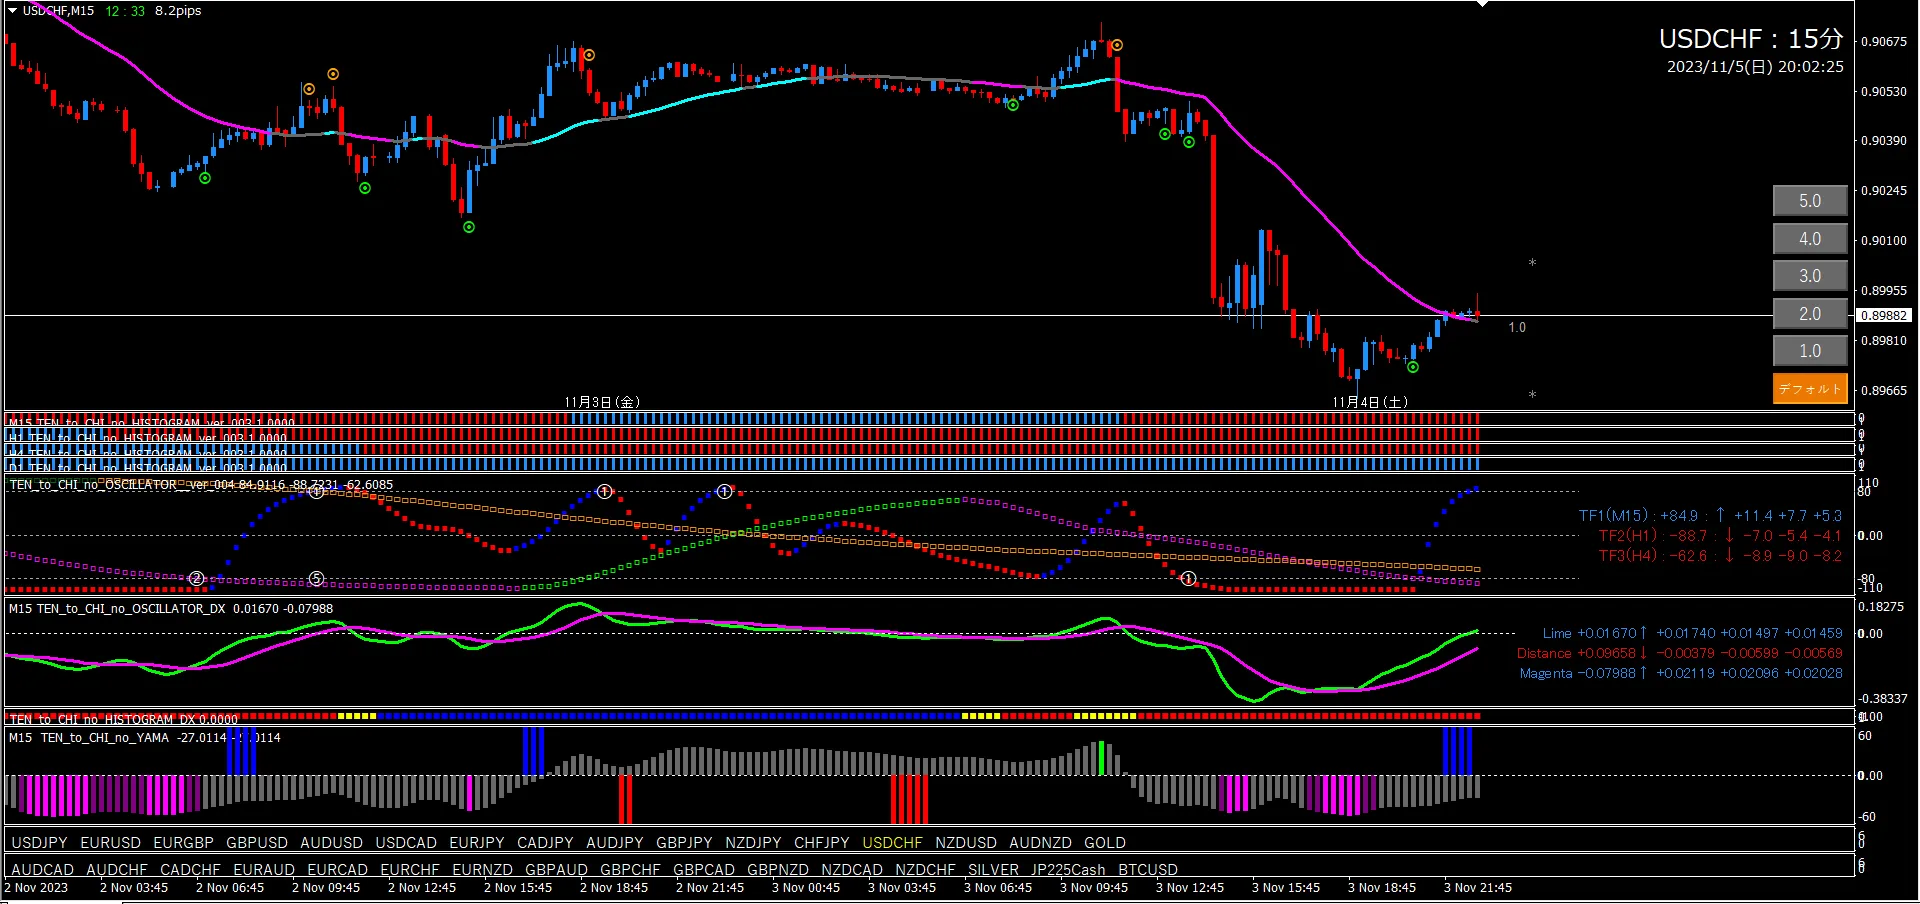
■ 4-hour (environment awareness)
Oscillator TF2 is locking in and rising. The target is a pullback-buy pattern, but overall, the shape isn’t great. In the future, when TF1 reaches -80, a Long signal lights up, and oscillator DX crosses upward, this will establish an uptrend. Also, a trough has appeared.
■ 15-minute (entry trigger)
If you judge an uptrend on the 4-hour, target only long entries on the 15-minute.
At present, it is clearly a pullback-sell pattern. If you trade only on the 15-minute chart, this is a prime short entry point, but our aim is long entries. Wait for oscillator TF2 to turn upward, then after confirming the 4-hour bias, enter with a Long Trigger (point, TF1, trough, DX if pattern is good). If all patterns look good, you can use a line trigger as per the manual.
■Tento-ji EA (used on 15-minute chart)
① USD/CAD reference

■ 4-hour (environment awareness)
Oscillator TF2 is locked in, TF1 is rising from around +80. This is a basic pullback-buy pattern. The histogram is All blue. Oscillator DX already crossing upward. At this point an uptrend can be considered. However the candlestick is already above the line, so a short signal could appear at any time. When a short signal appears, the uptrend will reset.
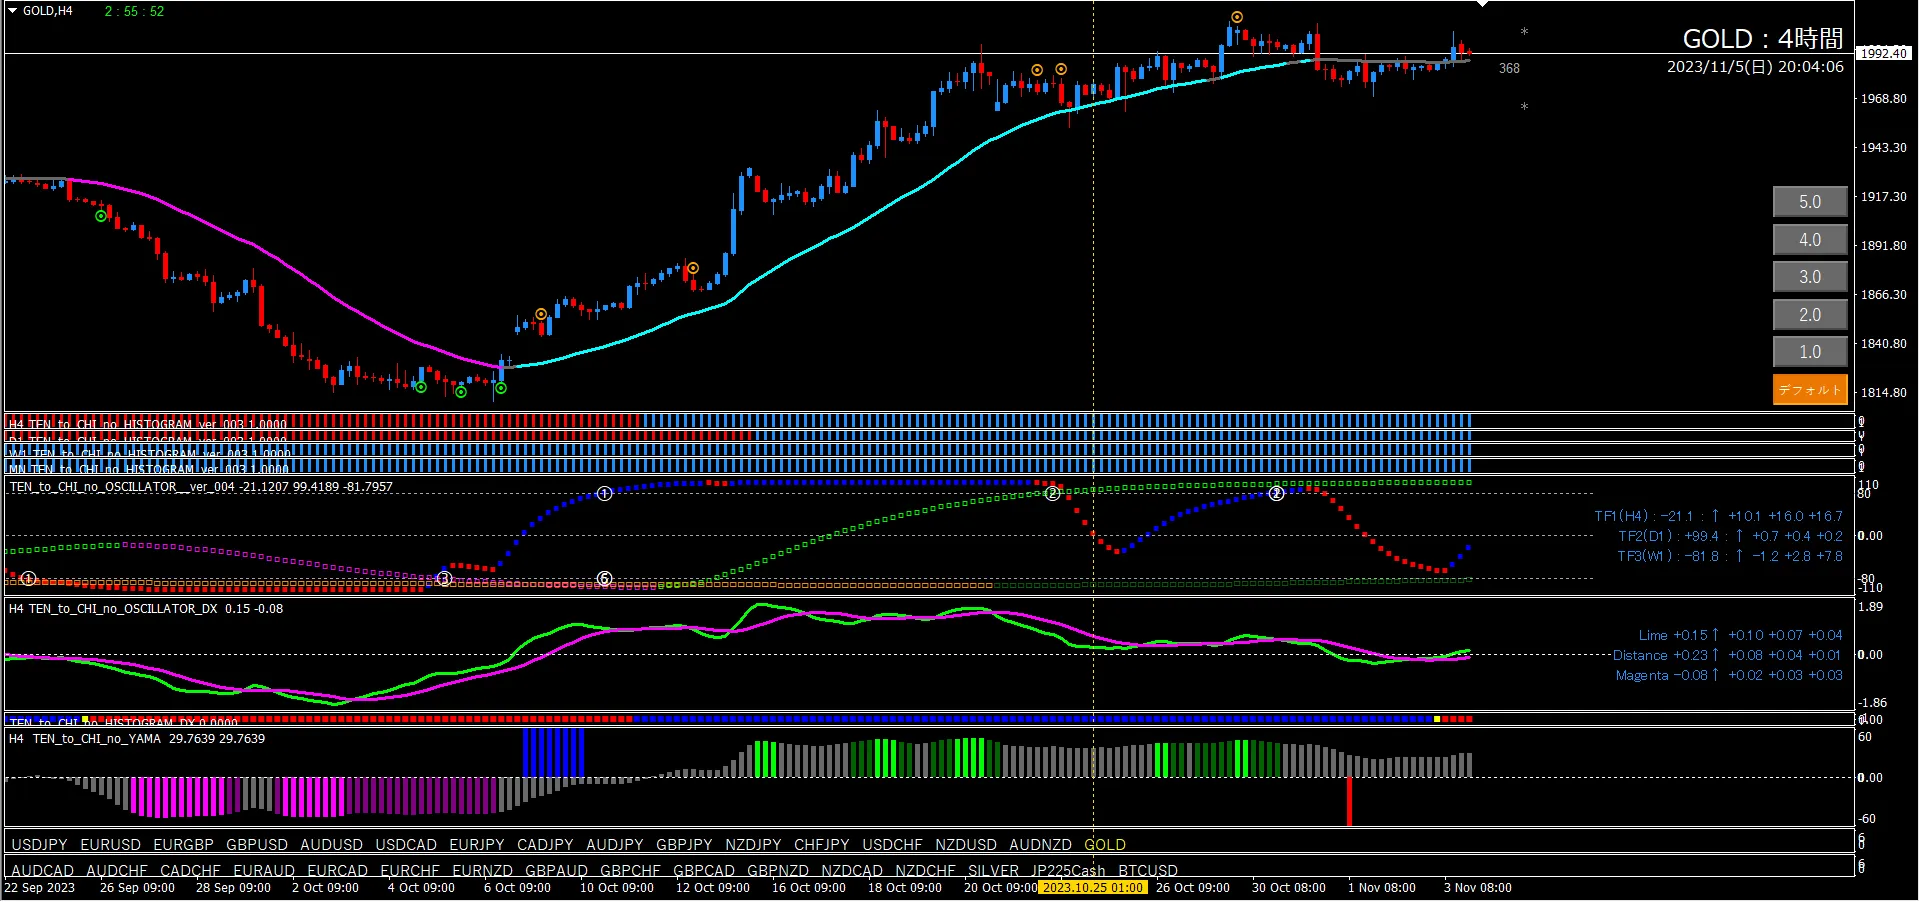
■ 15-minute (entry trigger)
Since a bullish bias is judged on the 4-hour, only aim for long entries on the 15-minute.
Oscillator TF2 has entered +80 and is still rising. TF1’s position isn’t ideal (though being near -80 would be okay).
Future scenario: if TF2 continues to rise, enter on a Long Signal; however, be sure to check oscillator DX in that case.
■Tento-ji EA (used on 15-minute chart)
4-hour bias is bullish and oscillator TF2 is already rising. At this point, it should be fine to set EA Pattern ①.

I hope this is helpful to everyone in some small way.
