

Utilization of the "Visualization Indicator" (Part 119)
Usage of the "Visualization Indicator" (its119)
1. Further develop the "28 Currency Pair List Indicator" into an indicator
“8CPVisualization Indicator”to plotEURJPY.
There are versions of the “8CPVisualization Indicator”Oceania版 (version),London版,NewYork版,AnyCP版London版を使いました。
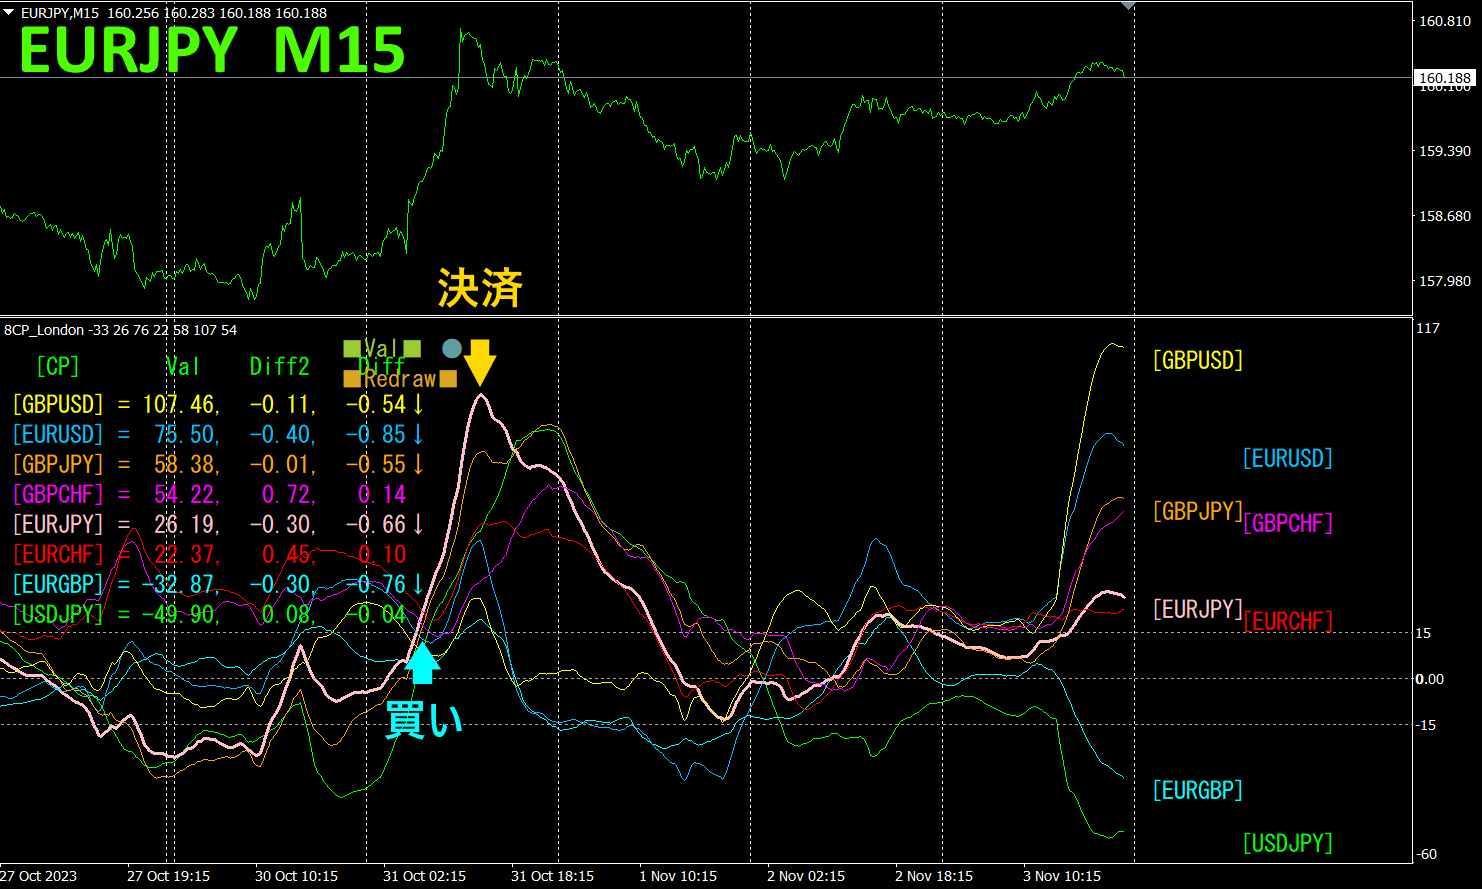
The upper half is theEURJPY 15-minuteminute chart. The lower half is from the “8CPVisualization Indicator.” The pink thick line graph corresponds toEURJPY.
On Tuesday,EURJPY broke out of the cluster, so we buyEURJPY. We lock in profits at the day's peak.About150pips profit was obtained. With the “8CPVisualization Indicator,” by focusing trades only on the most volatile currency pairs that diverge/converge, profits can be quickly realized.
2. Best Select Try the Indicator
The following figure is a screenshot taken on2023 year11 month03 day21:39 (JST) .
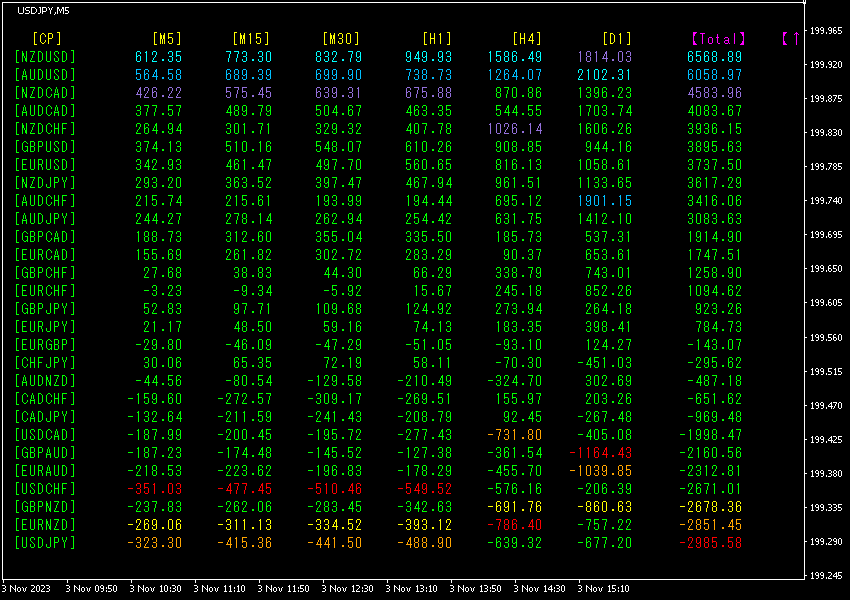
TotalThe numbers are sorted in descending order. The top row'sNZDUSD is blue across all timeframes, and theTotal value is6568.89, a large positive figure.NZDUSD indicates a strong upward trend.
Now, let's look at theNZDUSD chart.
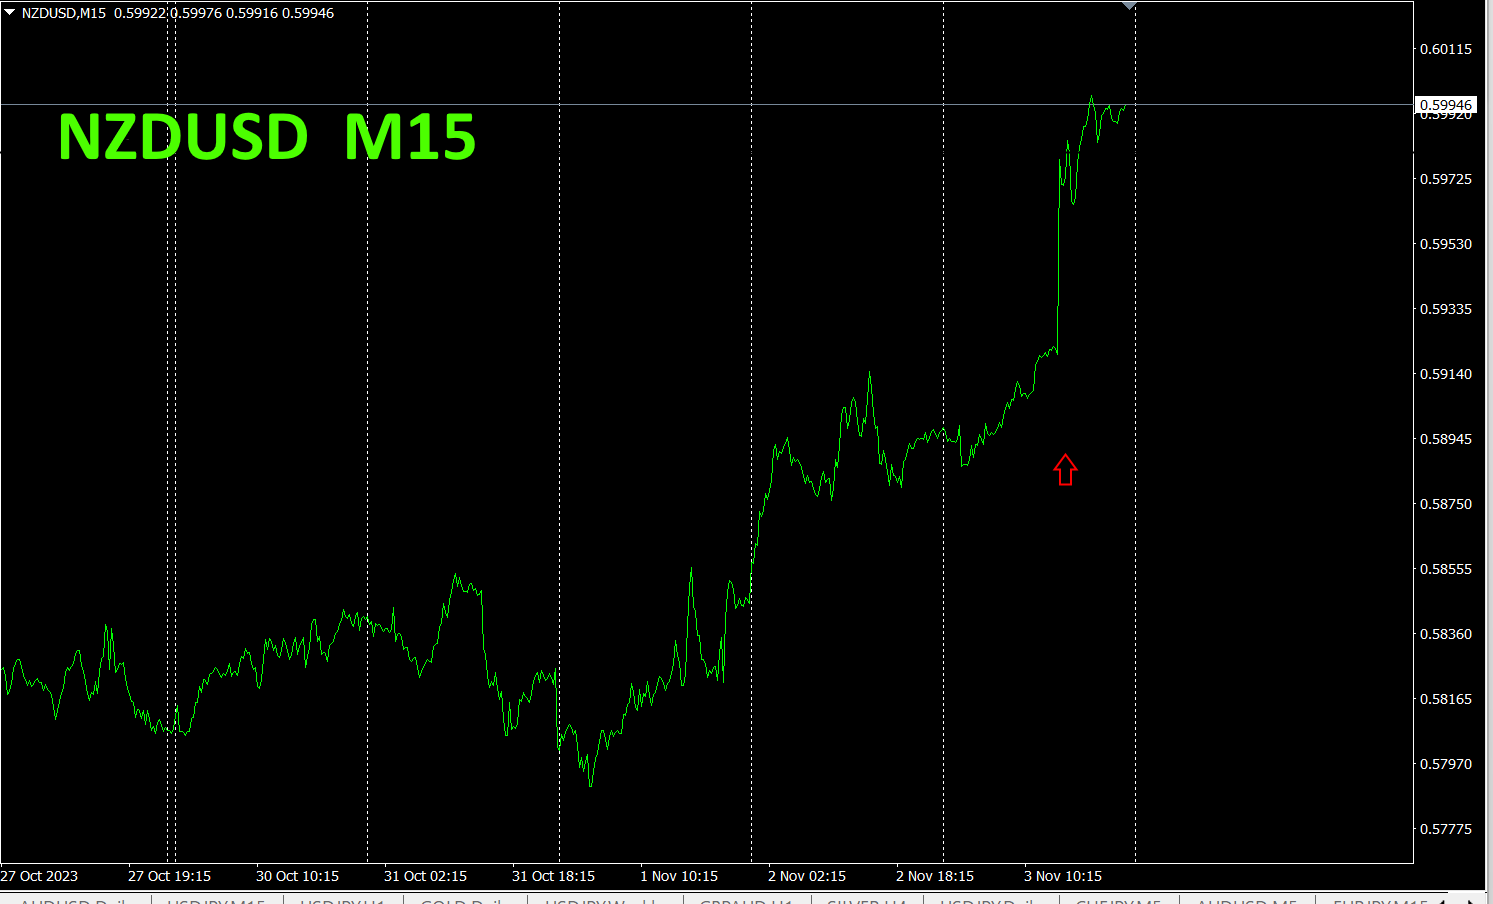
The red arrows mark where the screenshot was taken. They capture the steep rise in the middle of an uptrend with an ascending right shoulder. It rose so sharply that there may have been an economic indicator release (later we find there was the U.S. employment report).
Just like the saying “When the wind blows, the bucket-maker profits,”
U.S. employment data release →
→ Unemployment rate3.9%, month-on-month0.1point worse (below market expectations)
→ S&P 500 and Nasdaq rise significantly (stock market up)
→ U.S. Treasury yields fall
→ In terms of currency strength,USD weakens
→NZDUSD,AUDUSD and other currency pairs rise
Hence,NZDUSD rose.
“28 currency pairsBest Select indicator28 currency pairs, allowing you to easily identify which has the strongest trend. It also tells you whether you should trade now with numbers and colors. It lets you judge the overall currency movement at a glance — a superb indicator.
“28 currency pairsBest Select
https://www.gogojungle.co.jp/tools/indicators/35128

3. As of May of the year before last, what happened with EURJPY
Since 2021 year5 month, we have been tracking EURJPY
To view the overall trend, we draw about the last30 minutes of the last approximately3 weeks on a 30-minute chart.
Last time I wrote the following.
EUR is moving slightly upward from a horizontal,.
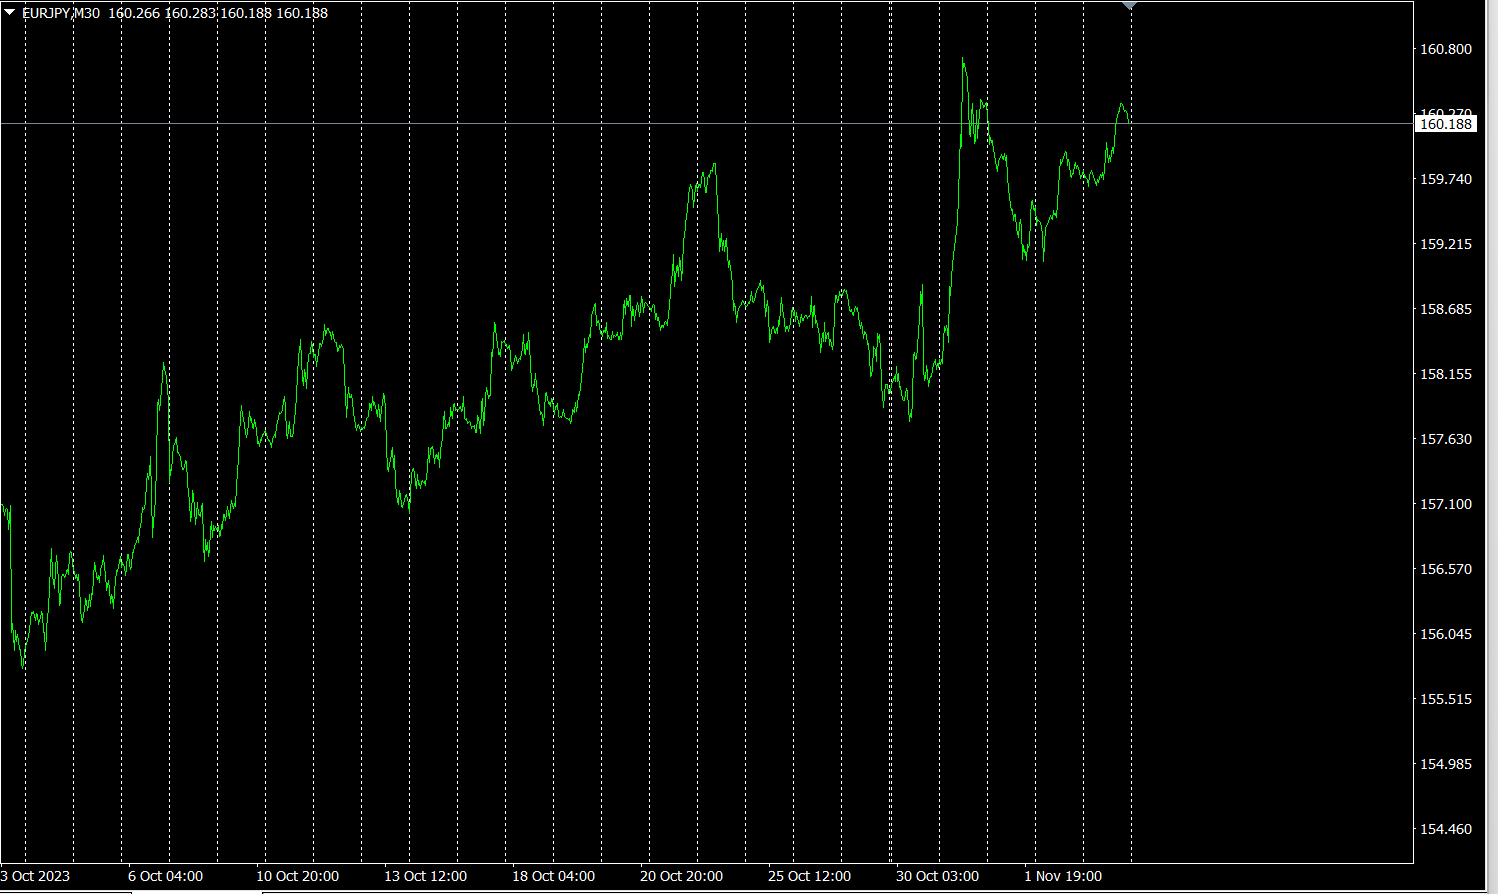
The prediction was wrong. It rose significantly upward.
4Time-frame currency strength chart.
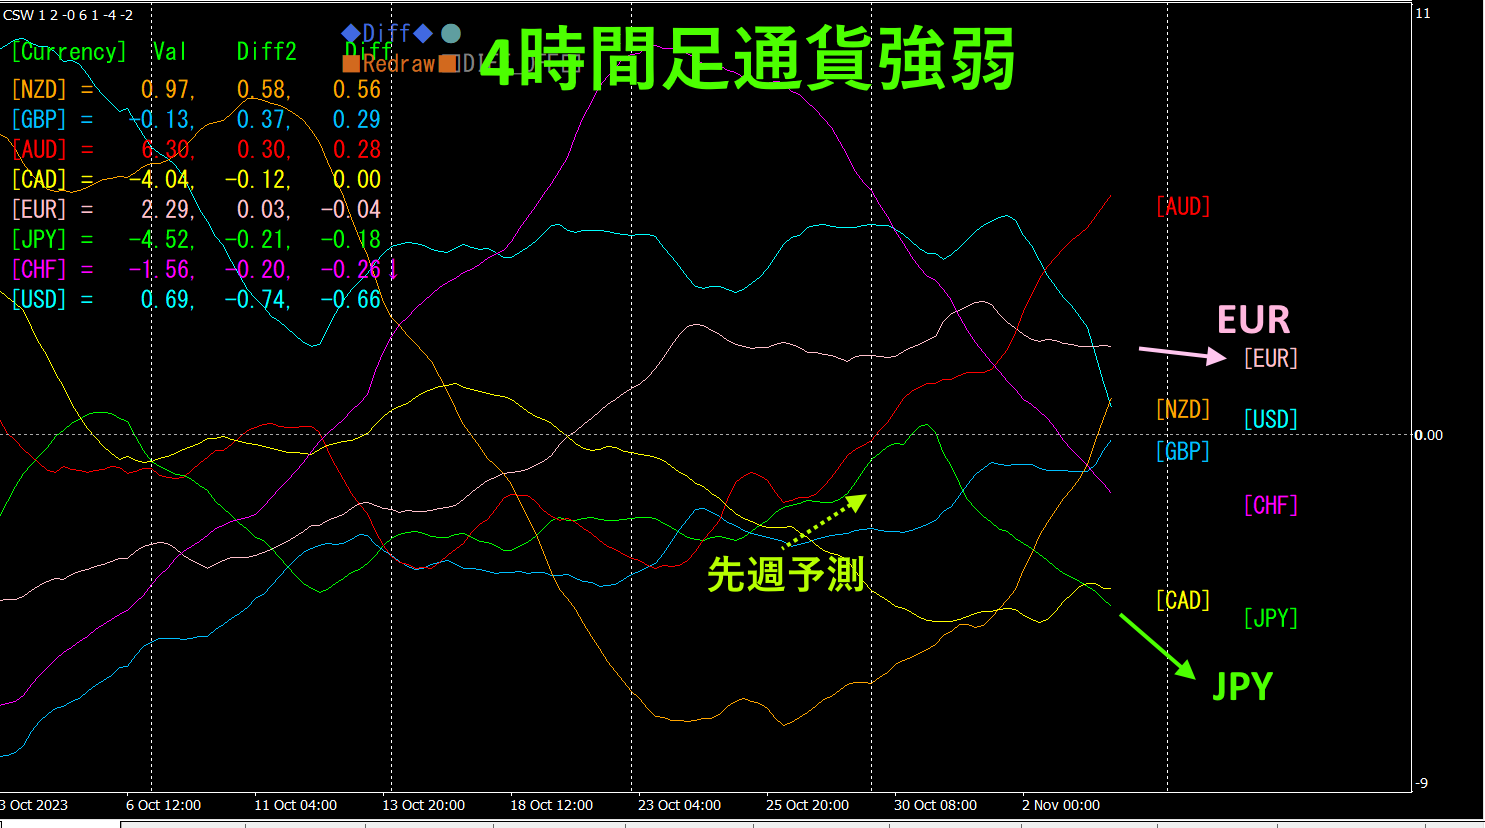
Pink isEUR, green is.JPYEUR is slightly down from horizontal,JPY extends downward. In last week's forecast,JPY was expected to rise. However,JPY reversed mid-week and fell. As a result,EURJPY rose.
4From the time-frame currency strength chart, EURJPY is expected to move upward in the future.
4. Search for peaks and troughs across all currency pairs and plan a trend strategy (target:NZDCHF).
Previously,2505「天底Search indicator」 was used to select the next targetNZDCHF. We are aiming for a rise from the bottom.
I will re-post last week'sNZDCHF H1 chart.
1 Time-frame chart.
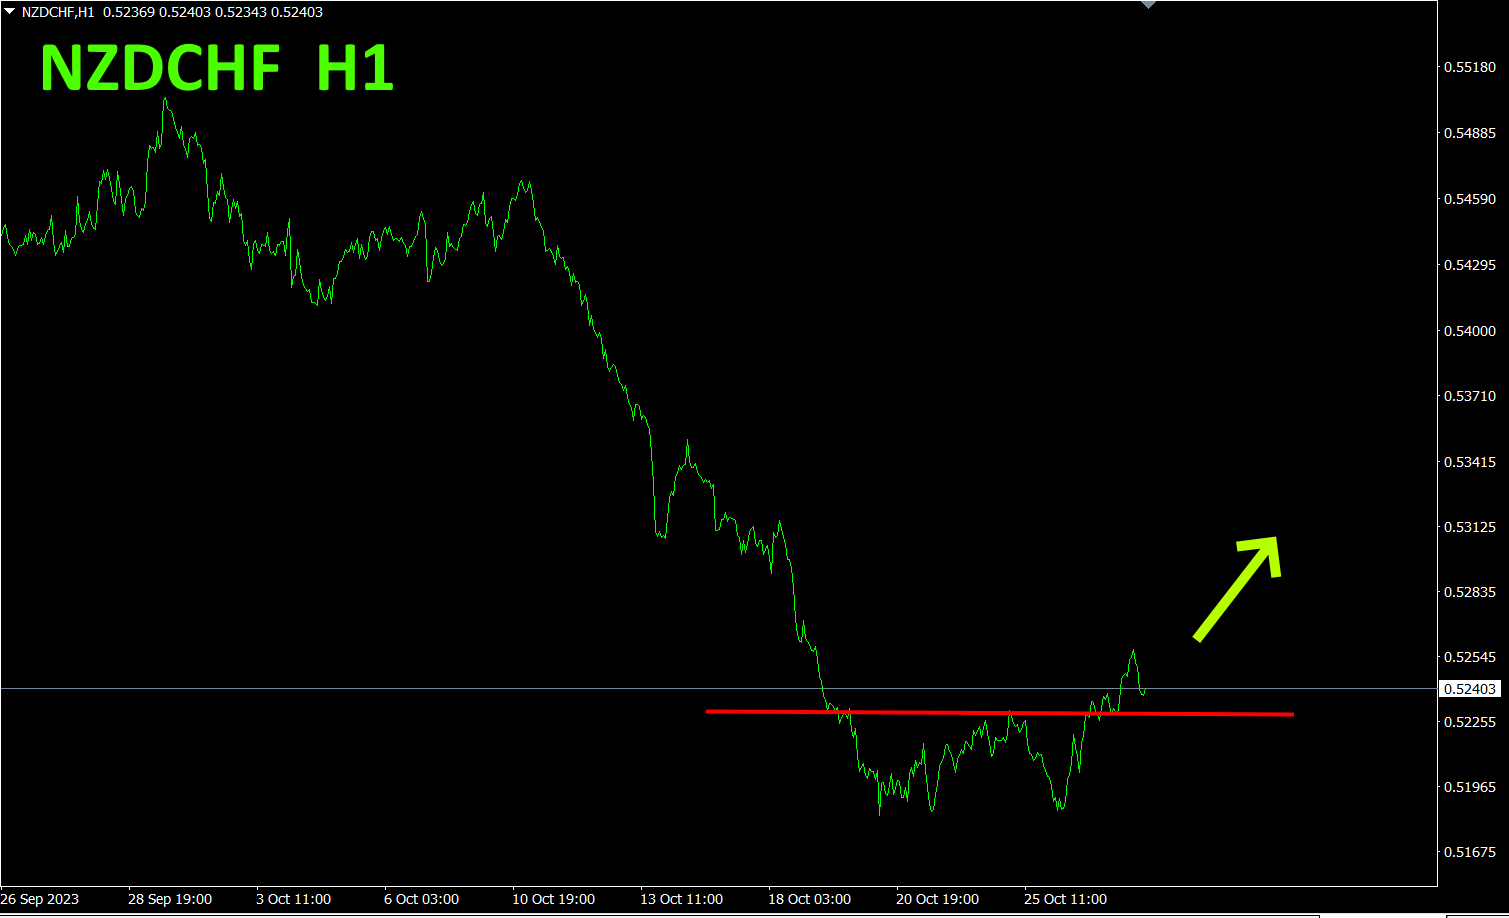
It looks like a chart out of FX textbooks.
This week's chart shows
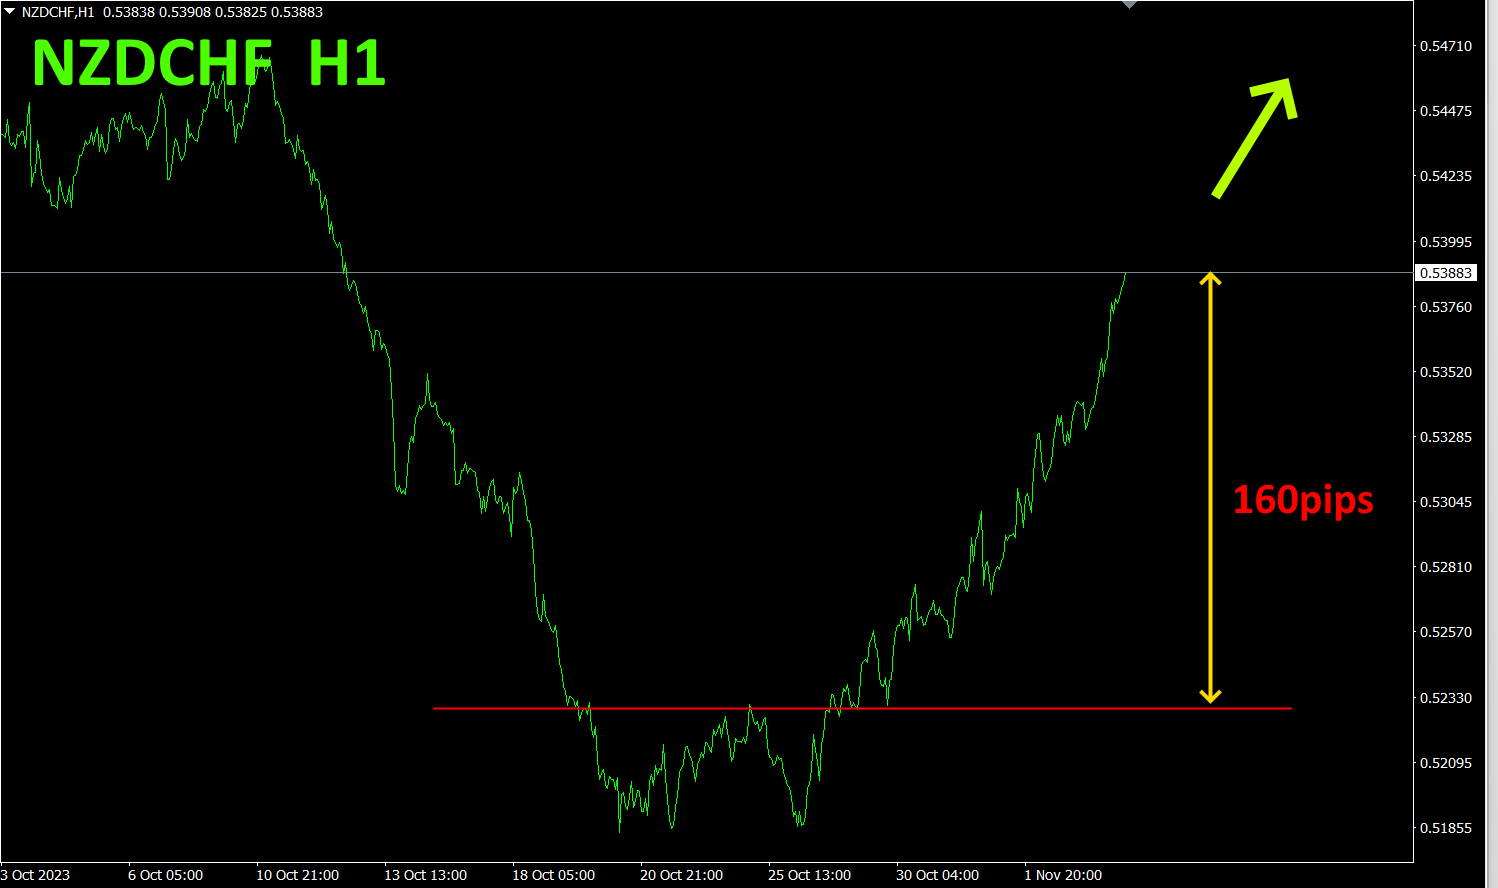
about160pips rise from the neckline. It is still rising strongly. For the time being, I will target the recent high, but since the starting point of the rise was a bottom on the daily chart, there is room to go higher. If you hold a long position, you’ll have more to enjoy.
For safety, refer to the four-hour timeframe currency strength chart.
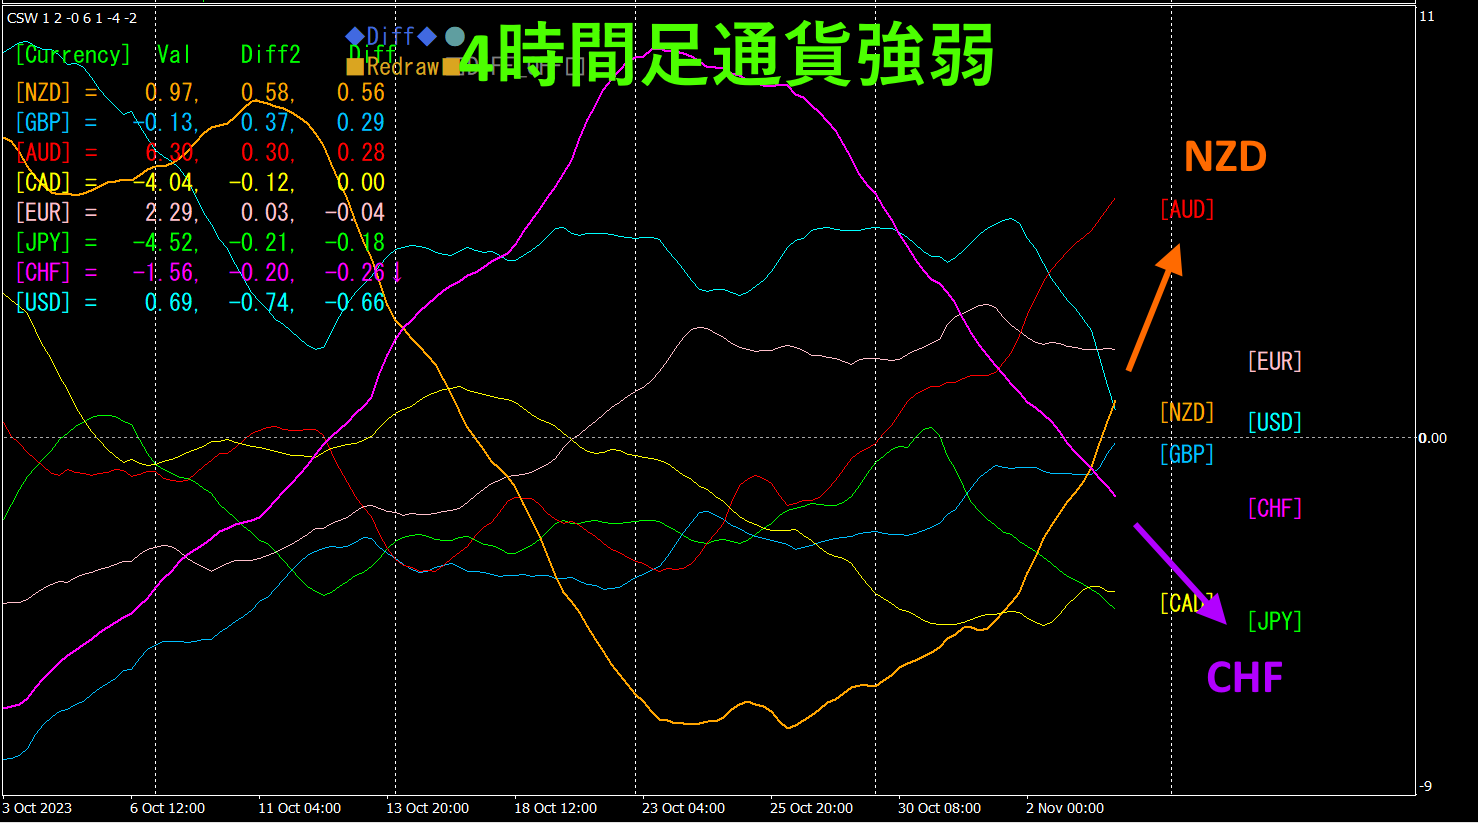
Red-purple isCHF, orange isNZD.CHF andNZD show a clean inverse correlation. On the four-hour currency strength chart,CHF plunges, surges. Going forward, the gap betweenNZDNZDCHF is expected to rise further. In this scenario, you can safely hold a long position in. You may even add more to your position.
With a semi-automaticEA, the “Trend Line EX” lets you draw a slanted downward line and automatically buy when price breaks above it, and automatically close when it breaks above the rising line, enabling a passive trading approach.
※“Trend Line EX”

https://www.gogojungle.co.jp/tools/indicators/42257
If you’re interested in the “8C currency strength visualization indicator,” please refer to the following page.
MT4 version https://www.gogojungle.co.jp/tools/indicators/39150
MT5 version https://www.gogojungle.co.jp/tools/indicators/39159
【My listed products】


