Yoppi - FX Special Feature Article (Culture Day) Exclusive Video < Buy-the-dip Points and Timing > & [9/28-29 GBPUSD Pound-Dollar]
Exclusive video < Buy-the-dip points and timing >
In this exclusive video, I will share my thoughts on buying the dip ↓
ー


【9/28-29 GBPUSD Pound-Dollar】
Regarding the GBPUSD trade entered on 9/28, I will summarize the detailed thinking from entry to exit.

ー
First, let's start with market context
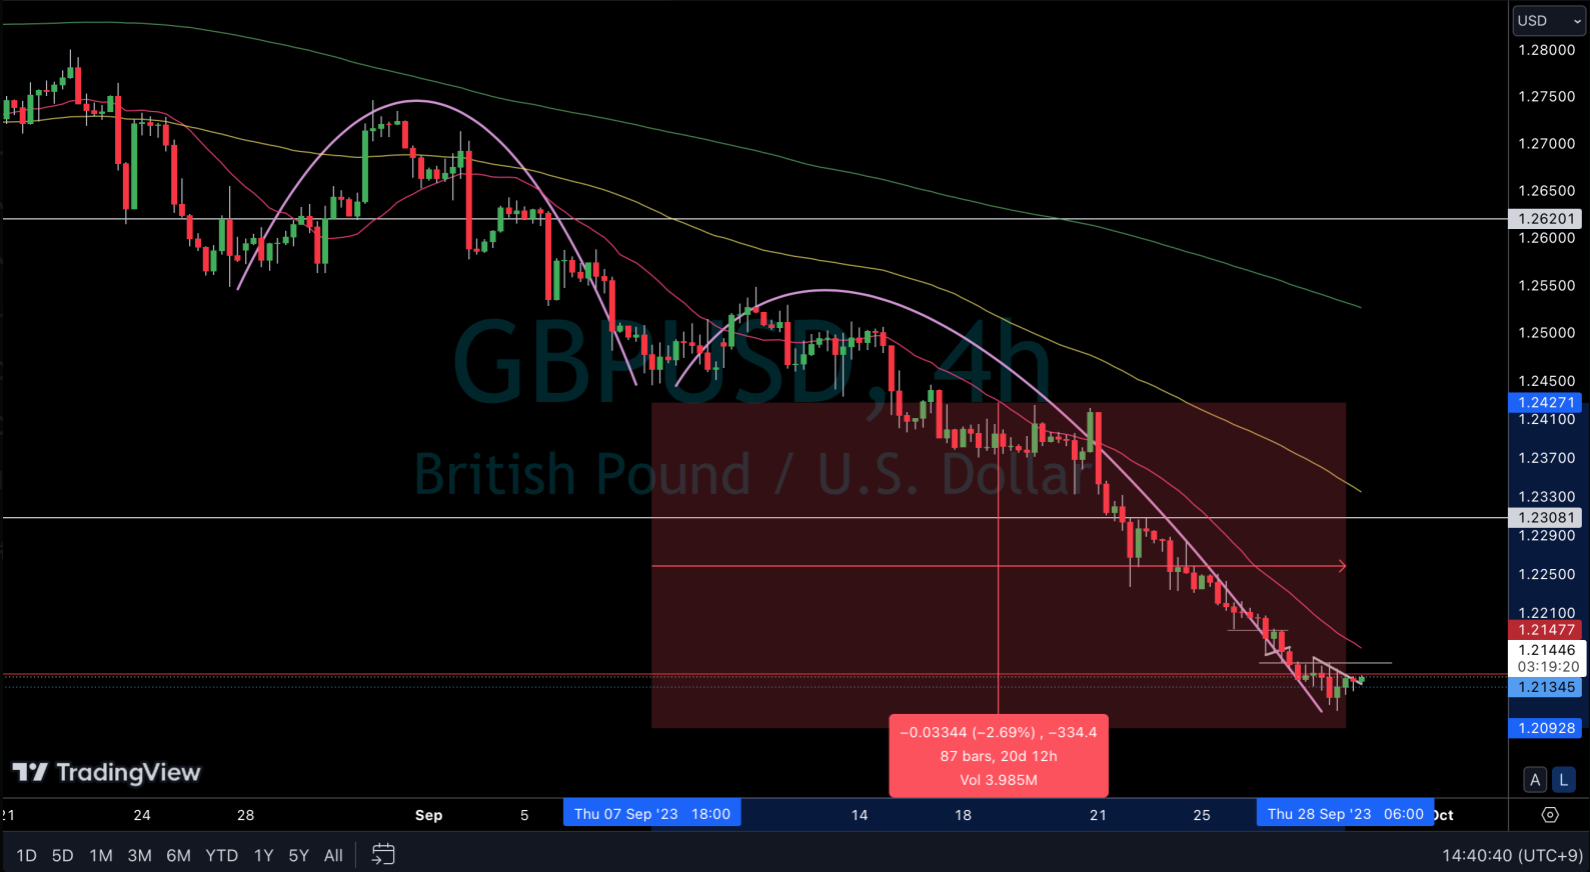
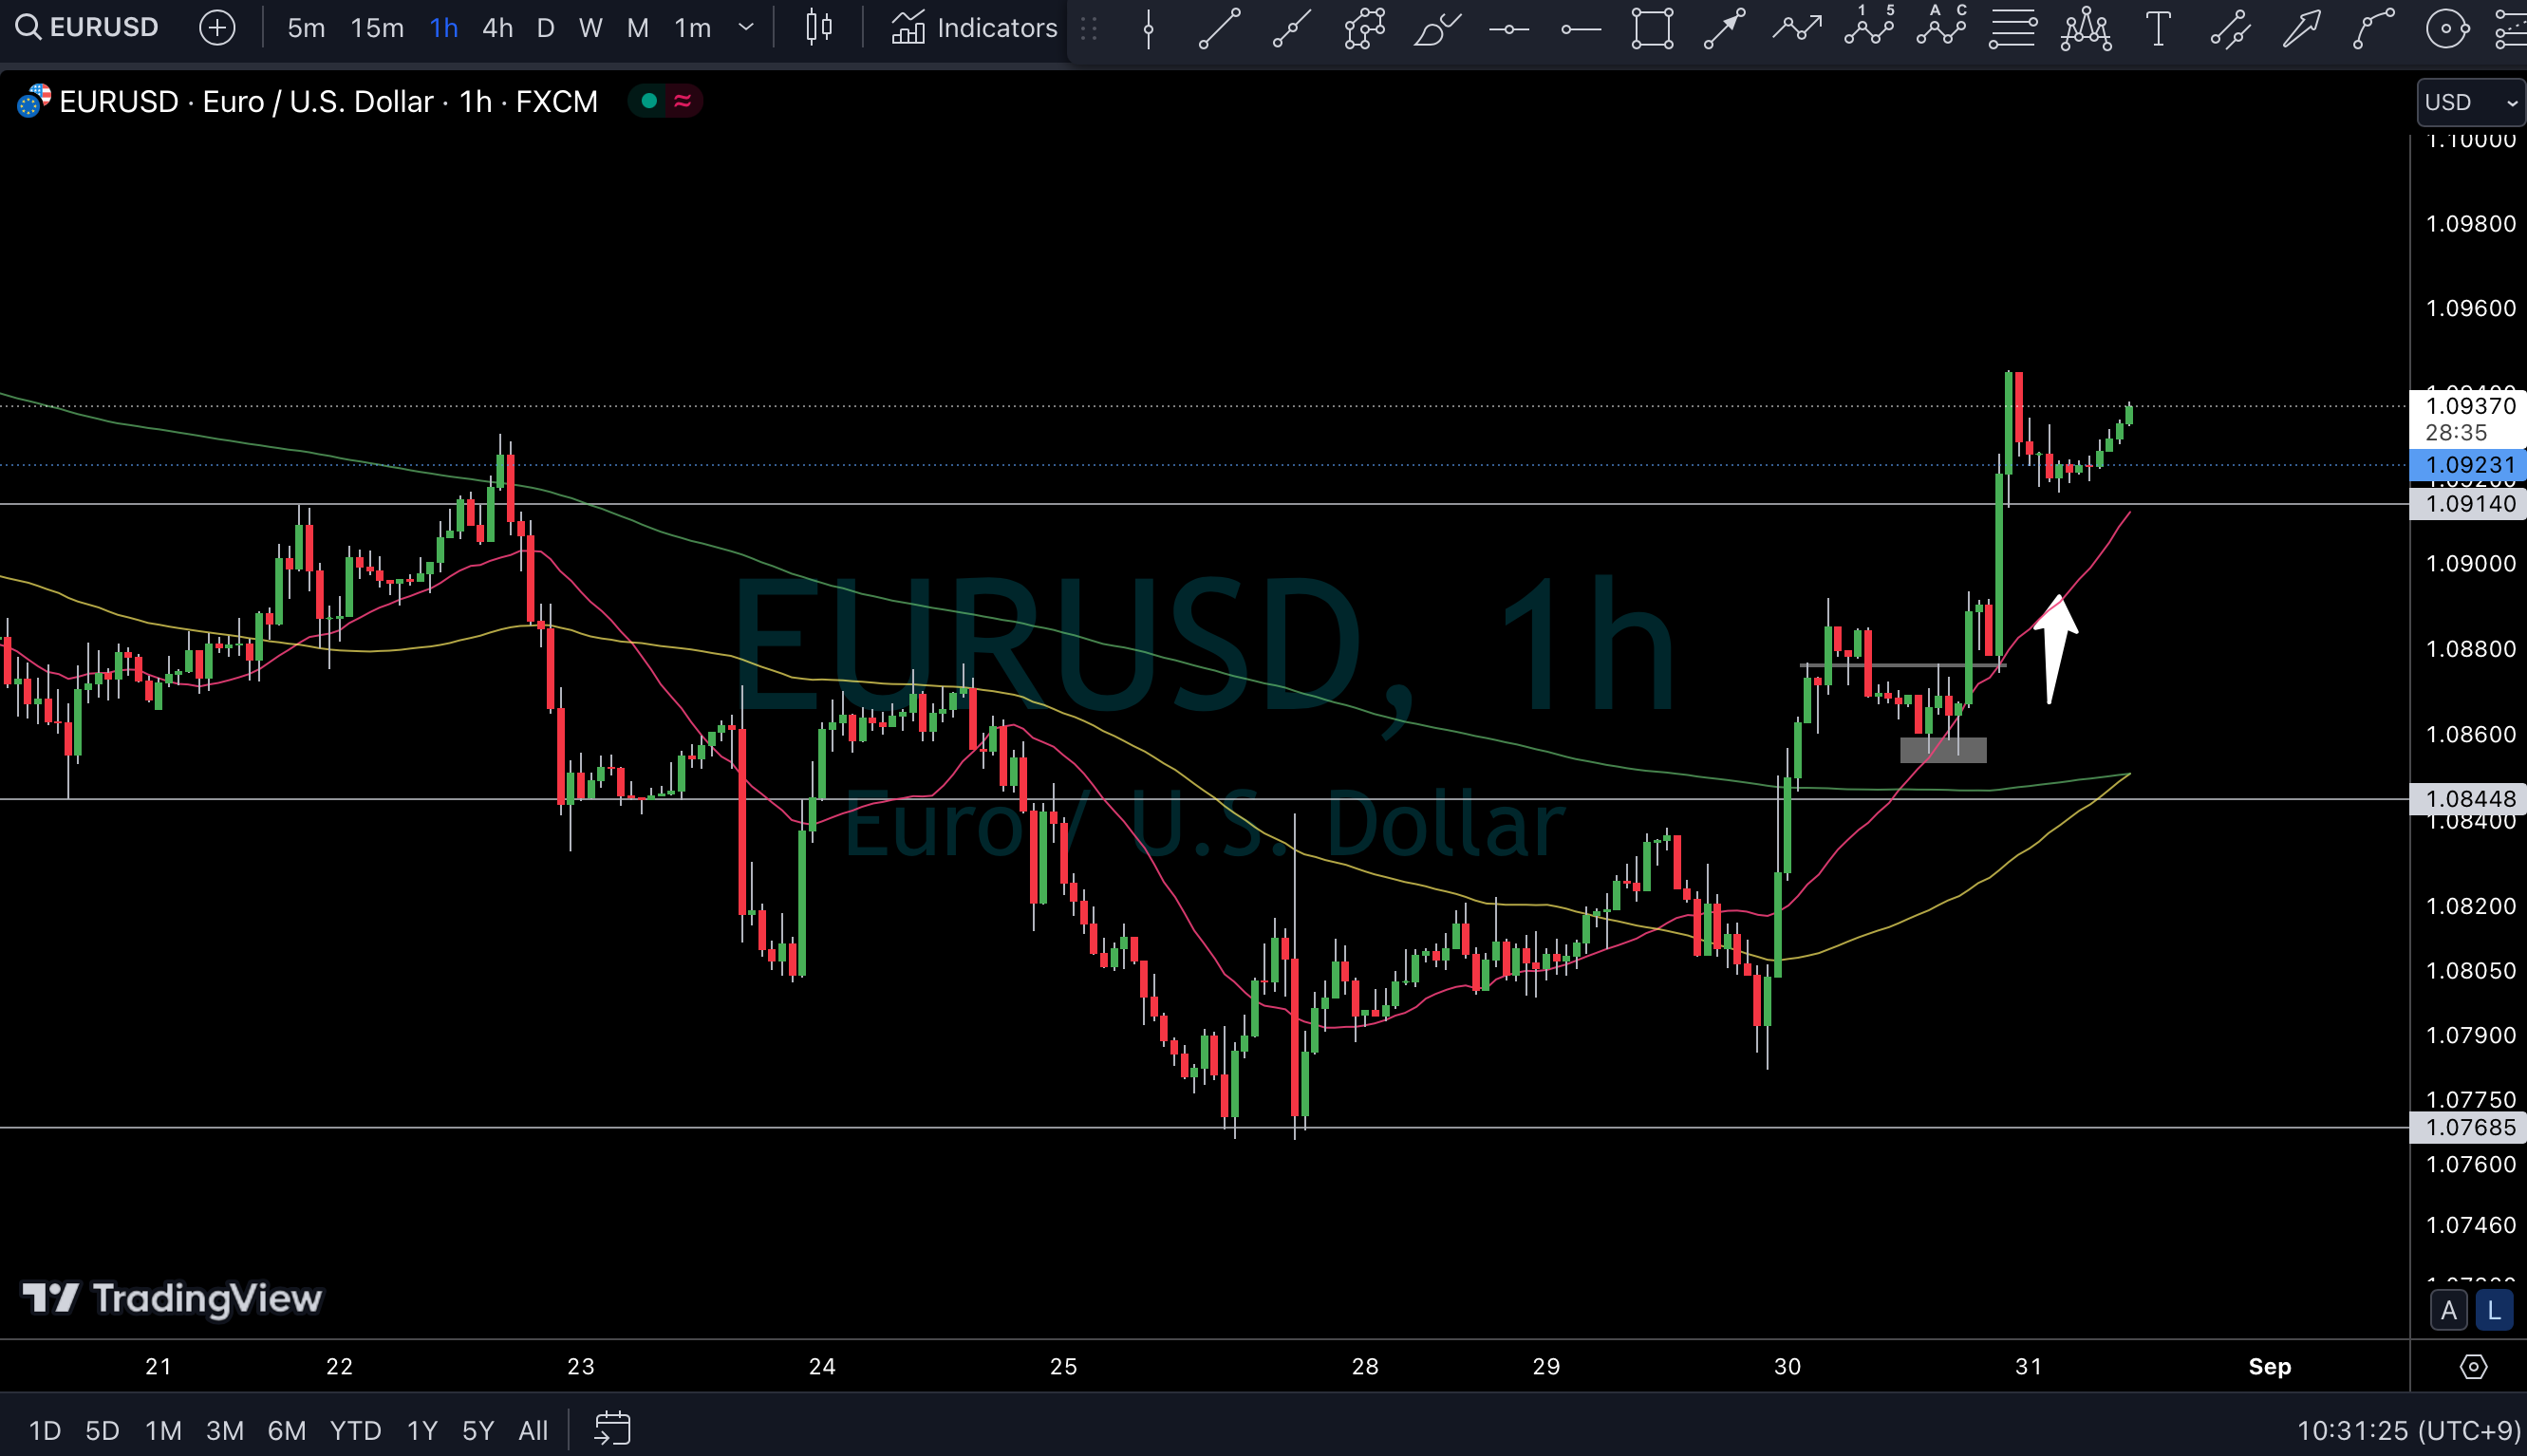
As seen in the YouTube video I posted, after a fairly large decline, in the 4H cycle the extension bottom time is expected at the 87th bar.
The daily MA is also quite detached, so from here we shouldn't chase with dollar buying; instead we want to ride the move that aims to fill the MA deviation.

If the 1-hour decline narrows and it breaks above the nearby white-band support/resistance, we would anticipate a temporary rebound driven by short-covering and a concentration of dollar-buying orders.
In the short term, whether it can clear the descending highs line and also exceed the 20 SMA; from above the 4H 20 SMA is catching up.
ー

Subsequently, it couldn't break above the recent high (pink line), and the early European session moved lower. Then it dipped in a V and rebounded, breaking above the pink line.
Because it was a pattern of falling and then rising rapidly, the entry timing was difficult; wait for a small drop and then enter above the pink line
GBPUSD long entry. Time around 17:03.
Stop loss is 1.21075 (red dotted line), breaking the low of the 4H bottom.
Since it rebounded sharply from below, if it drops a bit more and shows a bottoming move, consider adding to the position.
ー

Afterward, the entry area became the short-term pullback bottom, and it rose accordingly.
Thus, when it dips and then surges, it tends to trigger a rapid short-seller exit, leading to a sharp rise. Therefore, the entry should be at the moment it breaks a lower-timeframe pivot, or if waiting, enter immediately on a pullback. The stop-loss level does not change; only the position size may change.
After the ascent, there was Germany's CPI at 21:00 and the US GDP release at 21:30 looming.

Having rapidly reached the previous level of the red line, I took partial profit with a market order while it was extending.
⭕️+ 60 pips(remaining half)
ー

After the US GDP release, there was choppy movement and a decline.
If it gets knocked down here, there is a possibility that retracement selling could intensify, so raise the stop slightly to 1.21173 (red dotted line).
To push GBPUSD up to roughly the level of the 1-hour Dow breakdown, I closed USDCHF early and left GBPUSD running, then slept.
ー

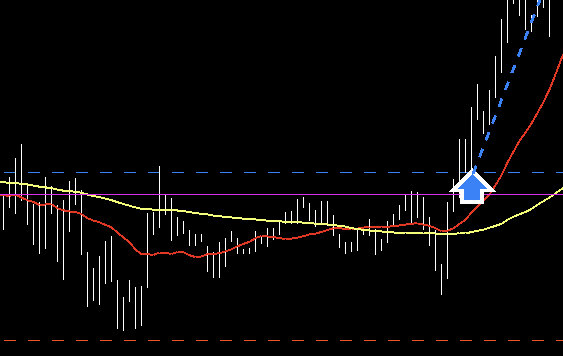
The next day, the 1-hour MA (yellow line) turned up and supported the continuation of the rise. Hold.
ー

Moved the stop before the 21:30 release, then the exit order filled. All closed here. +96 pips
Two-position average+ 78.3 pips

Around 21:15, move the stop to below the white band near the orange line.
Since it extended well, I prioritized taking profits without carrying into the next week. It was a rebound from a significant daily drop; I didn't want it to be pulled back by the data, so when it also breached the 15-minute MA and approached a recent high, I moved the stop below this level.

At the moment of lower highs and lower lows on the 5-minute chart, the exit order was filled (yellow circle).

Thereafter, it again formed a short-term lower high and fell sharply.

Thus, this was a profit-taking trade achieved by splitting at key levels and before the indicator release, with lower-timeframe lower highs.
ー
This article mainly focuses on trade review and analysis, so for important details on entries, exits, and market context, please refer to the PDF materials below.
→https://www.gogojungle.co.jp/tools/ebooks/46358
ー
< Notation Summary >
• Moving Averages
→ 20 SMA (red), 75 SMA (yellow), 200 SMA (green)
The top priority is to look at the 20 SMA on each timeframe according to Graham's Rule.
The 75 SMA on the 15-minute chart is shown to view the 20 SMA on the 1-hour chart in the 15-minute chart. Technically it's 80 SMA, but since it's used as a zone rather than a precise line, we view it within a range, so it's set to 75 SMA.
ー
• Timeframe labeling locations
Trade screen (MT5) screenshot → top-left (M15 = 15-minute chart)
Chart screen (Trading View) screenshot → top-left, chart background, bottom-right shows the time at that moment
ー
• Cycle Theory
☆pc
→ Refers to the weekly cycle. The weekly cycle is called the Primary Cycle (Primary Cycle).
→ On weekly chart, number of candles25 to 35 candles roughly form ( bottom → top → bottom)
☆mc
→ Refers to the daily cycle. The daily cycle is called the Major Cycle.
→ On daily chart, 35 to 45 candles roughly form ( bottom → top → bottom)
→ Within one larger weekly cycle (pc), this daily cycle (mc) comprises 3-4 cycles. That is, the bottom of the weekly cycle (pc) is the 3rd or 4th bottom of the daily cycle (mc).
☆4hc
→ Refers to the 4-hour cycle. The 4th cycle is called the 4H Cycle.
→ On the 4-hour chart, 60 to 80 candles form one cycle ( bottom → top → bottom)
→ Within one larger daily cycle (mc) inside this, the 4-hour cycle (4hc) consists of 3-4 instances. The bottom of the daily cycle (mc) is the 3rd or 4th bottom of the 4-hour cycle (4hc).
-
These cycles' notations such as "first, second, third" are sometimes shortened like daily cycle second → mc-2, 4-hour cycle third → 4hc-3.
-
☆ RT (Right Translation)
→ Light Translation (Right Translation) のことを指します。
→ If the rise continues into the latter part of the cycle and the top is formed in the latter half, the decline becomes shorter, and a bottom is formed without breaking the starting point (i.e., an uptrend).
☆ LT(Left Translation)
→ Left Translation のことを指します。
→ If a top is formed in the first half of the cycle, the decline tends to be longer, and bottoms after breaking the starting point (i.e., a downtrend).
※ これらはあくまで理論であって、毎回この通りに相場は動きません。環境認識で大まかな想定をしていくために参考にする一つの考え方(道具)となります。
Yoppi's published article is here!