eleconomics Featured article (Culture Day) Ex-rights Japanese stocks, the key remains unchanged, held by foreign investors, and others
How to draw channels (Archive)
Announcement
Temporarily, we will publish articles on Monday, Wednesday, Thursday, and Friday
We will switch to live streaming around Tuesday 20-21.
Announcement will be posted on Twitter.
On Mondays I will share a rough weekly strategy in an article, and I hope to have a follow-up on Tuesdays.
The Nikkei average started about 200 yen lower due to ex-rights, and thereafter declined by about 300 yen as selling continued after the ex-rights day.
It has fallen to around 31,800 yen, near the position-volume zone I watch.
I have just entered the first position (around 31,770).
The first entry was lower than expected, but I do not intend to increase the lot size and plan to keep the margin high.
Even when it rose to around 32,700, and around 32,500 yesterday—the Tokyo market’s support notwithstanding—if U.S. stocks do not stop falling during the New York session, a bottom will not be reached, volatility will stay high and new lows will be set, so for the Nikkei there doesn’t seem to be a scenario of a stable level.
U.S. Treasury yields continue to rise.
The 10-year yield remained above 4.6% last night.
Be mindful that this is driven by seasonality and supply-demand conditions, and not directly by economic indicators.
Ultimately, with cashing out for tax payments and assessing a possible government shutdown continuing, selling begets more selling; therefore, the same market conditions are expected to persist until October.
However, both the U.S. stock market and the Nikkei have moved into pullback levels with some support in place; there remains room to buy the dips, but the current price range is far more favorable for buying than last week.
This decline cannot be reversed by indicators in the same way as before, so bottom-finding is difficult; such a desire to call a bottom may prevent you from holding positions when a reversal comes, so again I want to enter with ample margin.
The S&P 500 did push to new lows, but closed with a daily pin bar.
The first line of the N calculation is currently acting as support.
We cannot judge it with economic indicators, so it's purely price action, but like the Nikkei, it should be a good time to place the first entry.
The Dow-Nikkei spread is in a consolidation range.
Since a breakout to the downside is expected, the dynamic of US stocks underperforming Japanese stocks is expected to continue.
In terms of level or timing, there doesn't seem to be a clear reason for a reversal.
It's odd that price moves without much to say, but it moves on supply and demand; macro won't change, so there's nothing else to say except waiting for the month-end to pass, and unless we see funds flowing into bonds, buying stocks won't lead to big profits.
I based my first buy on technical grounds, but I think today's New York session moves are crucial, and I want to see whether I can close the daily chart with a bullish candle.
So far the stock market has corrected by about 5%, but a 10% correction is not unusual for this time, so overconfidence should be avoided.
Conversely, you should keep in mind that you may need to trim positions while expecting a stop near 10%.
This article does not provide buy/sell timing signals or recommendations.
Please make your own investment decisions.
It seems someone reached the 100-million milestone in last night's stream, and I received a comment during the stream, congratulations.
It was someone who asked about managing 200,000 yen last year, so reaching that level in a year and a half from 200,000 yen.
You can lose it in an instant, so please stay safe and keep going.
Today the Nikkei average is passing SQ, and profit-taking selling is dominant.
U.S. stocks finally stopped falling last night, and the Nikkei will make the final pushI think it will become the usual market.
A day when I also expect a short-cover ahead of the weekend.
For the S&P 500, whether the blue line can move above the previous day's high will be key.
If it breaks above, the inverted head-and-shoulders pattern would be completed.
Last night's London fixing saw rates peak, so the dollar's strength may pause and a rebound-like move appears.
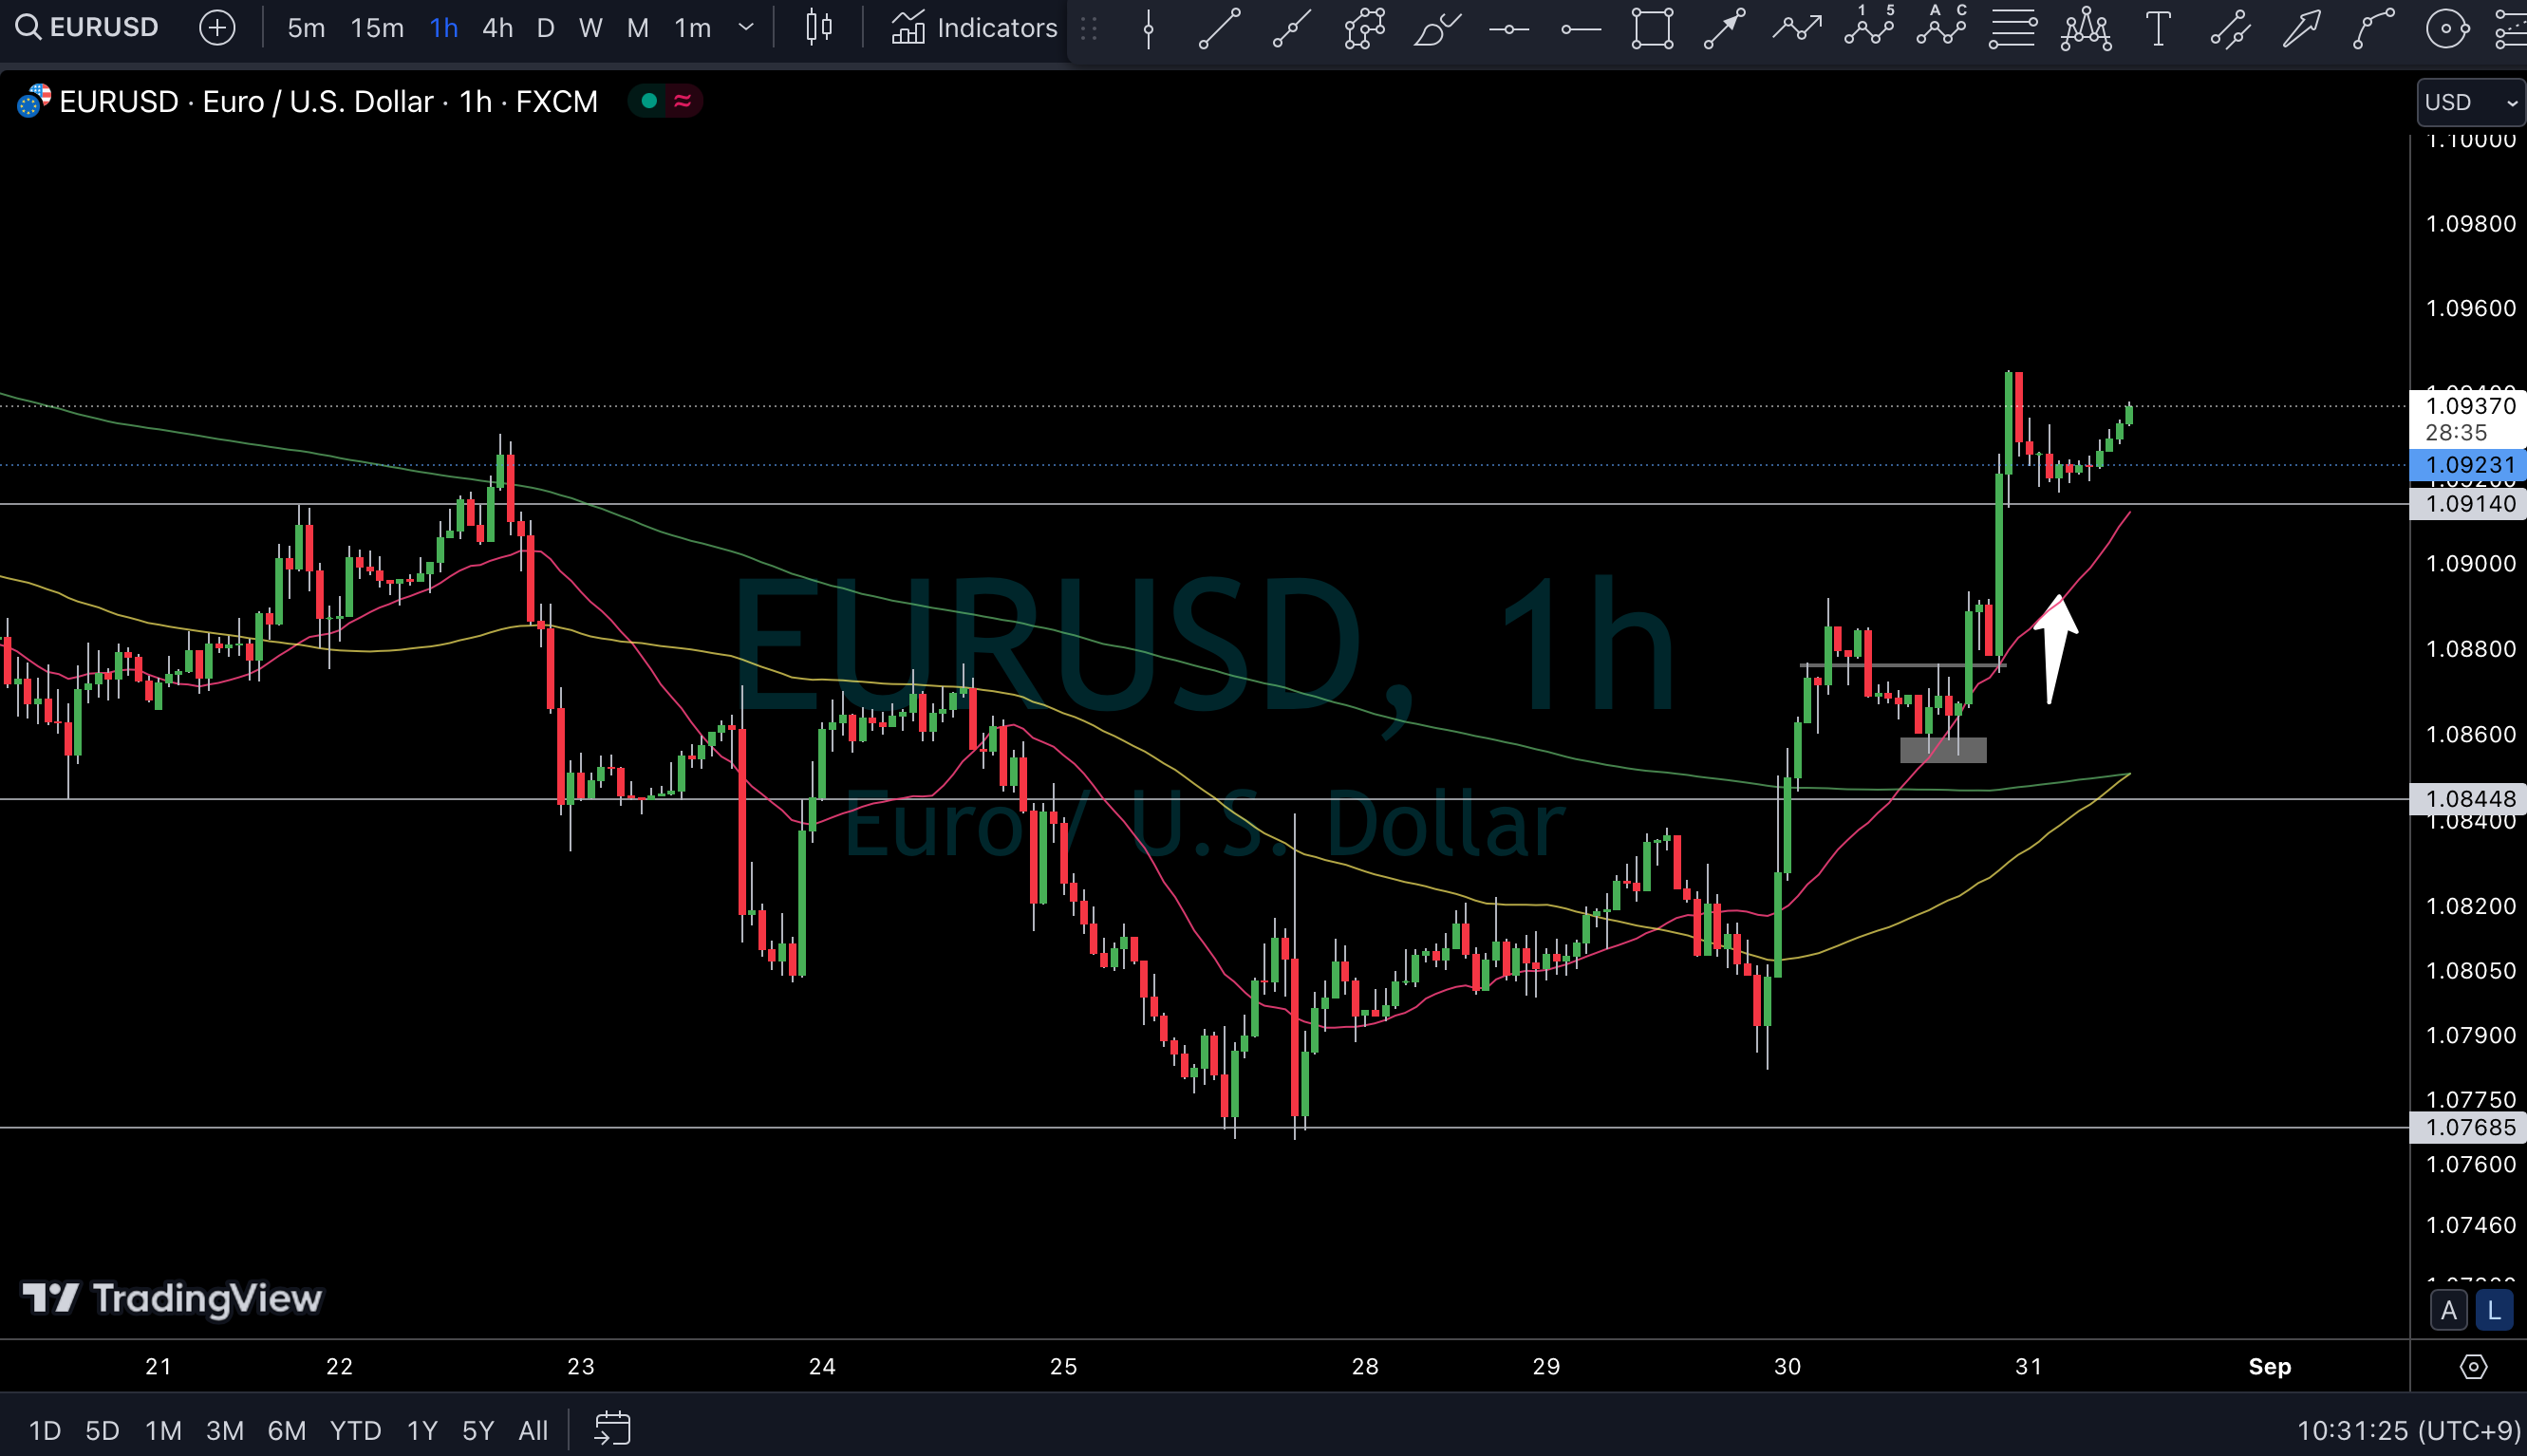
EUR/USD ended up testing the channel lower bound, briefly dipping a little below 1.07 before rebounding.
As a guideline, the channel is functioning, so I want to buy while confirming the 1.07 support.
Crude oil has been moving since 18:00.
Recently, in an uptrend, there have been many bullish candles.
Considering the channel's center line as support, is it day trading?
A major pullback isn't expected given the market tone.
This week has been a week where trading did not click for a while.
The short-term charts do not look reassuring; I can gauge the overall direction roughly, but many charts are in half-baked shapes, so it seems necessary to take on a certain amount of risk to enter.
There is no change to the overall monthly trend of watching dollar weakness and yen weakness.
Clearly, this was a week that did not go well, so I won’t say much; I’ll do my best again starting next week.
This article does not provide buy/sell timing signals or recommendations.
Please make your own investment decisions.
Here is the article published by eleconomics!