

[October 31, 2023] Historical verification using the sky and earth indicators (EUR/JPY)
October is coming to an end as well. This time, I will introduce a recent, excellent entry point that appeared in the USD/JPY chart.
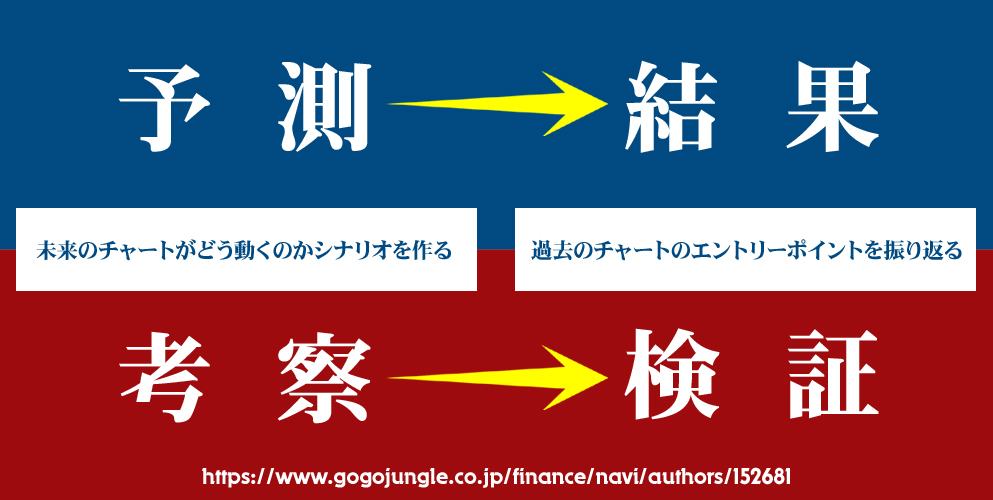
・This article mainly focuses on chart analysis and past verification using “The Heaven and Earth Indicator.”
・The content is built on the premise of using the most accurate tool,「15-minute chart + 4-hour chart simultaneous monitoring method」.
・This tool is a revolutionary trading tool that can be used even if you do not understand the so-called FX theories (Elliott wave, Dow Theory, Gartley/Gramm’s rule, cycle theory, price action, Fibonacci, support/resistance, channels, etc.).

The Heaven and Earth Indicator is a trading method using an original indicator developed by me, Abu-san, released in February 2022.
Thanks to everyone’s support,「GogoJungle Award 2022 prize was awarded.
■ Heaven and Earth Indicator
https://www.gogojungle.co.jp/tools/indicators/35780
■ Heaven and Earth Mountain
https://www.gogojungle.co.jp/tools/indicators/37744
■ Heaven and Earth EA ~ Semi-discretionary Auto Trading System ~
https://www.gogojungle.co.jp/tools/indicators/43213
■ Heaven and Earth Dashboard
https://www.gogojungle.co.jp/tools/indicators/46257
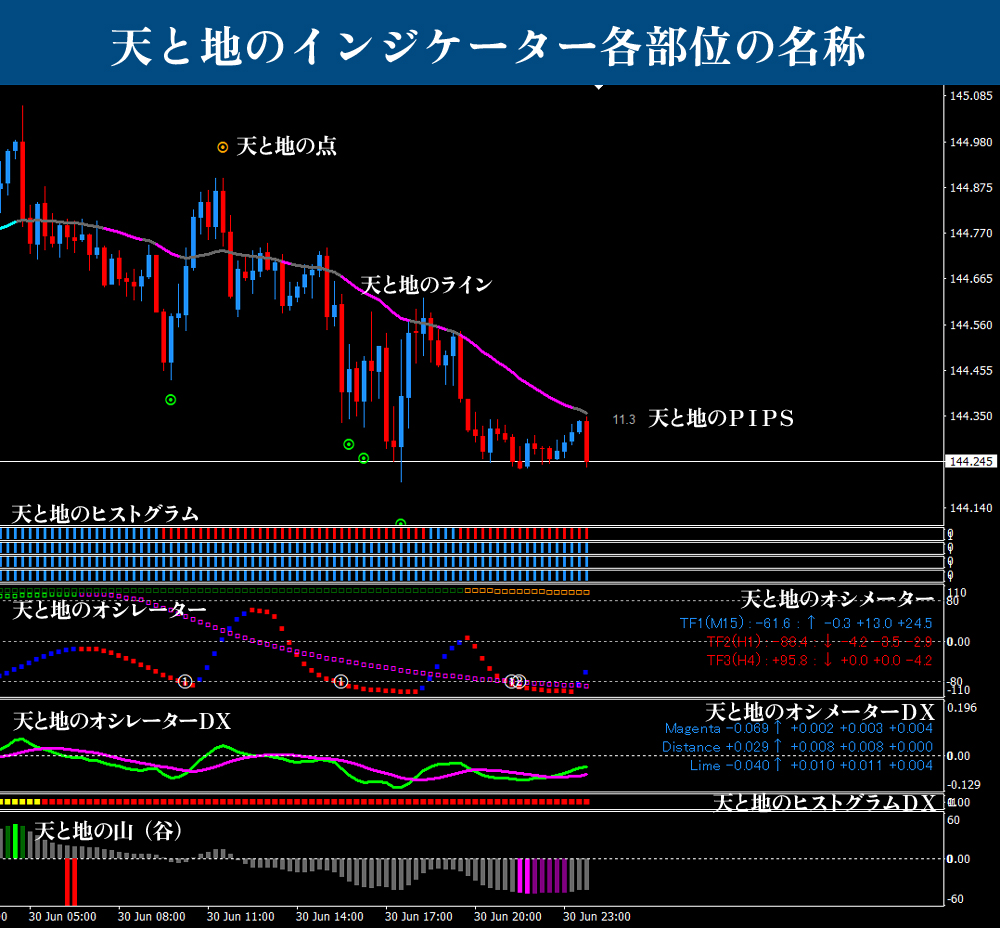
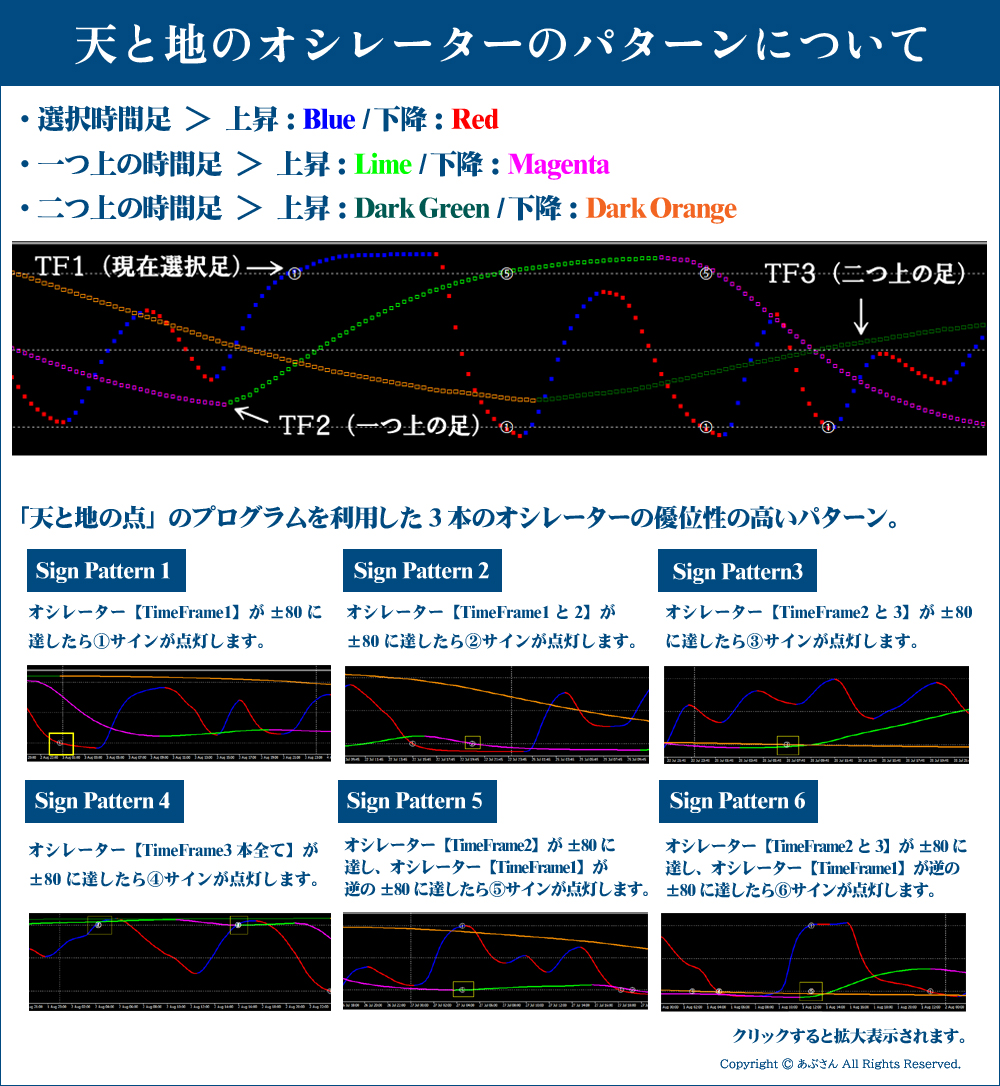
※Regarding specialized terminology used in this blog, please refer to the below “Names of the parts of Heaven and Earth Indicator” and “Heaven and Earth Oscillator patterns.” If you have any other questions, you can largely understand by referring to the Heaven and Earth Indicator sales page. For existing users, the manual will suffice, right?
Now, I would like to move on to the verification.
Thank you in advance!
※ All images enlarge when clicked.

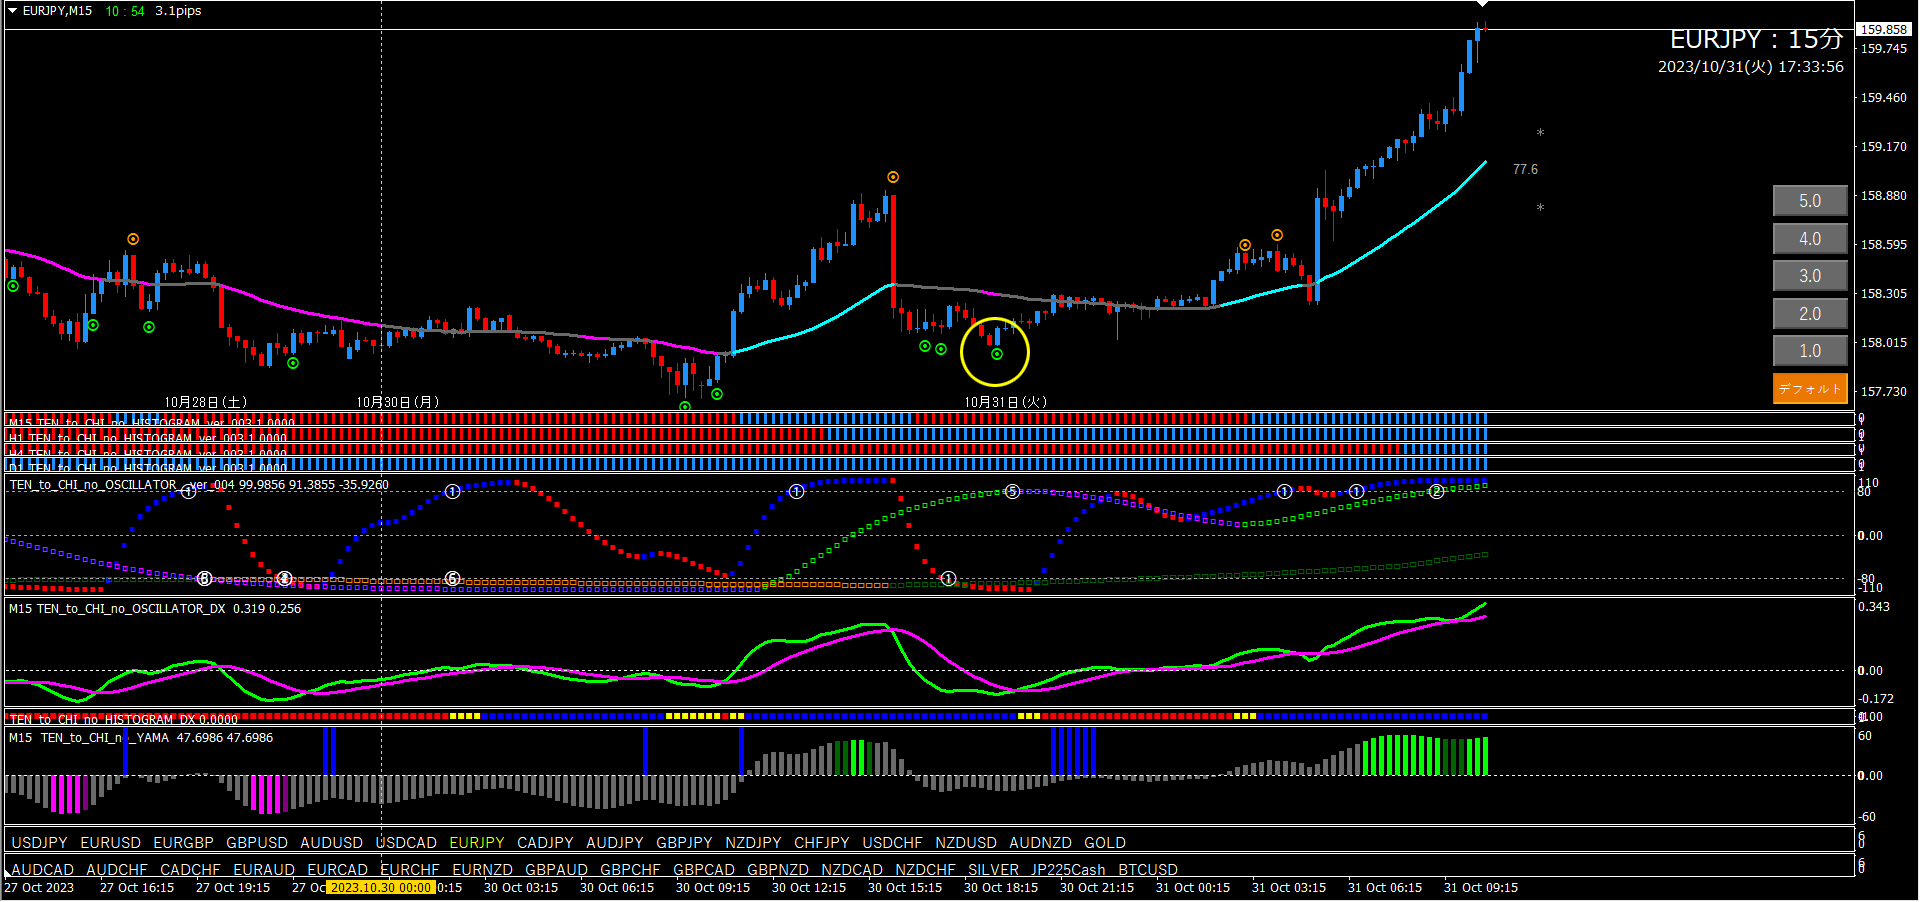
EUR/USD15-minute + 4-hour Past Verification (from 2023-10-30 to present)
※ Please note the yellow vertical line. There is also a yellow vertical line at the same location on the 15-minute chart. (UsingLINK LINE)
■ 4-hour chart (Context)
The yellow vertical line indicates an upwards trend in view.
Oscillator TF2 is rising, TF1 reached -80, long signal dot, oscillator DX is marginal, but Distance was downward, so considered good. A signal to end the uptrend would be a short dot signal or a DX downward cross.
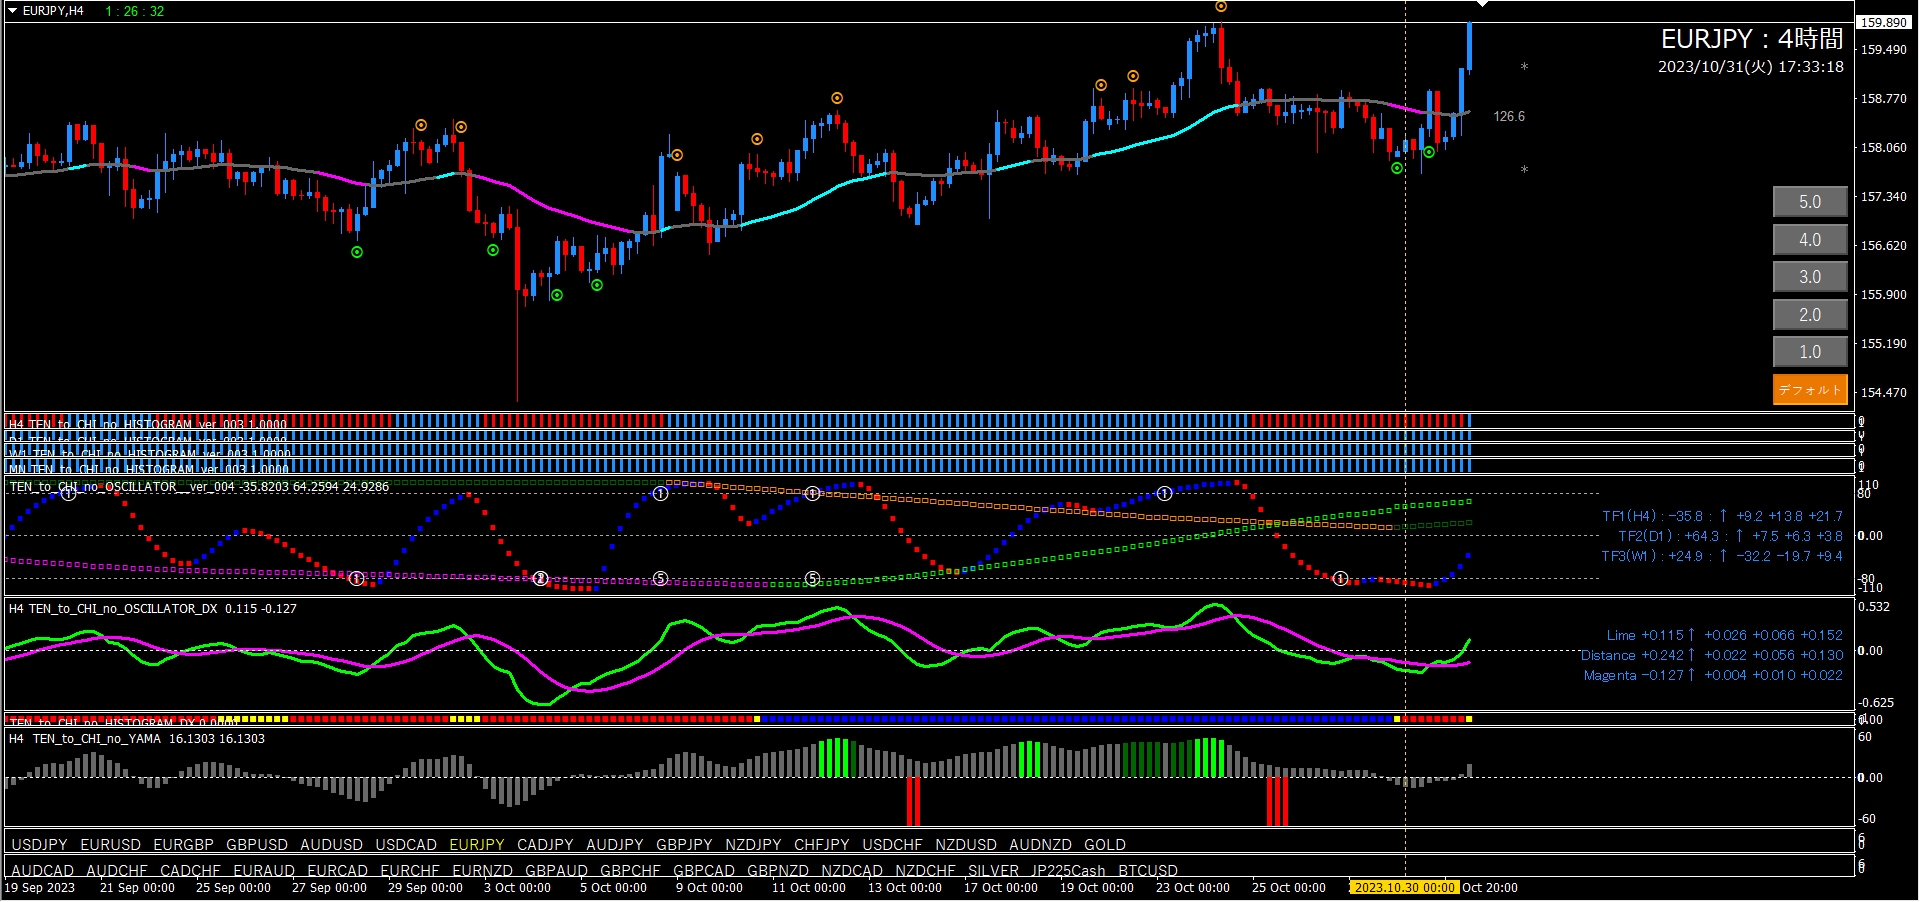
The yellow vertical line is the location where the 4-hour chart indicated an uptrend. We will target long entries only on the 15-minute chart.
Yellow circle means Oscillator TF2 is rising, TF1 has reached -80, Oscillator sign⑤ is about to light, DX is nearing an upward cross, an excellent long entry point. Two long dot signals appeared just before, but since DX is significantly divergent, you can skip them. That's the strength of DX. Take profit on the short dot signal, about 40 pips captured. But it kept extending. Since 4-hour chart clearly shows an uptrend, you could also convert the profit target to a line color change. That would be over 200 pips... well, it's hindsight, so let's move on without looking back.
■ If using Heaven and Earth EA (used on the 15-minute chart)
When the 4-hour chart indicates an uptrend, set EA pattern ① on the 15-minute TF2 rising.
As an advanced technique, after automatic entry on a long signal, you can switch to“TEN_to_CHI_no_LINE_TRIGGER_AUTOEXIT”, which will auto-close when the line color turns pink. This method yields a very wide price range. Please wait a little longer for its distribution.

That is all.
We hope this is helpful to everyone at least a little.
