

Usage of the "Visualization Indicator" (Part 118)
Utilization of the "Visualization Indicator" (part118)
1. Further development of the "28 Currency Pairs List Indicator" into an indicator
“8CPVisualization Indicator”to drawEURAUD.
The “8CPVisualization Indicator” includesOceaniaLondon version,NewYork version,AnyCP version. This time, the Oceania version was used. version,
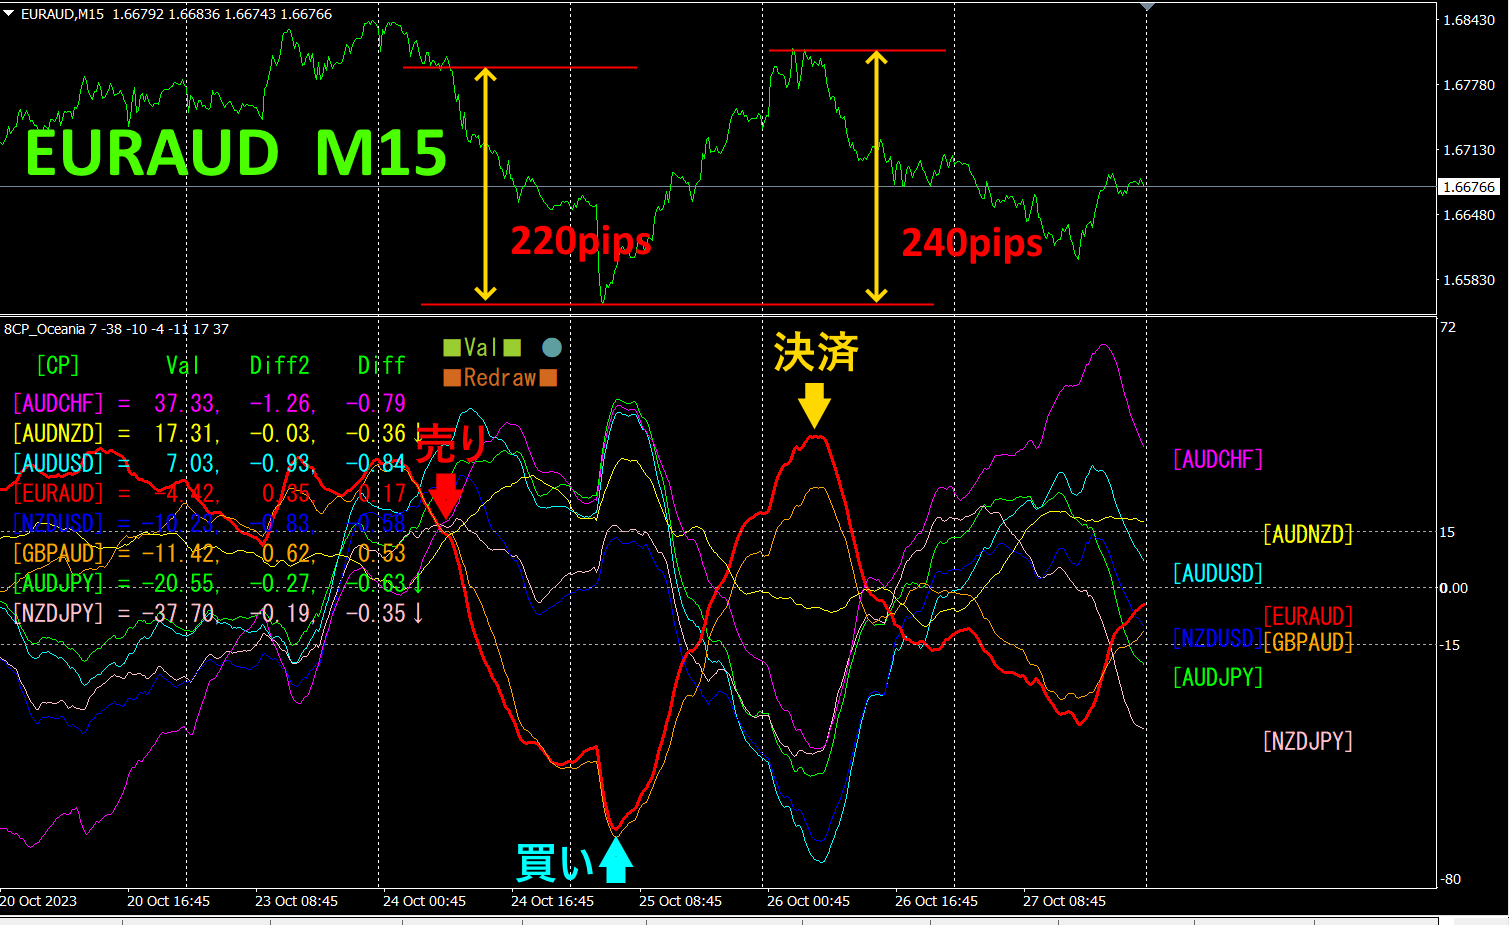
The upper half is the EURAUD 15-minute chart. The lower half is from the “8CPVisualization Indicator.” The red thick-line graph corresponds to EURAUD.
On Tuesday, EURAUD broke below the chart cluster, so we sell EURAUD. We settle at the bottom on Wednesday, and refraining to aim for a rebound, we reverse to buy. On Thursday, we settle at the peak, gaining a total of about220pips and about240pips, totalingabout460pips of profit.With the “8CPVisualization Indicator,” by targeting the largest moving currency pair’s deviation/convergence, we achieved substantial profit using the usual winning approach.
2. Best SelectTry the indicator
The figure below is a screenshot taken at2023 year10 month23 day17:40 (JST)
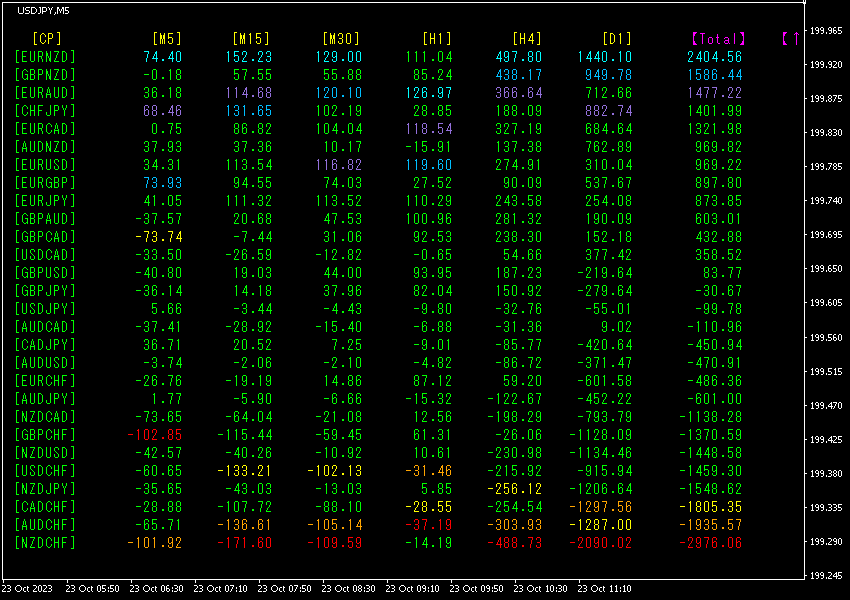
TotalThe numbers are sorted in descending order. The topmost row, EURNZD, is blue in all time frames except [H1], and the Total value is2404.56, a large positive number. This indicates a strong uptrend in EURNZD.EURNZD shows a strong upward trend.
Now, let's look at EURNZD's chart.
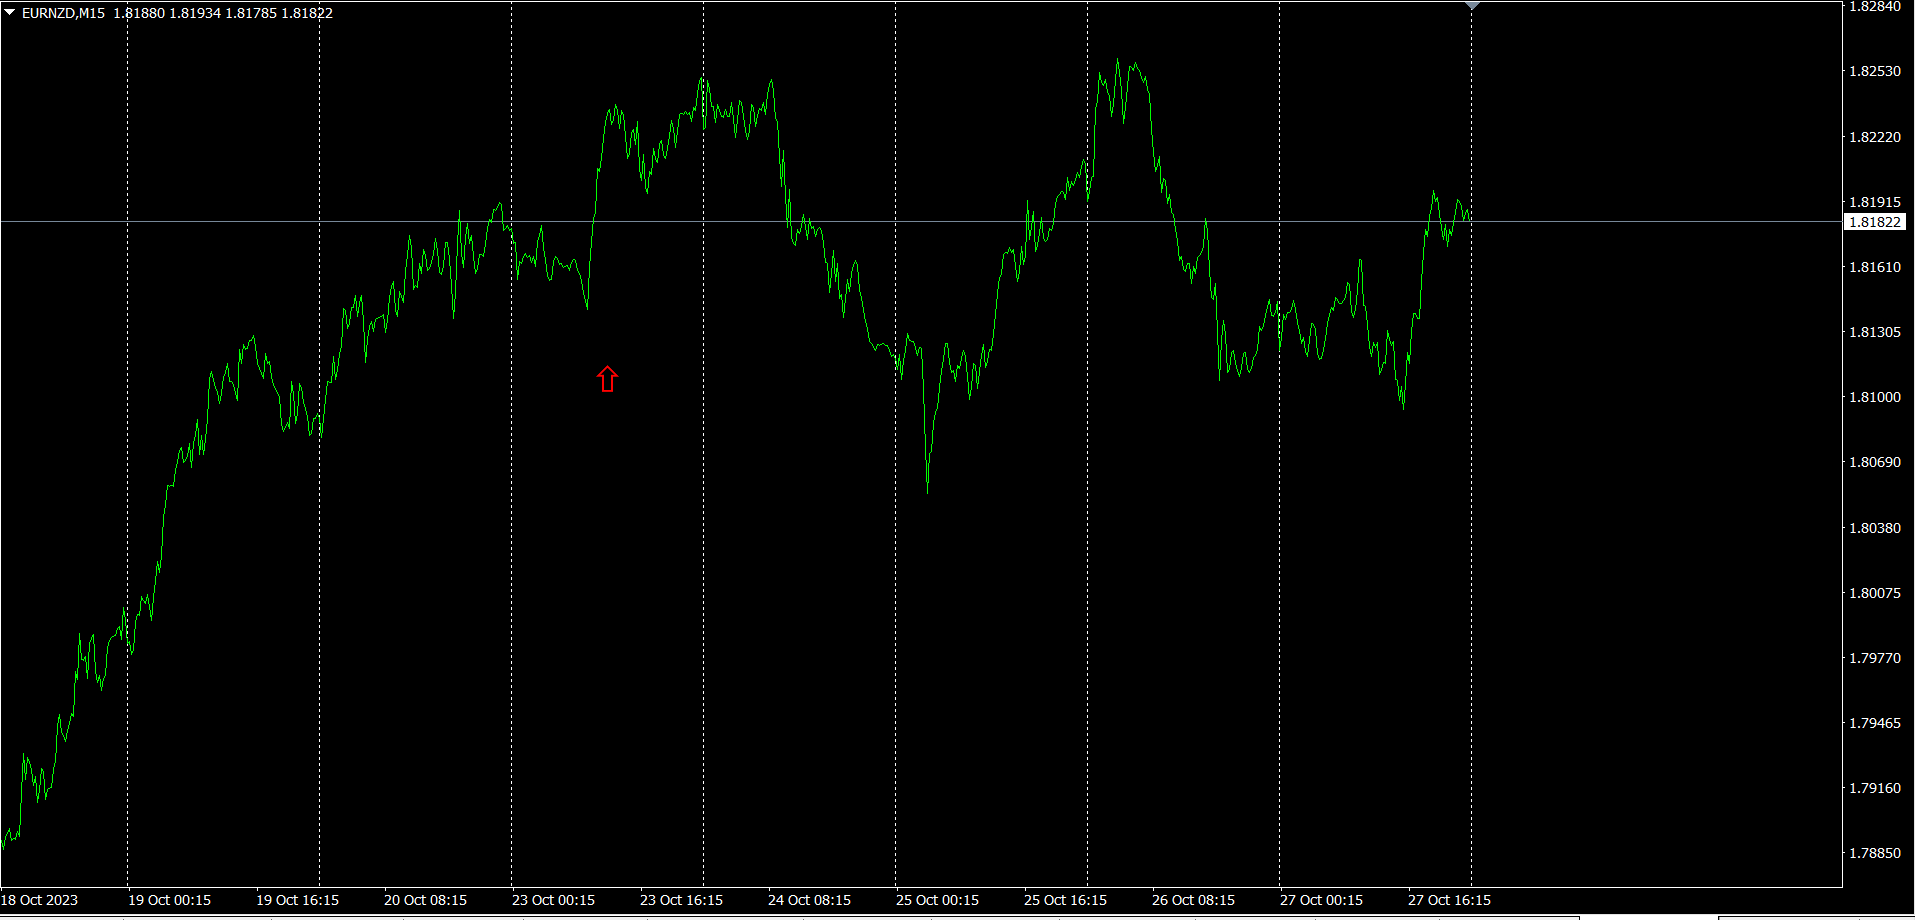
The red arrows indicate the section where the screenshot was taken. It catches a spike in the middle of an uptrend with a rising slope. If you had bought here, you could have earned about55pips profit for the day.
The “28 Currency Pairs Best Select Indicator
“28 Currency Pairs Best Select Indicator”
https://www.gogojungle.co.jp/tools/indicators/35128

3. What happened to EURJPY, which has been tracked since May of the year before last?
year5 monthEURJPY movement has been tracked.
To view the overall trend, a30 minute chart covering roughly the last3 weeks is drawn.
Previously, I wrote the following.
EUR is heading upward,JPY is heading horizontally. Therefore, the future forEURJPY is expected to rise.
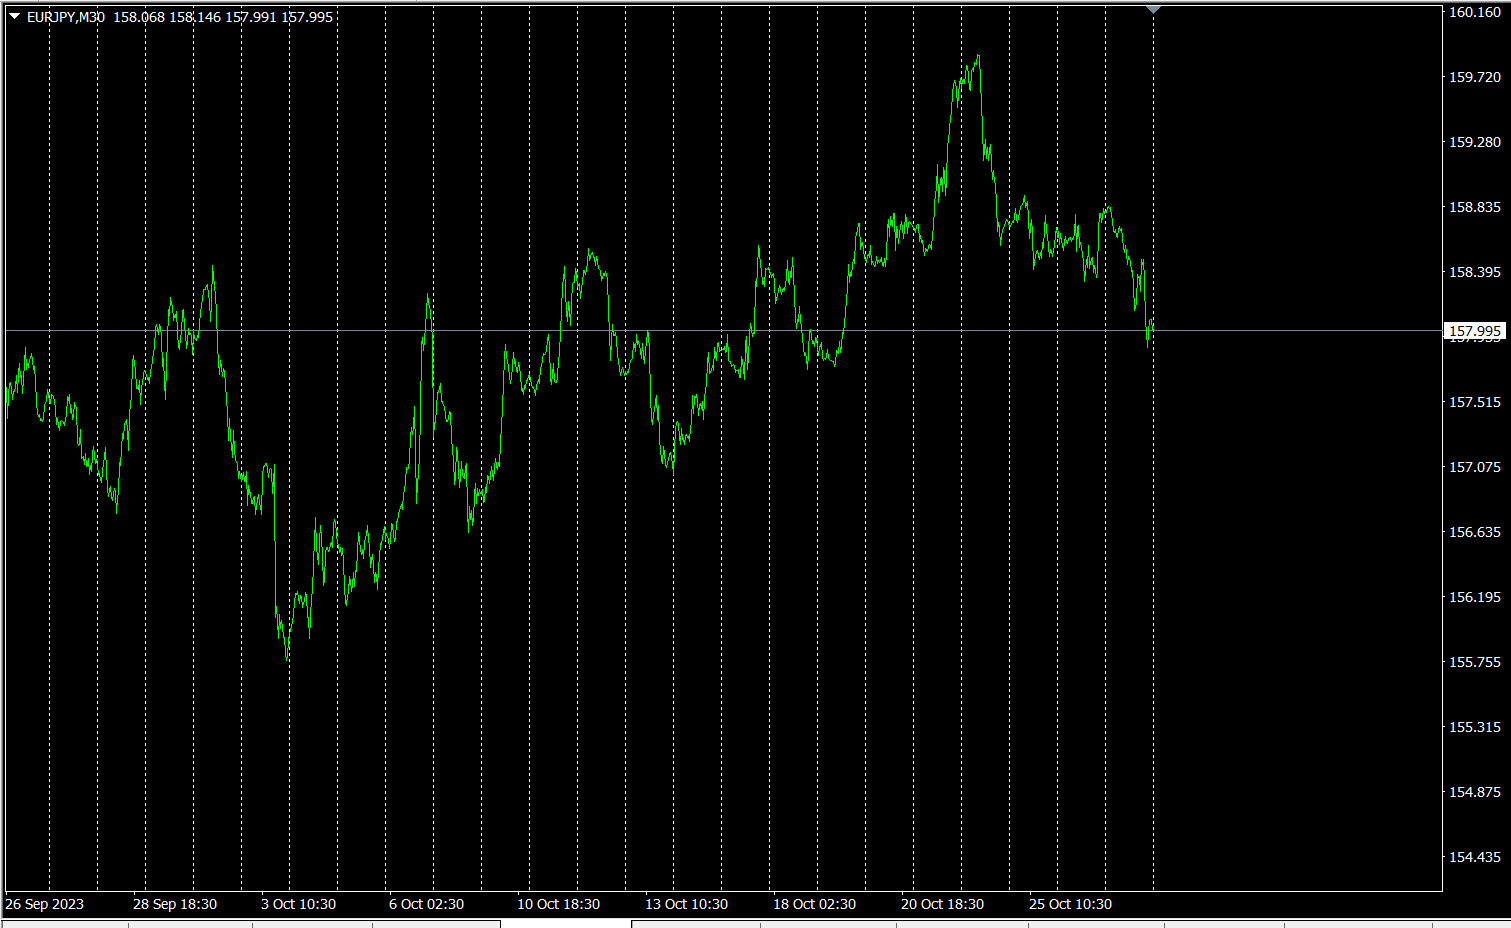
Monday surged upward, but then retraced.
4hourly currency strength chart.
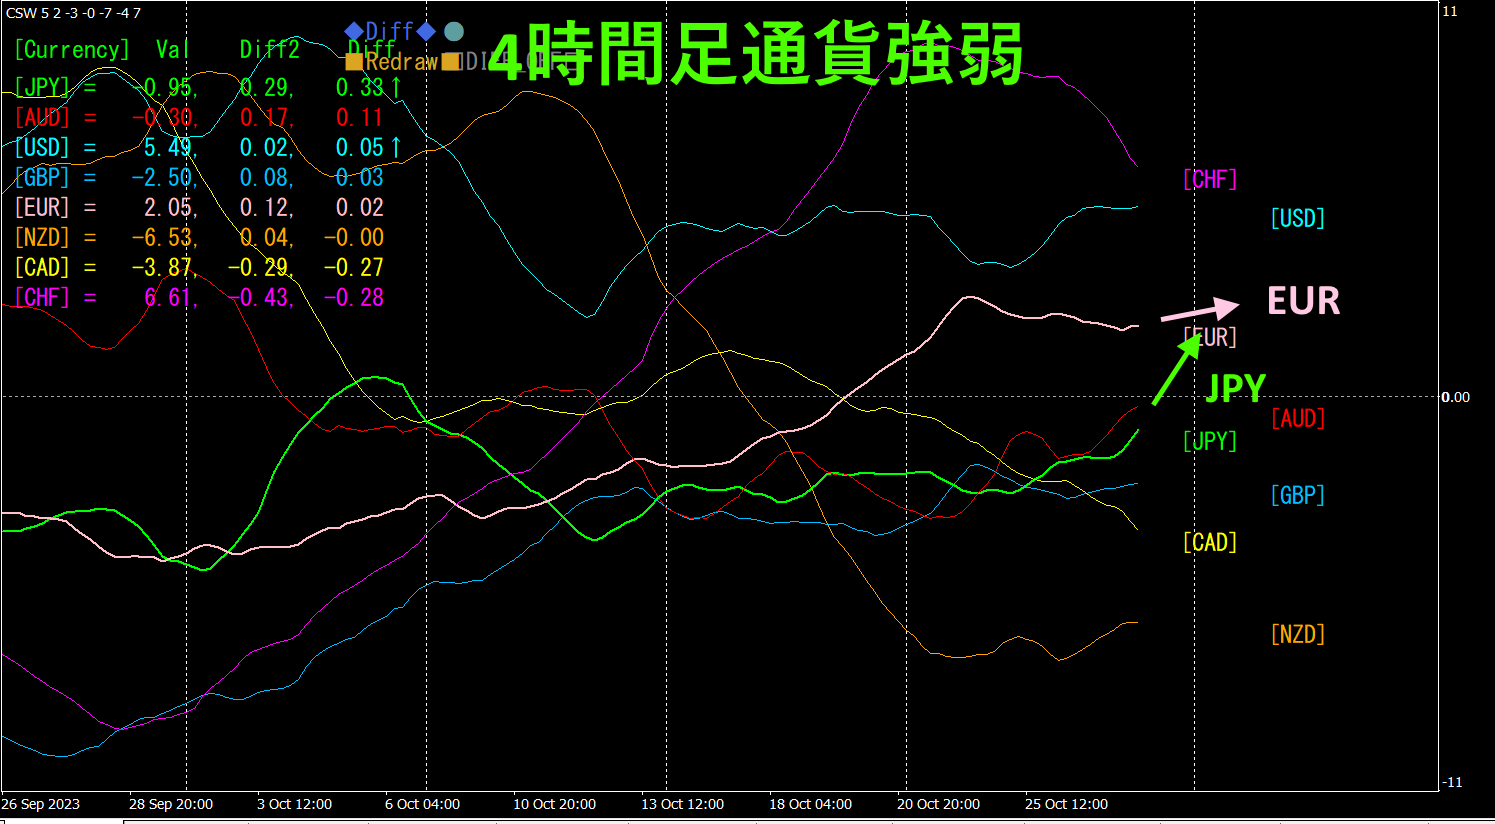
Pink isEUR, green isJPY.EUR
4. Look for peaks and troughs across all currency pairs and craft a trend strategy (target:NZDCHF)
Previously,2505「天底Search Indicator」 was used, and the next new target selected wasNZDCHF. We are aiming for a rise from the bottom.
Now, let's look at NZDCHF’s daily chart.
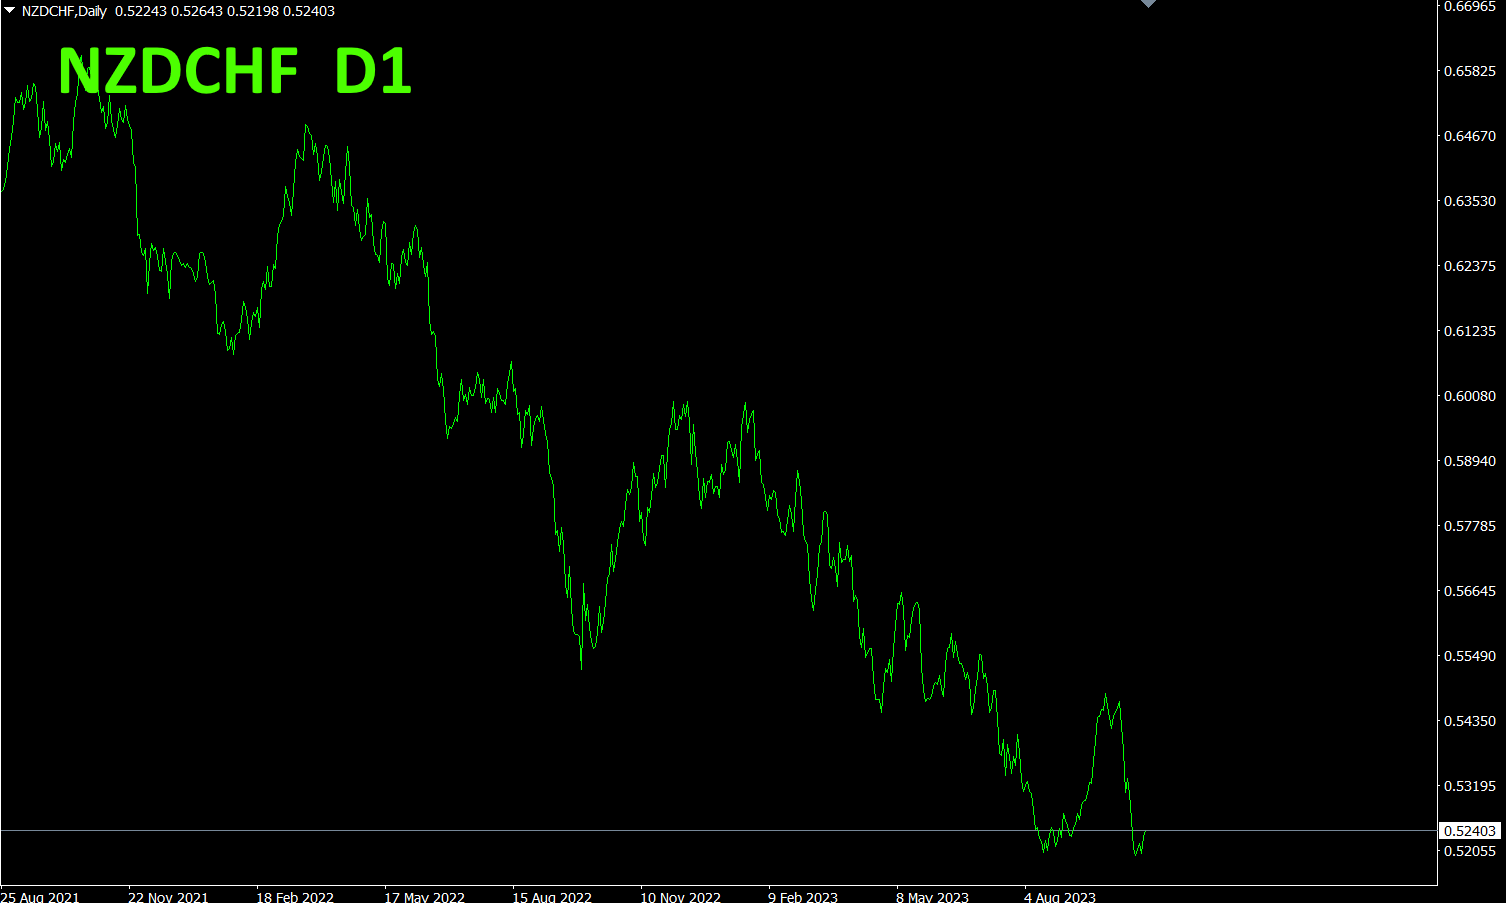
NZDCHF has been in a continued decline from a right-shoulder pattern, but appears to be forming a double bottom at the bottom.
hour chart
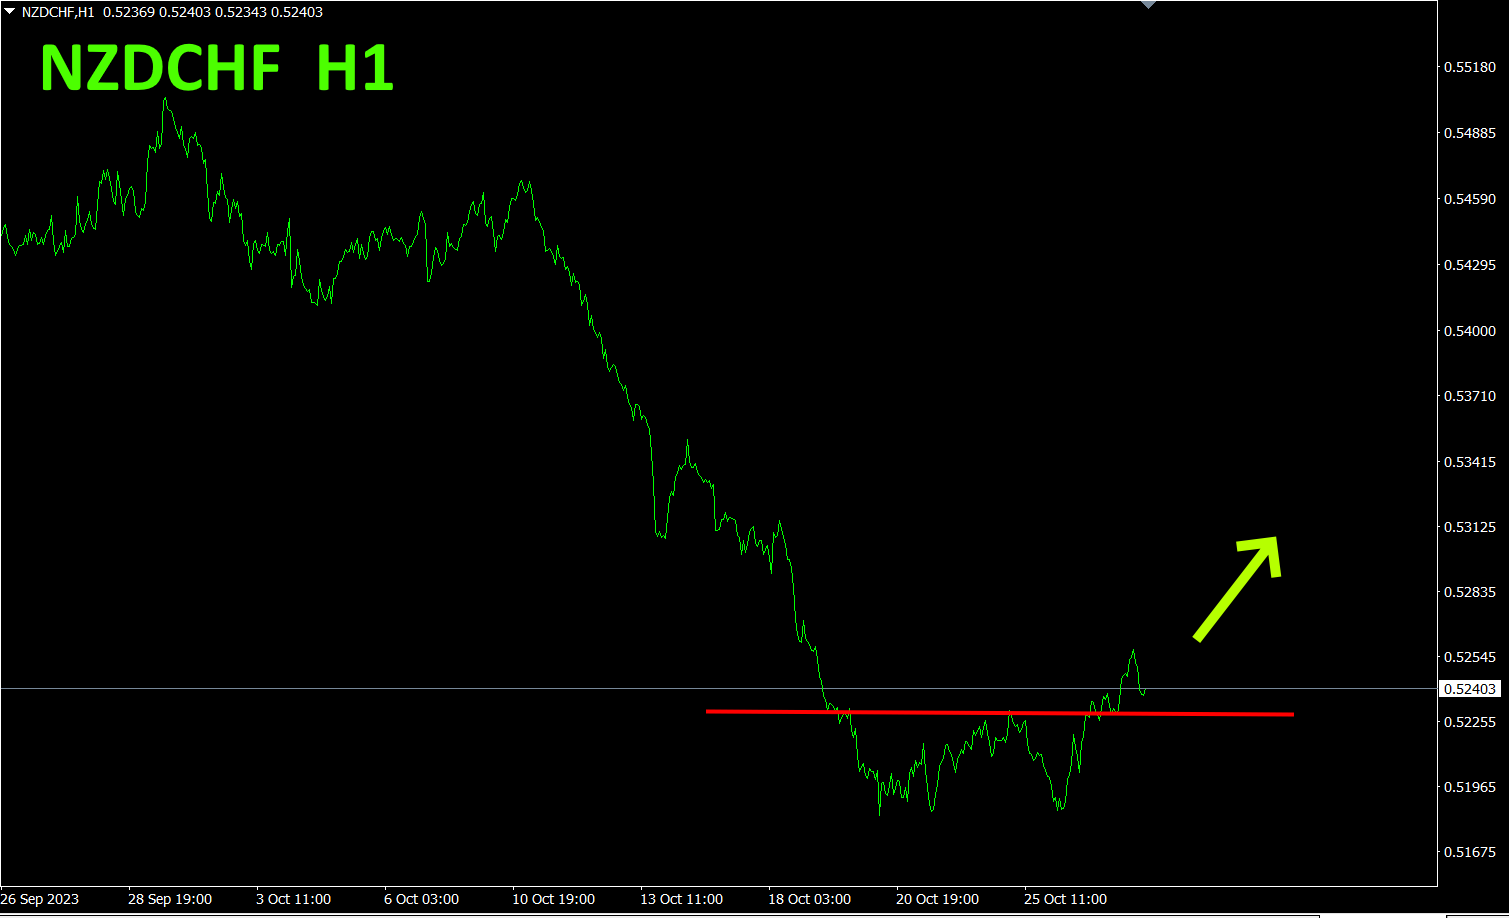
It looks like a chart from a textbook of FX trading.
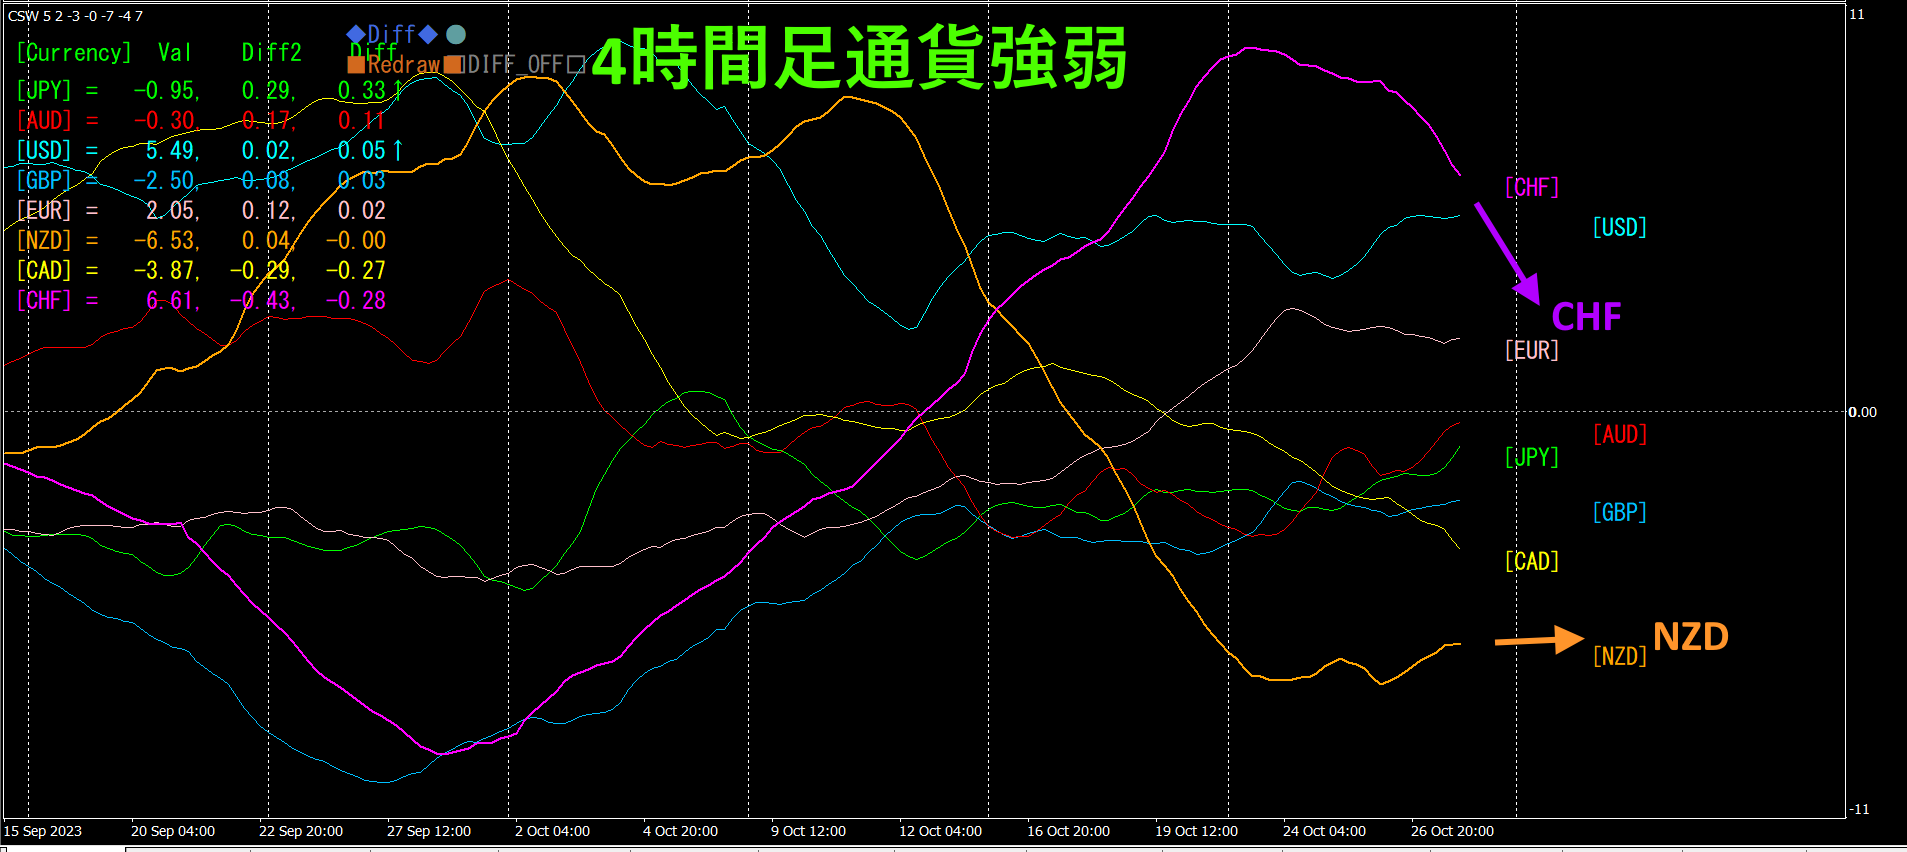
Red-purple isCHF, orange isNZDCHF andNZDCHF plunges,NZDCHF andNZD is expected to converge (NZDCHF will rise).
chart pattern and currency strength both indicate a “buy” signal for NZDCHF.
Semi-automaticEA with “Trend Line EX
※” enables drawing a slanted downward line; if price breaks above it, it buys automatically, and if it breaks above a rising line, it automatically closes. This allows a hands-off trading style.“Trend Line EX”

https://www.gogojungle.co.jp/tools/indicators/42257
If you are interested in the “8C Currency Strength Visualization Indicator,” please refer to the following page.
MT4 version https://www.gogojungle.co.jp/tools/indicators/39150
MT5 version https://www.gogojungle.co.jp/tools/indicators/39159
【My products on sale】


