

[October 27, 2023] Backtesting using the Heaven and Earth Indicator (USD/JPY and USD/JPY options)
In the previous chart analysis article we examined the subsequent developments of the Pound/Yen long-entry candidates and the Pound/Oi positions.

・This article mainly covers chart analysis and backtesting using the “Heaven and Earth Indicators.”
・We base the content on the use of the most accurate tool,“15-minute chart + 4-hour chart simultaneous monitoring method.”.
・This tool is a groundbreaking trading tool that can be used even if you have no understanding of traditional FX theories (Elliott Wave, Dow Theory, Gann’s law, cycle theory, price action, Fibonacci, support/resistance, channels, etc.).)

Heaven and Earth Indicators are a trading method I, Abusan, developed using an original indicator released in February 2022.
Thanks to everyone’s support,「GogoJungle Award 2022 win
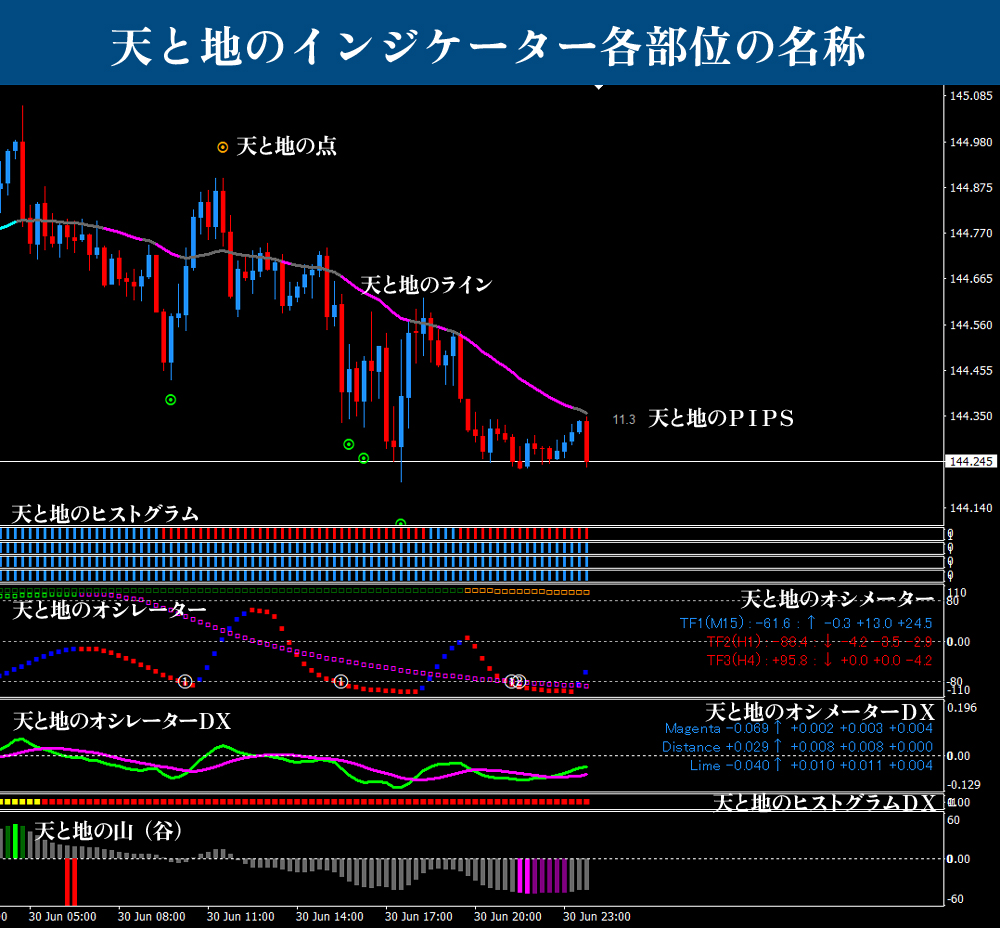
■ Heaven and Earth Indicators
https://www.gogojungle.co.jp/tools/indicators/35780
■ Heaven and Earth Mountain
https://www.gogojungle.co.jp/tools/indicators/37744
■ Heaven and Earth EA ~ Semi-Discretionary Auto Trading System ~
https://www.gogojungle.co.jp/tools/indicators/43213
■ Heaven and Earth Dashboard
https://www.gogojungle.co.jp/tools/indicators/46257
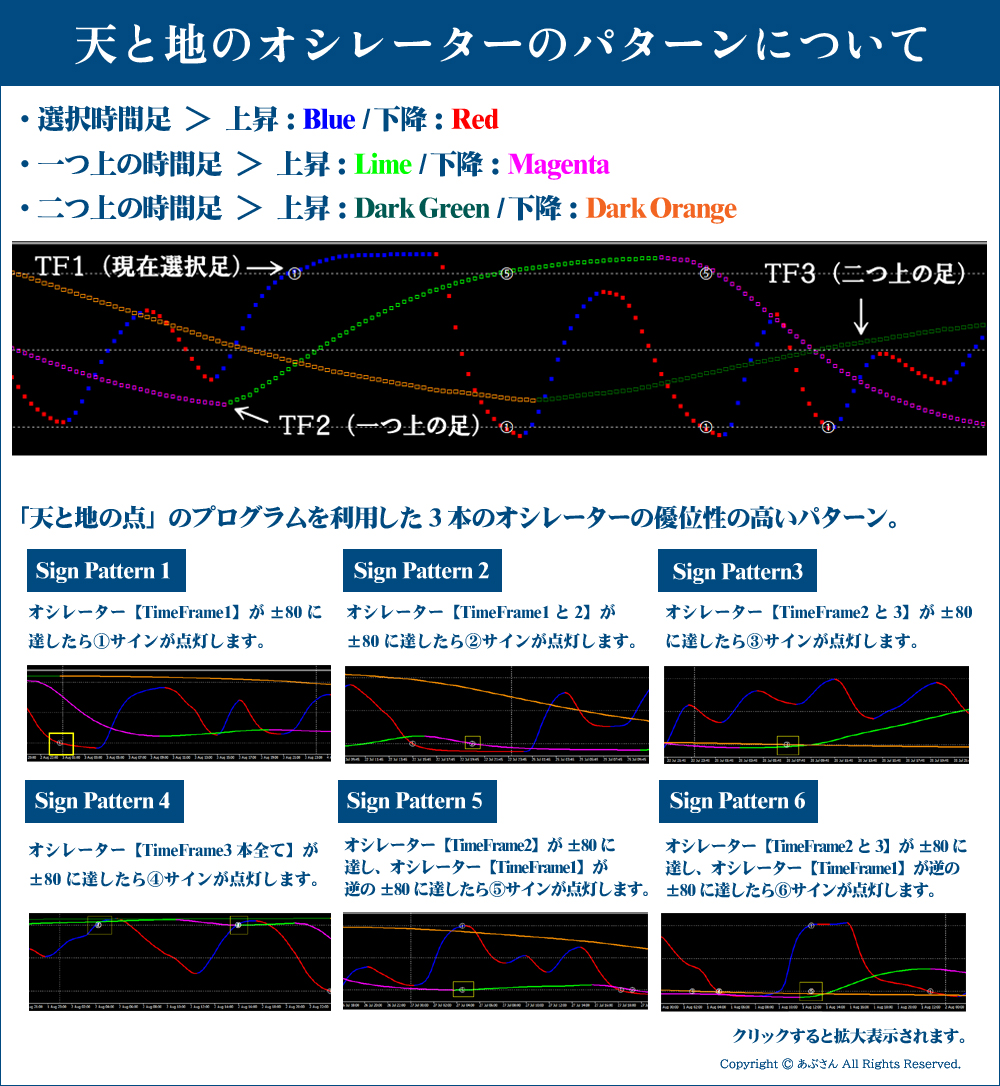
※ For specialized terms used in this blog, please refer to the following: “Names of parts of Heaven and Earth Indicators” and “Patterns of Heaven and Earth Oscillators.” If you have any other questions, please refer to the Heaven and Earth Indicators sales page for a general understanding. If you are already a user, simply reading the manual will suffice.
Now, I would like to move on to the verification.
Thank you in advance!
※ All images enlarge when clicked.

Pound/Yen15-minute + 4-hour Past Backtest (October 20, 2023 to23
※ Please note the yellow vertical line. A yellow vertical line is in the same place on the 15-minute chart as well. (Using the LINK LINE)
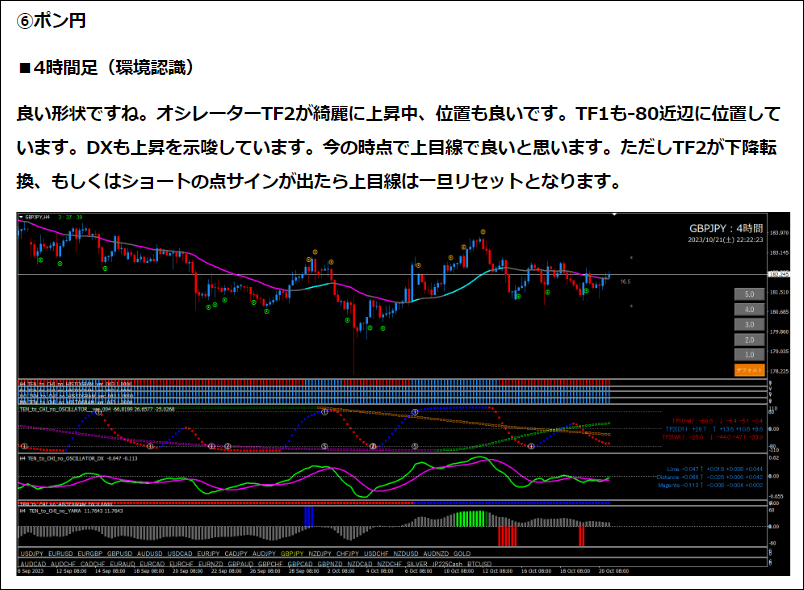
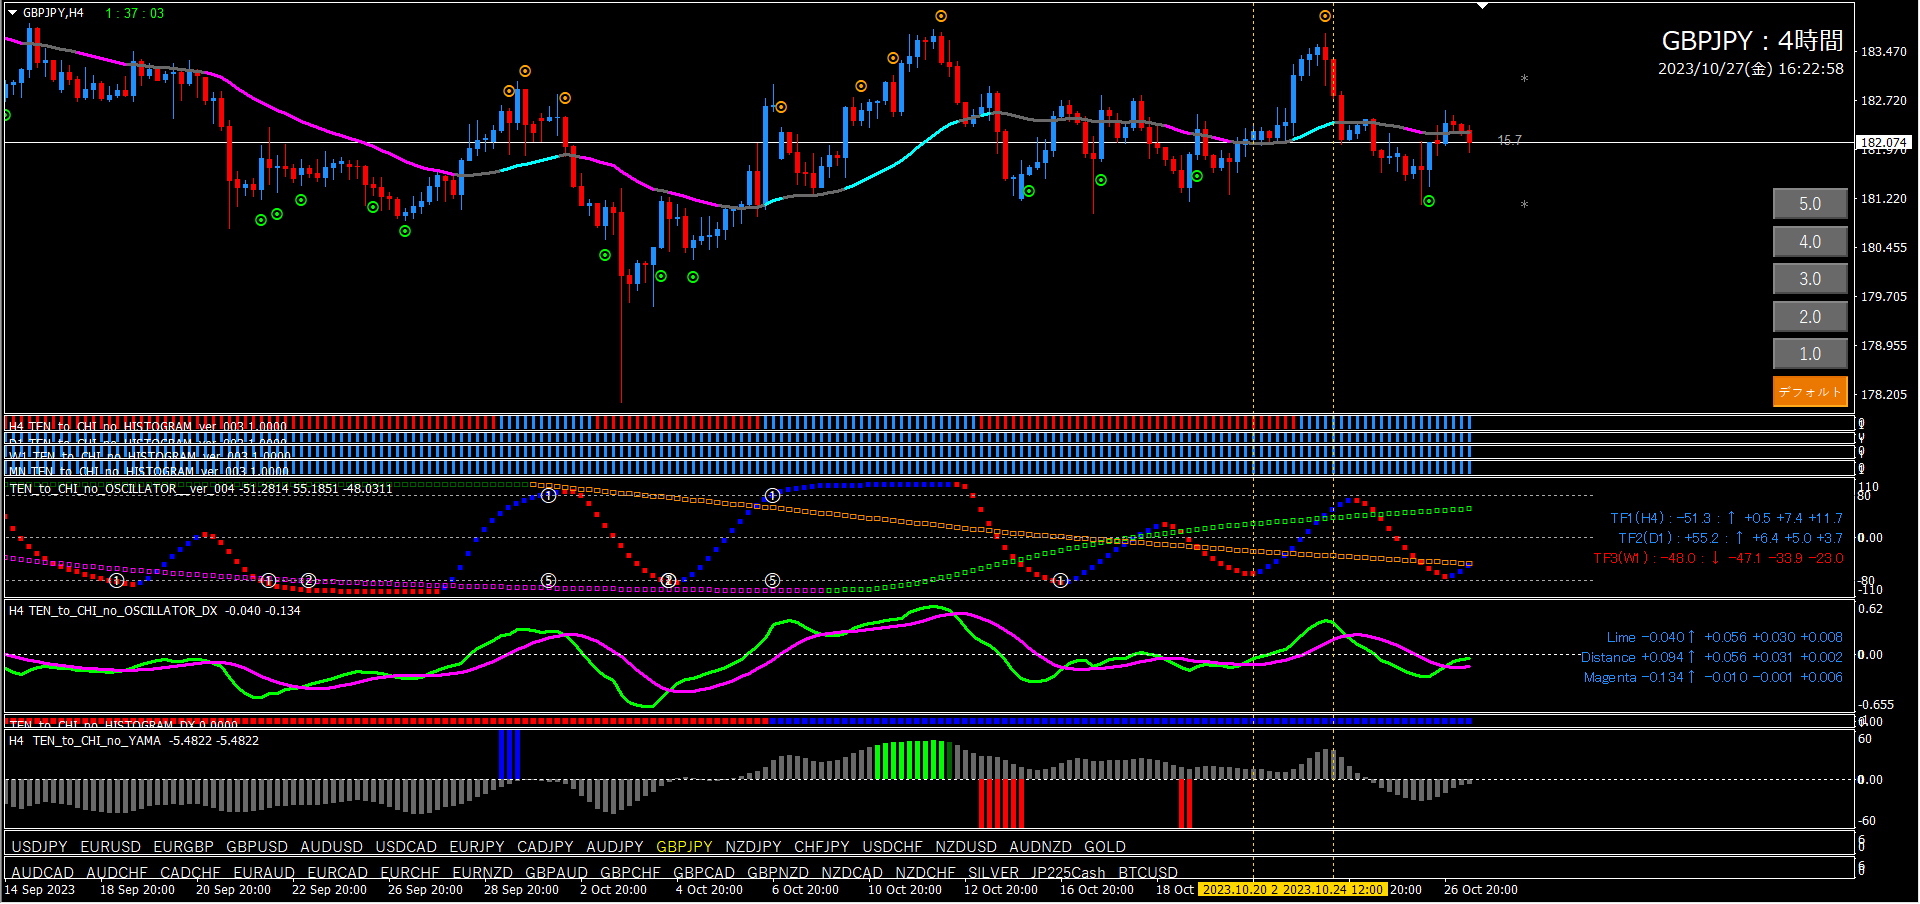
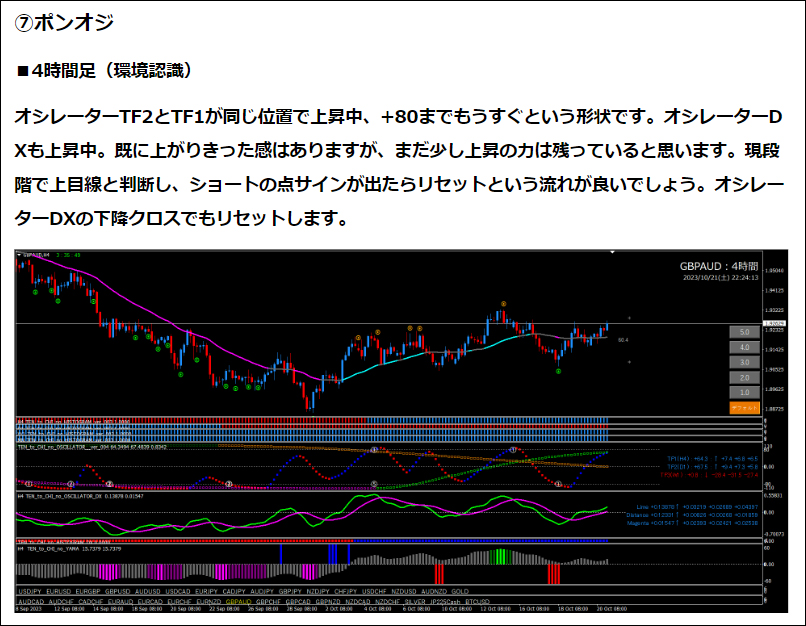
■ 4-hour chart (Environmental recognition)
The top of the image isthe previous article content. The bottom is the current chart.
The left yellow vertical line on the current chart marks the place judged to be a bullish stance in the previous article.
The right yellow vertical line marks the place where the bullish stance ended.
At the time of writing the article, we judged it as bullish. As the analysis suggested, a short-entry signal appeared, so the bullish stance ended. The interval between these vertical lines is the “Bullish Area.”

The left yellow vertical line marks the place judged bullish in the previous article.
The right yellow vertical line marks where the bullish stance ended.
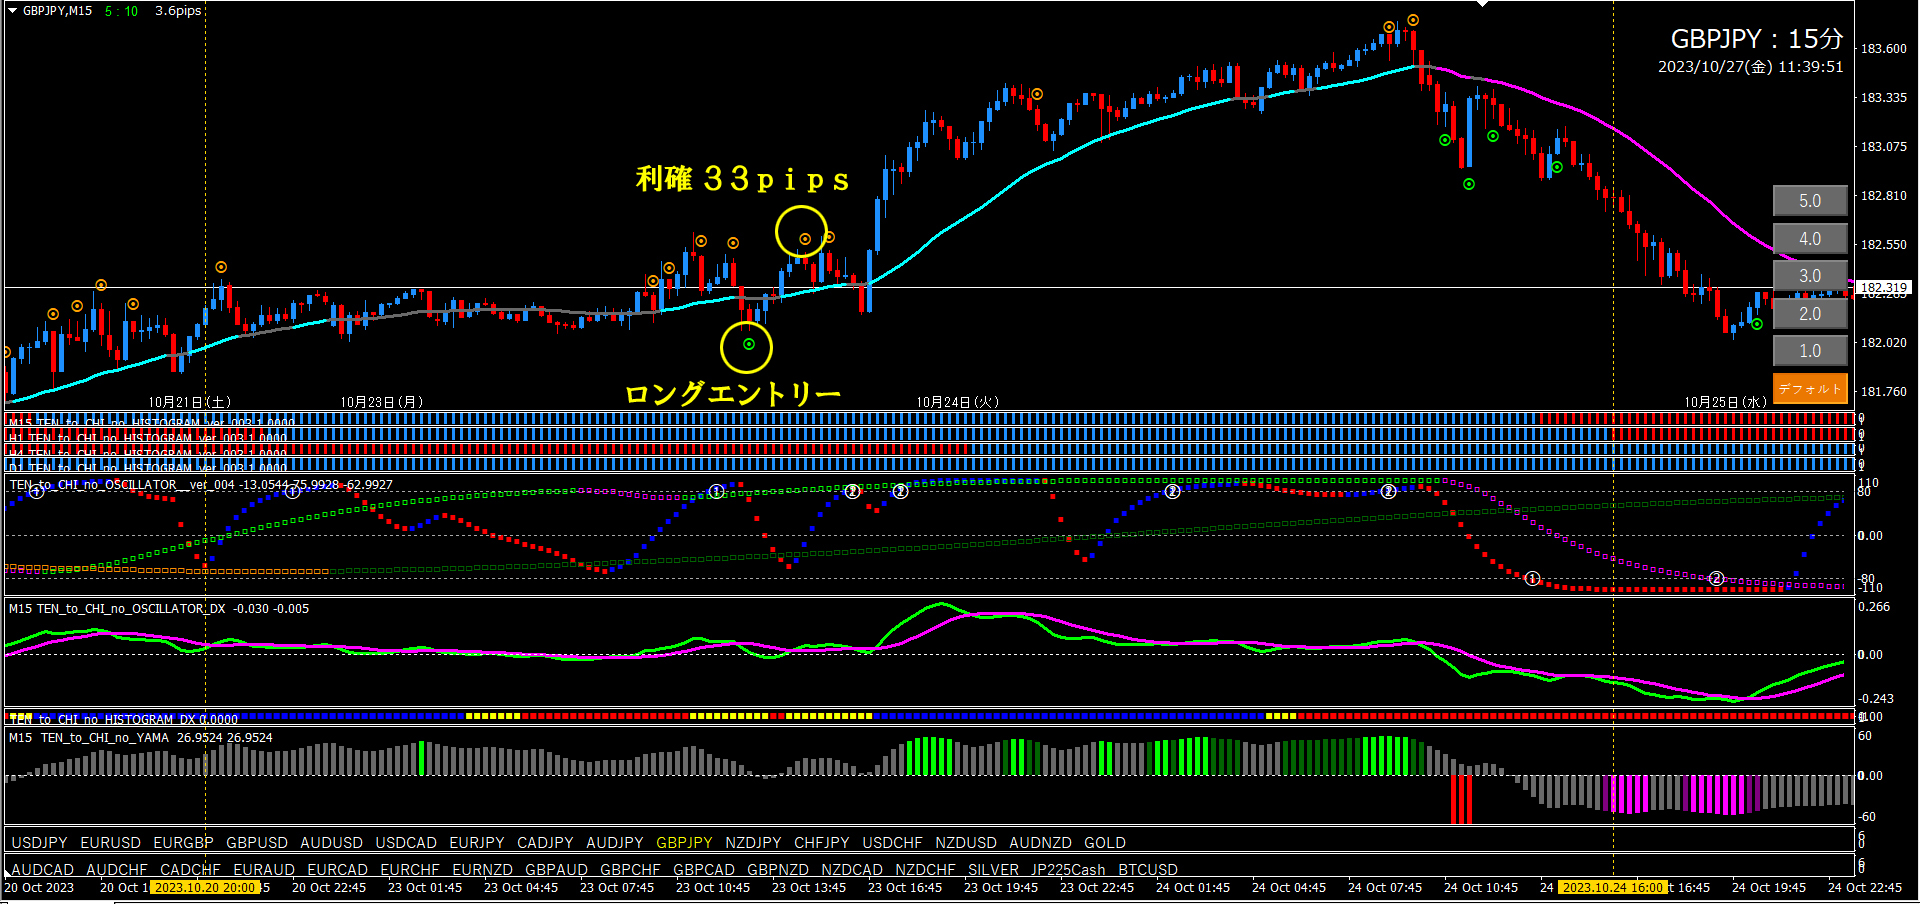
In this bullish area, we look for long-entry points on the 15-minute chart.
Oscillator TF2 rose steadily, producing a long-entry signal. It was an excellent long-entry point. The only regret is that a quick take-profit short-entry signal appeared soon after. If we had extended to the next short-entry signal, we could have earned 100 pips. But that is hindsight. Still, we earned 33 pips, so no problem.
By setting the point level to 1.0, the entry opportunities become about four times as many. If you are in a setup where you can enter frequently, this method might be good. Of course, it can trigger long entries on TF1 as well, but ideally, it would be best to enter as soon as Oscillator Signal ① appears.

■If using Heaven and Earth EA (to be used on the 15-minute chart)
Since TF2 is rising at the point of judging bullish, set EA Pattern ①. Partway TF2 turned downward, so EA was halted temporarily. Since the bullish stance is decided, do not give up and re-set EA Pattern ① when the price turns up again.

Pound Oji 15-minute + 4-hour Past Backtest (October 20, 2023 to23
※ Yellow vertical lines again. The 15-minute chart has a yellow vertical line in the same location. (Using LINK LINE)
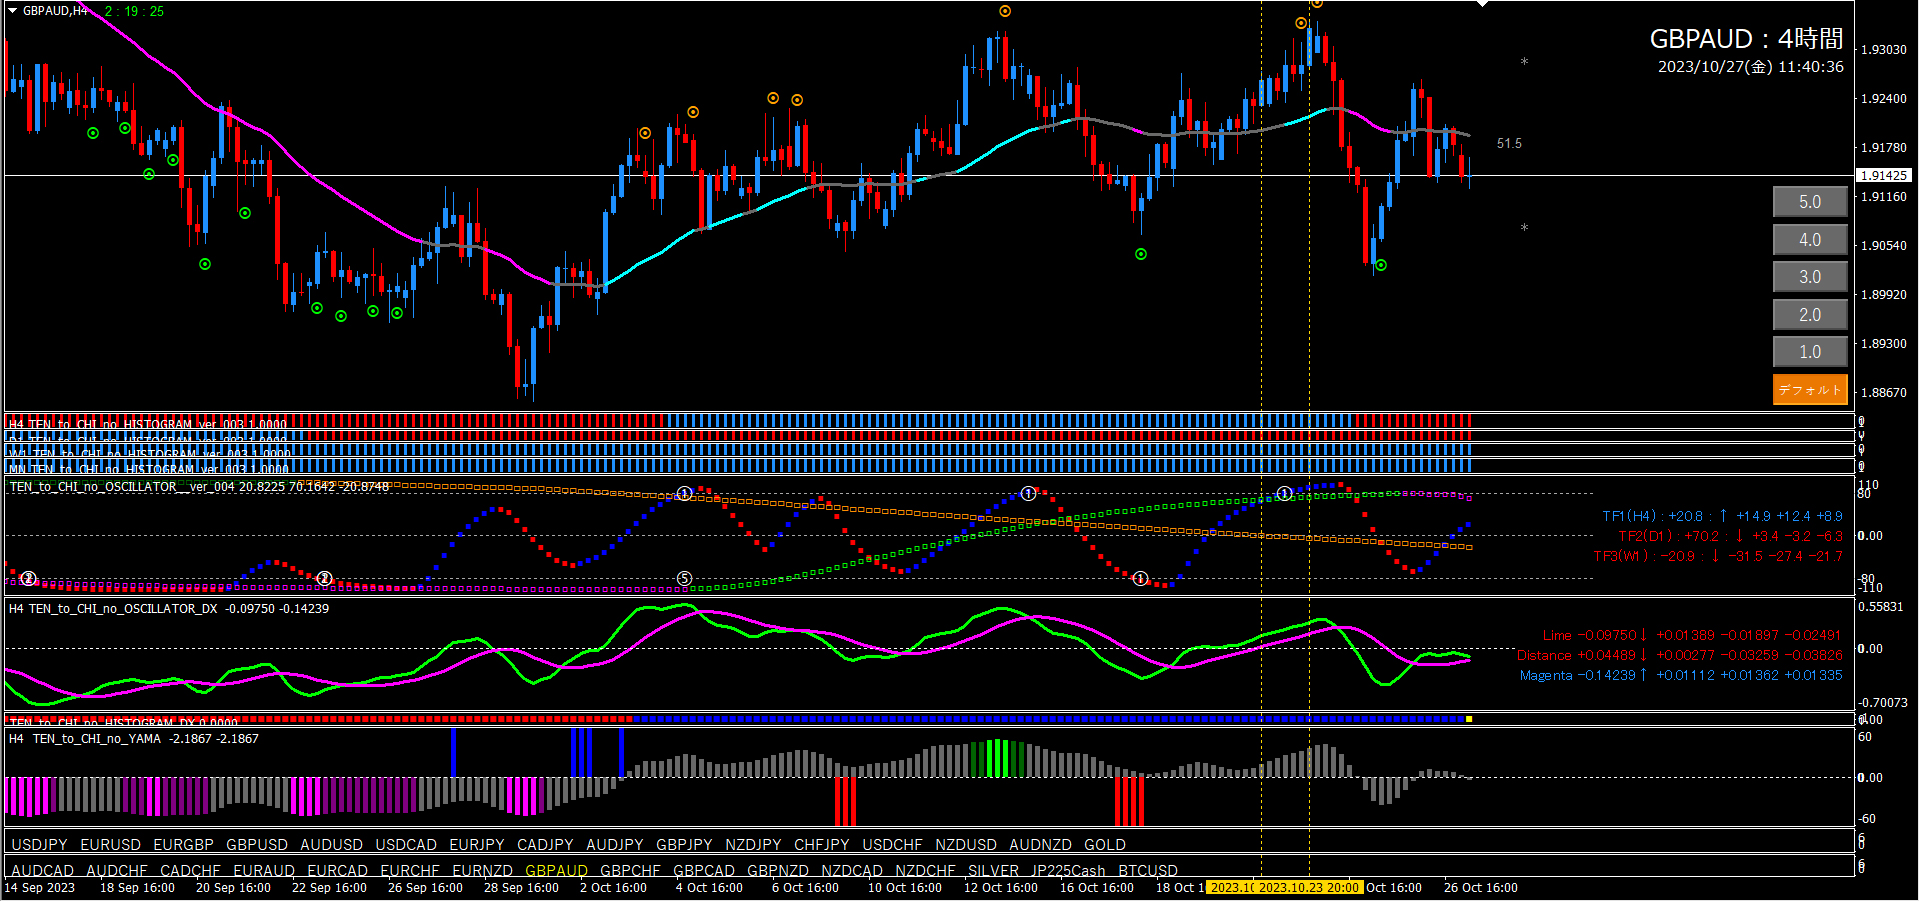
■ 4-hour chart (Environmental recognition)
The top of the image isthe previous article content. The bottom is the current chart.
The left yellow vertical line on the current chart marks the place judged bullish in the previous article.
The right yellow vertical line marks the place where the bullish stance ended.
At the time of writing the article, we judged it bullish. We predicted there was still some upward force remaining, so we judged it as short-term bullish. Later, as the analysis suggested, a short-entry signal appeared, ending the bullish stance. The interval between these vertical lines is the bullish area.

The left yellow vertical line marks the place judged bullish in the previous article.
The right yellow vertical line marks where the bullish stance ended.
In this bullish area, we look for long-entry points on the 15-minute chart. Oscillator TF2 sticks at +100, while TF1 sits at -80. This is an excellent pullback-buying pattern. And a long-entry signal appeared. It was an excellent long-entry point, wasn’t it? As with Pound/Yen, if you set the point level to 1.0, entry opportunities multiply by 4–5 times.
■Heaven and Earth EA (to be used on the 15-minute chart)
Pound/Yen is exactly the same. When deciding bullish, TF2 is rising, so set EA Pattern ①. If TF2 temporarily drops, the EA is halted. The bullish stance is already decided, so don’t give up and re-set EA Pattern ① when it turns upward again.

That’s all.
If this was of any help to you all, I would be glad.
