

[October 22, 2023] Chart analysis using sky and ground indicators
This is the fourth week of October's review article. This time we analyze eight currency pairs: EURUSD, EURJPY, USDZAR, CADJPY, USDJPY, GBPJPY, GBPUSD, and NIKKEI 225 charts. At this point there aren’t many favorable patterns, but we selected currency pairs to watch for future movement. May this serve as a reference for trading from tomorrow.
Table of Contents

・This article mainly covers chart analysis and backtesting using “Heaven and Earth Indicator.”
・This tool is built on the premise of using the highly accurate“15-minute chart + 4-hour chart simultaneous monitoring method”.
・This tool is a groundbreaking trading tool that can be used without understanding the common FX theories (Elliott Wave, Dow Theory, Grainger's Law, cycle theory, price action, Fibonacci, support & resistance, channels, etc.).

Heaven and Earth Indicator is a trading method using my original indicator released in February 2022.
Thanks to everyone's support, we received「GogoJungle Award 2022」.
■ Heaven and Earth Indicator
https://www.gogojungle.co.jp/tools/indicators/35780">https://www.gogojungle.co.jp/tools/indicators/35780">https://www.gogojungle.co.jp/tools/indicators/35780https://www.gogojungle.co.jp/tools/indicators/35780
■ Heaven and Earth Mountain
https://www.gogojungle.co.jp/tools/indicators/37744
■ Heaven and Earth EA ~ Semi- discretionary Auto Trading System ~
https://www.gogojungle.co.jp/tools/indicators/43213
■ Heaven and Earth Dashboard
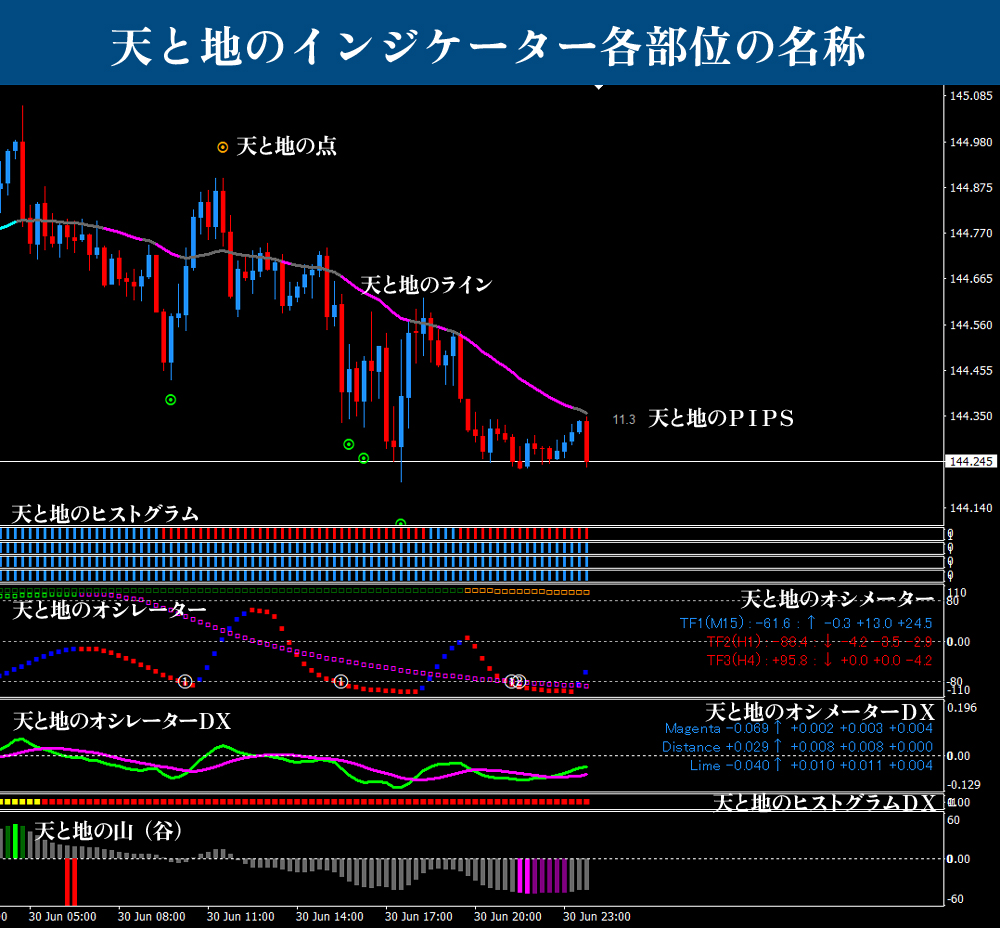
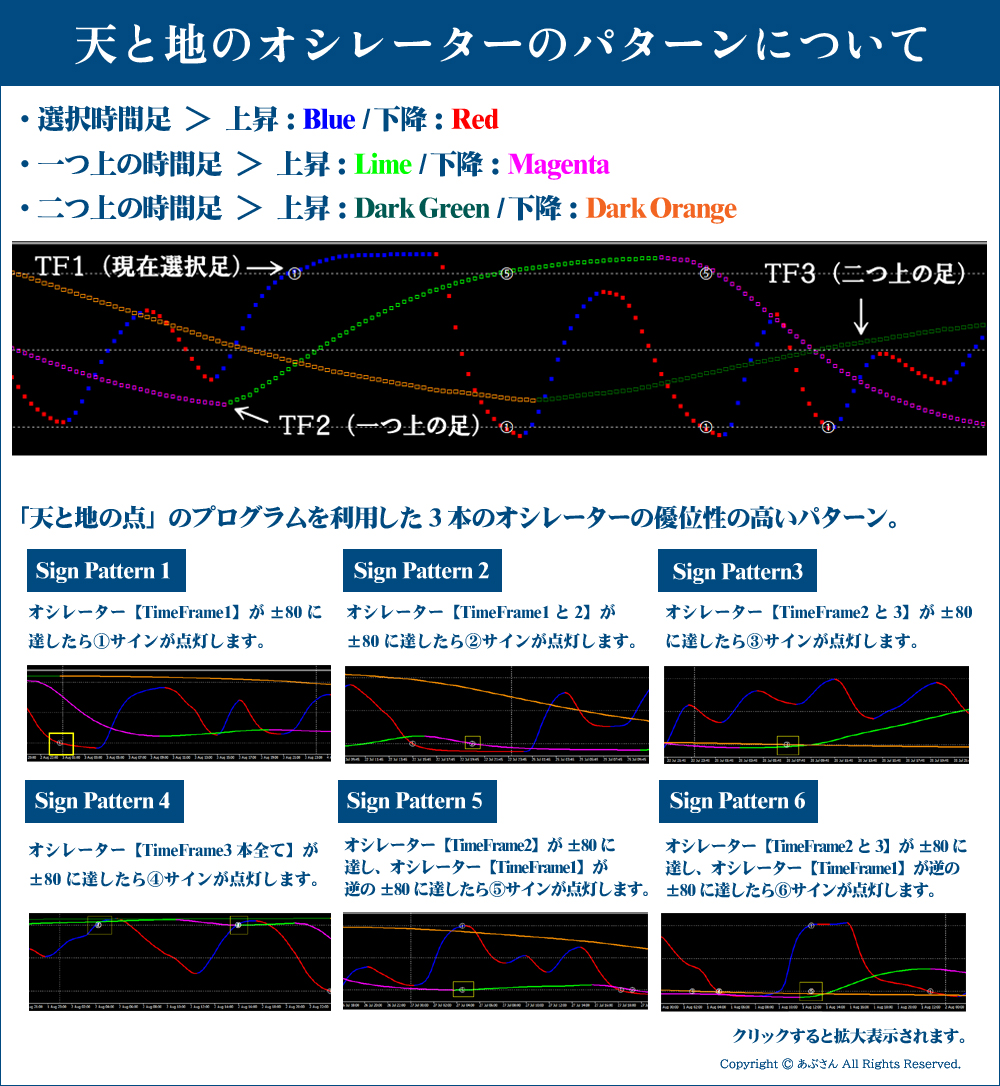
※ For the specialized terms used in this blog, please refer to the sections below: “Names of each part of Heaven and Earth Indicator” and “O s c i l l a t o r patterns.” If you have other questions, please refer to the Heaven and Earth Indicator sales page. For existing users, reading the user manual should be enough.
Now, let's move on to the analysis.
Thank you in advance!
※ All images enlarge when clicked.

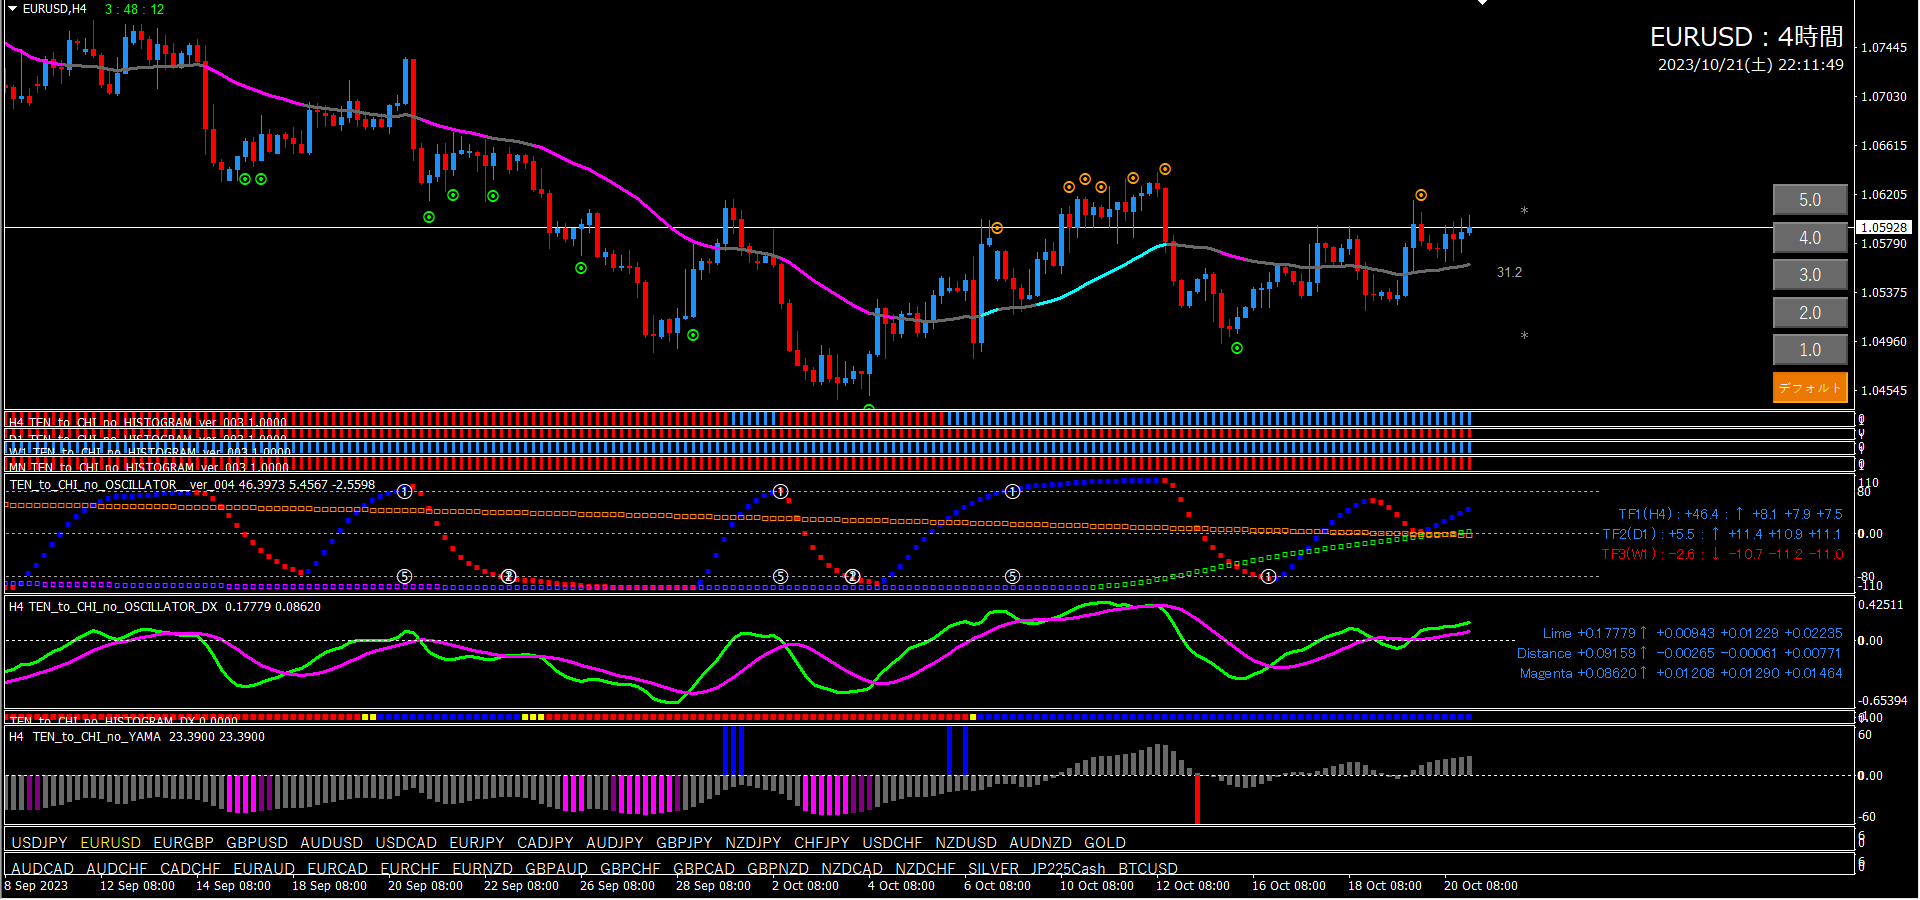
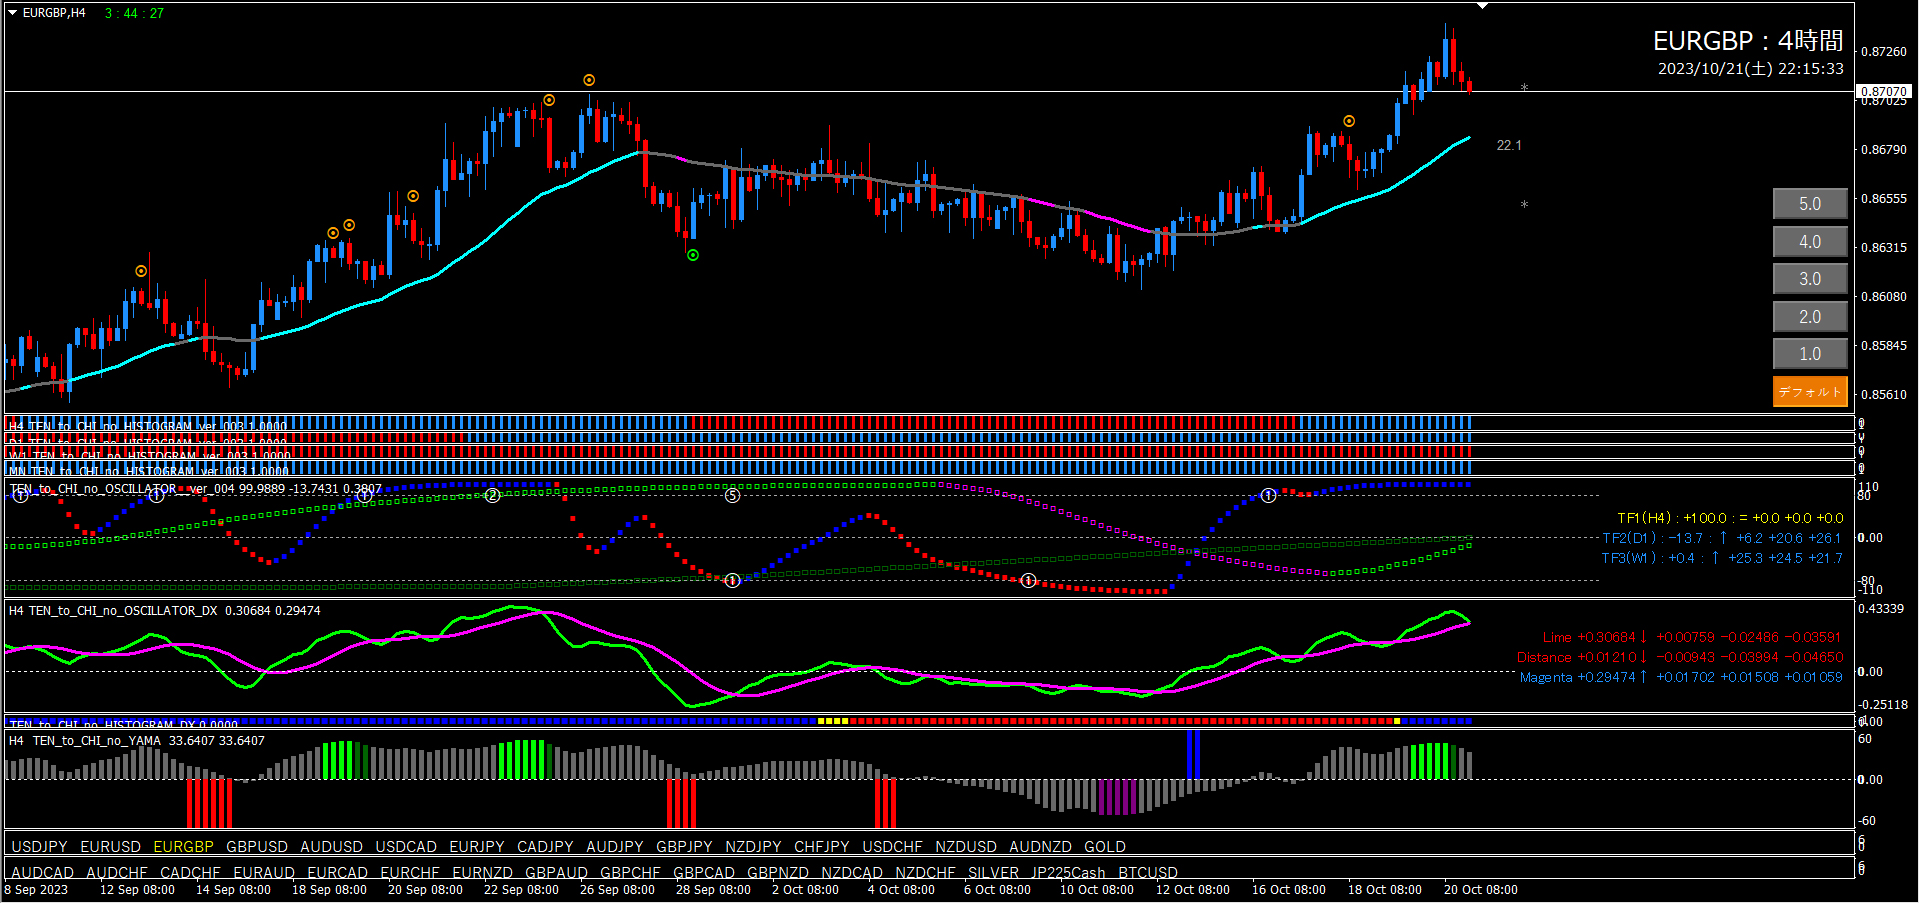
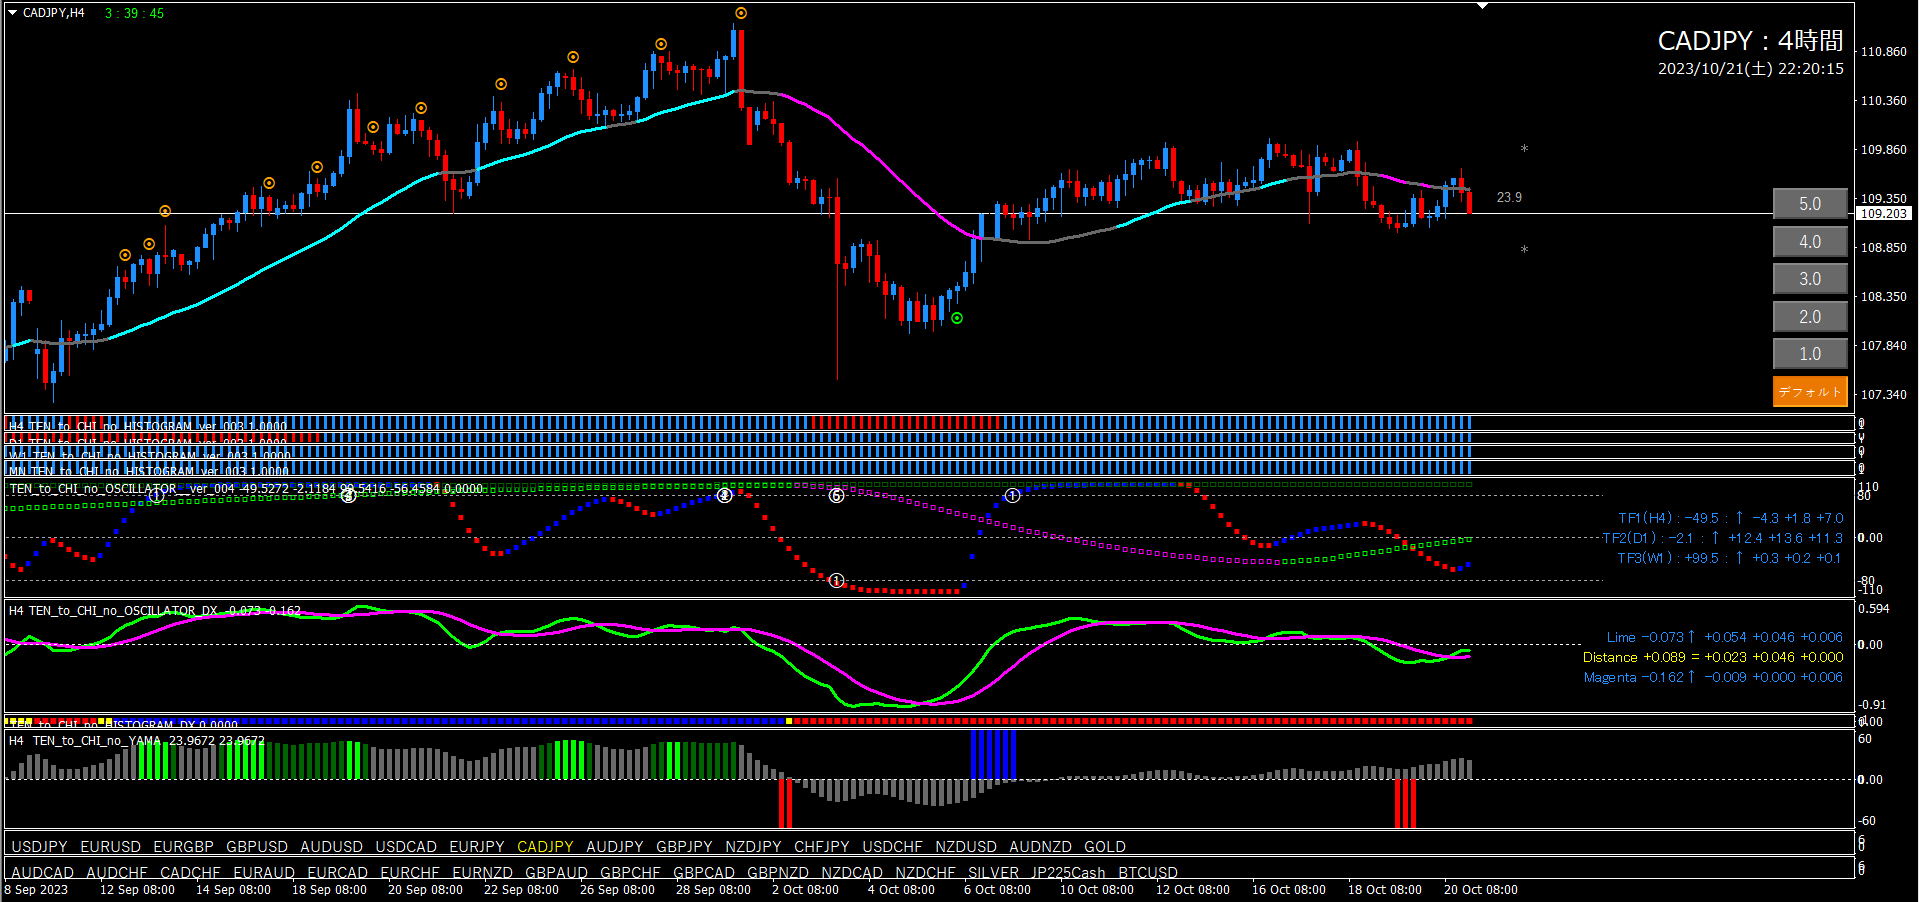
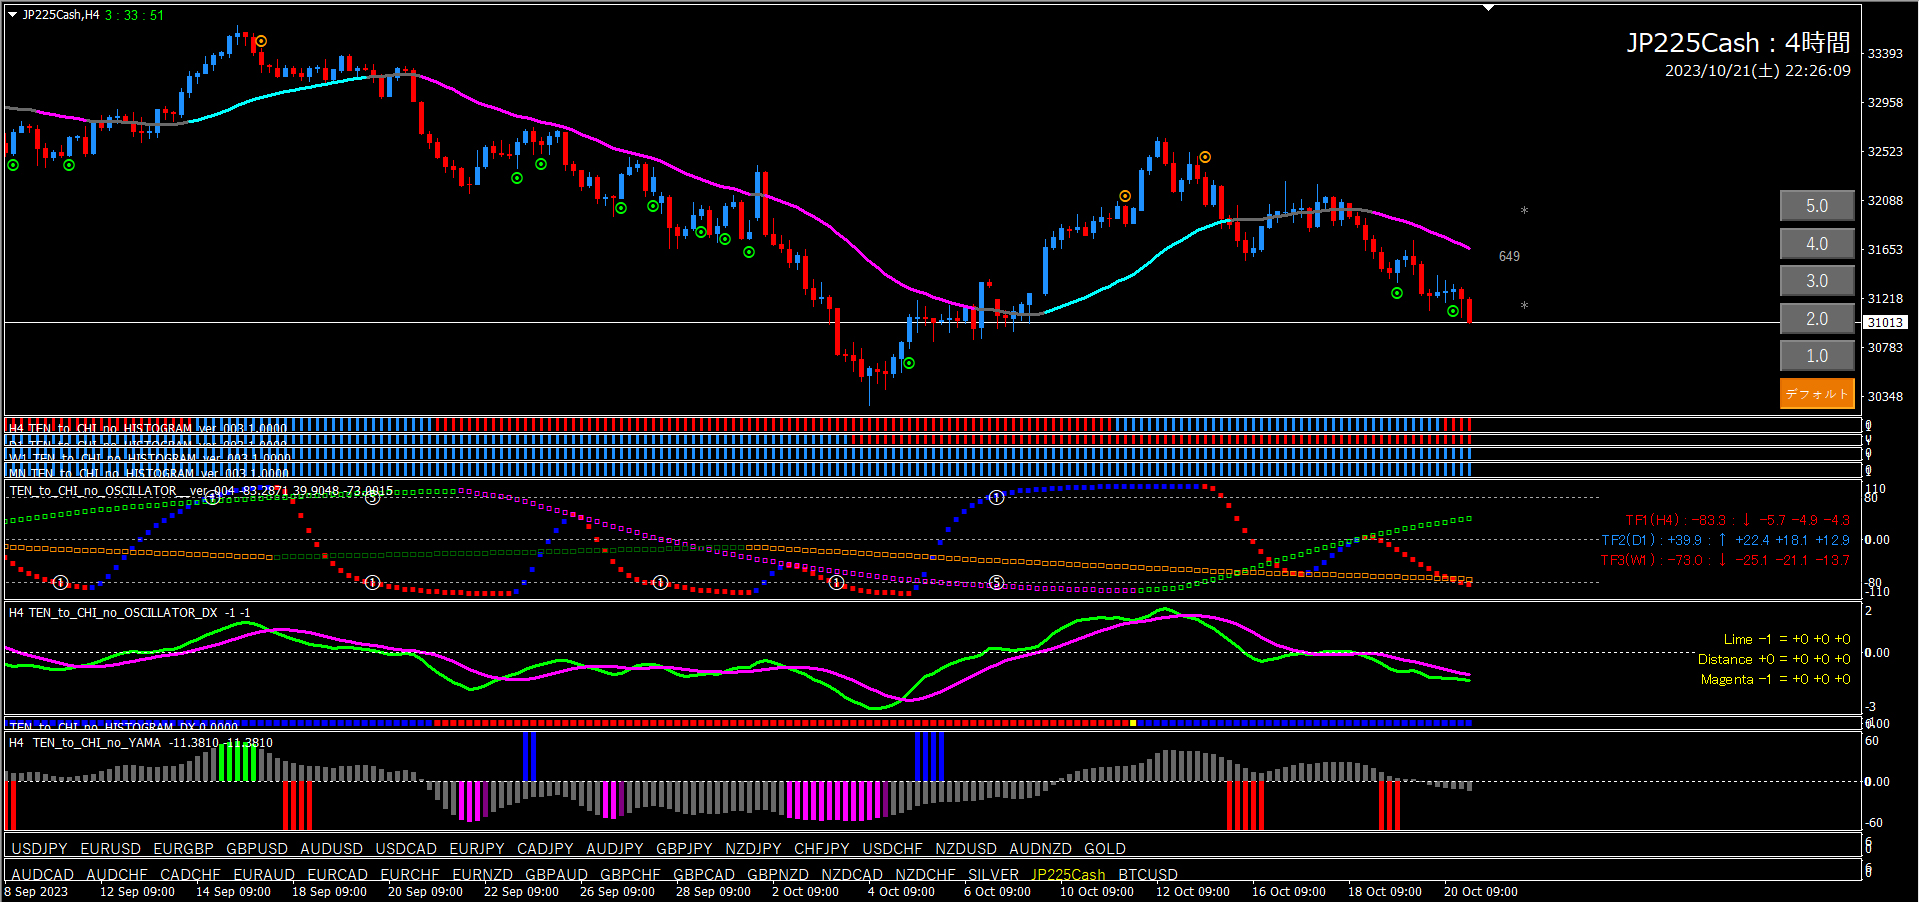
■ 4-hour chart (environment recognition)
First, look at Oscillator TF2. It is clearly rising. TF1 is rising as well and is approaching +80, but there is still room to rise. Oscillator DX is all blue. Until a short signal dot appears, maintain a bullish outlook. When a short dot signal and a downward turn in Oscillator DX are confirmed, the bullish outlook is reset.
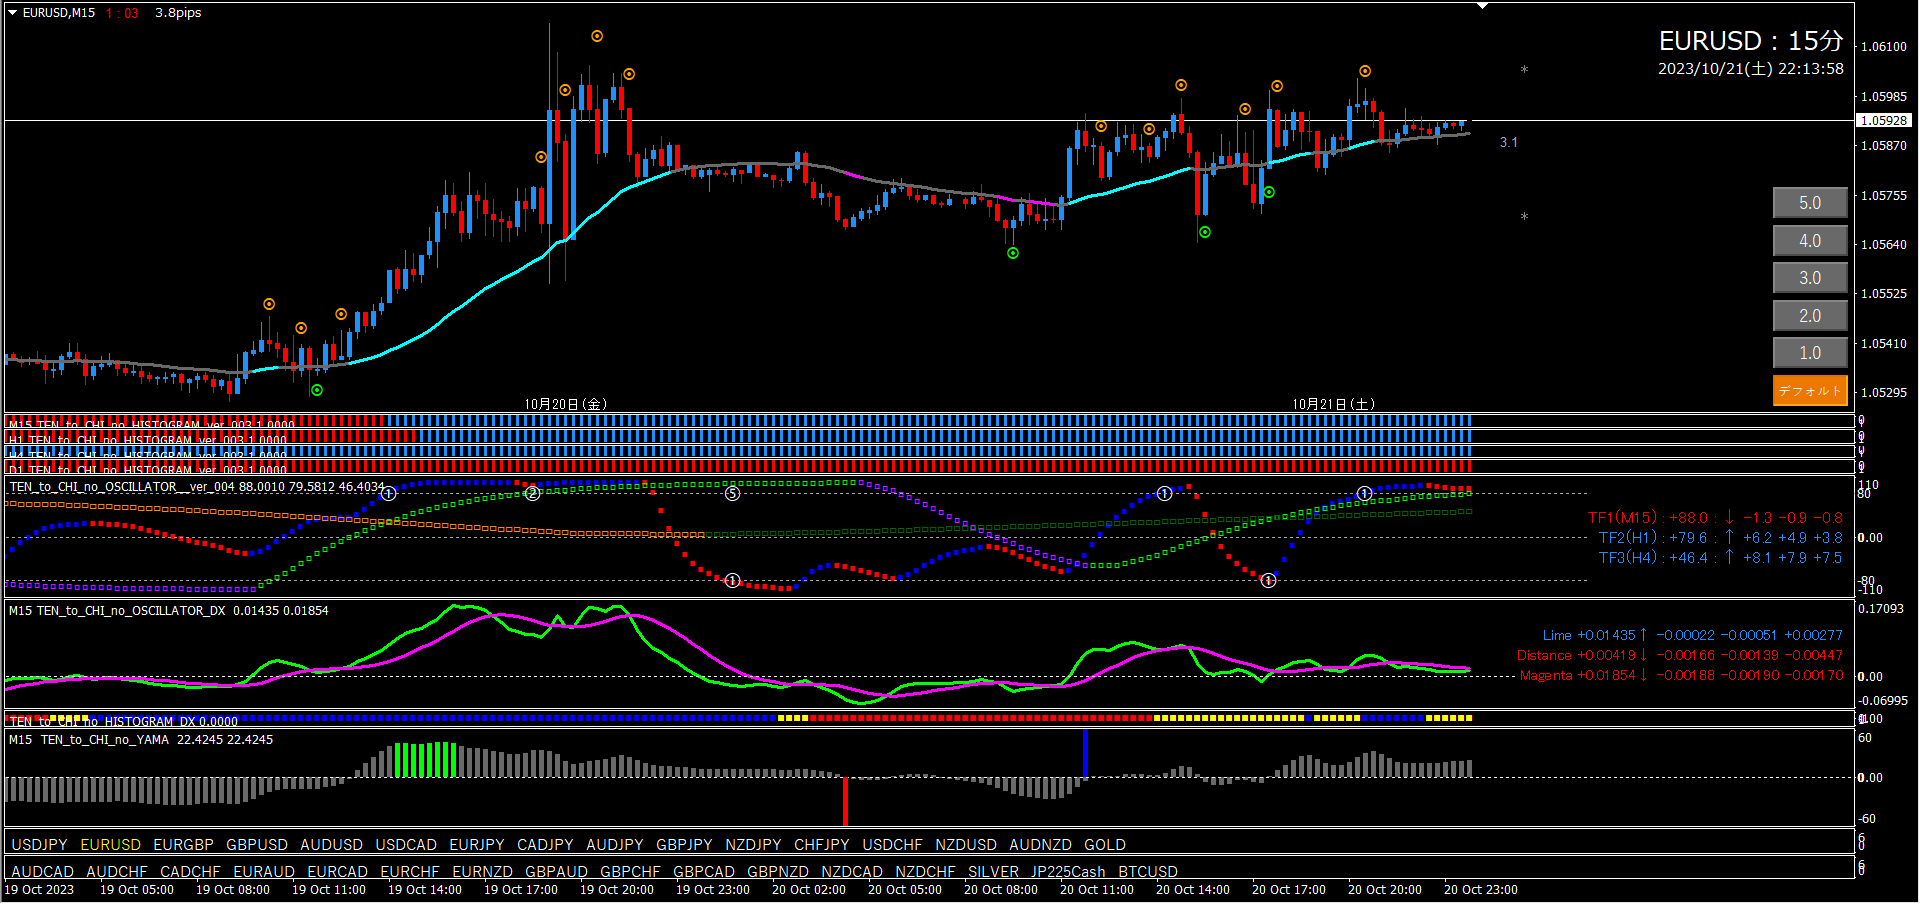
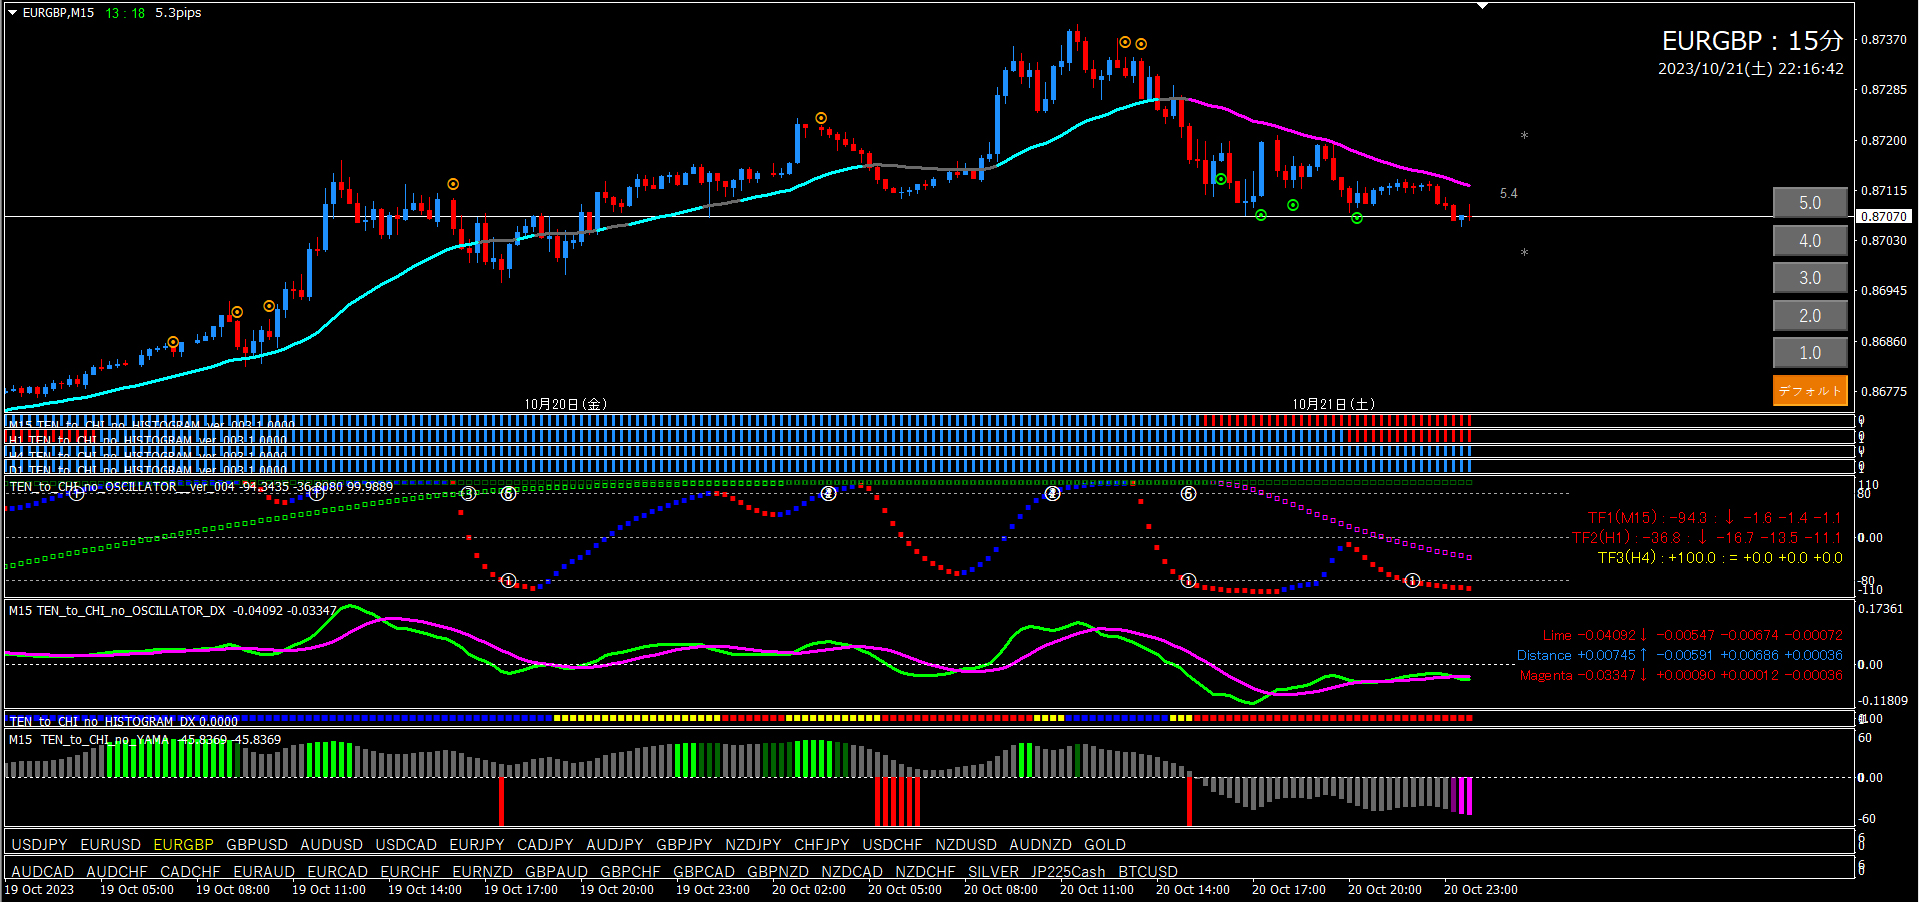
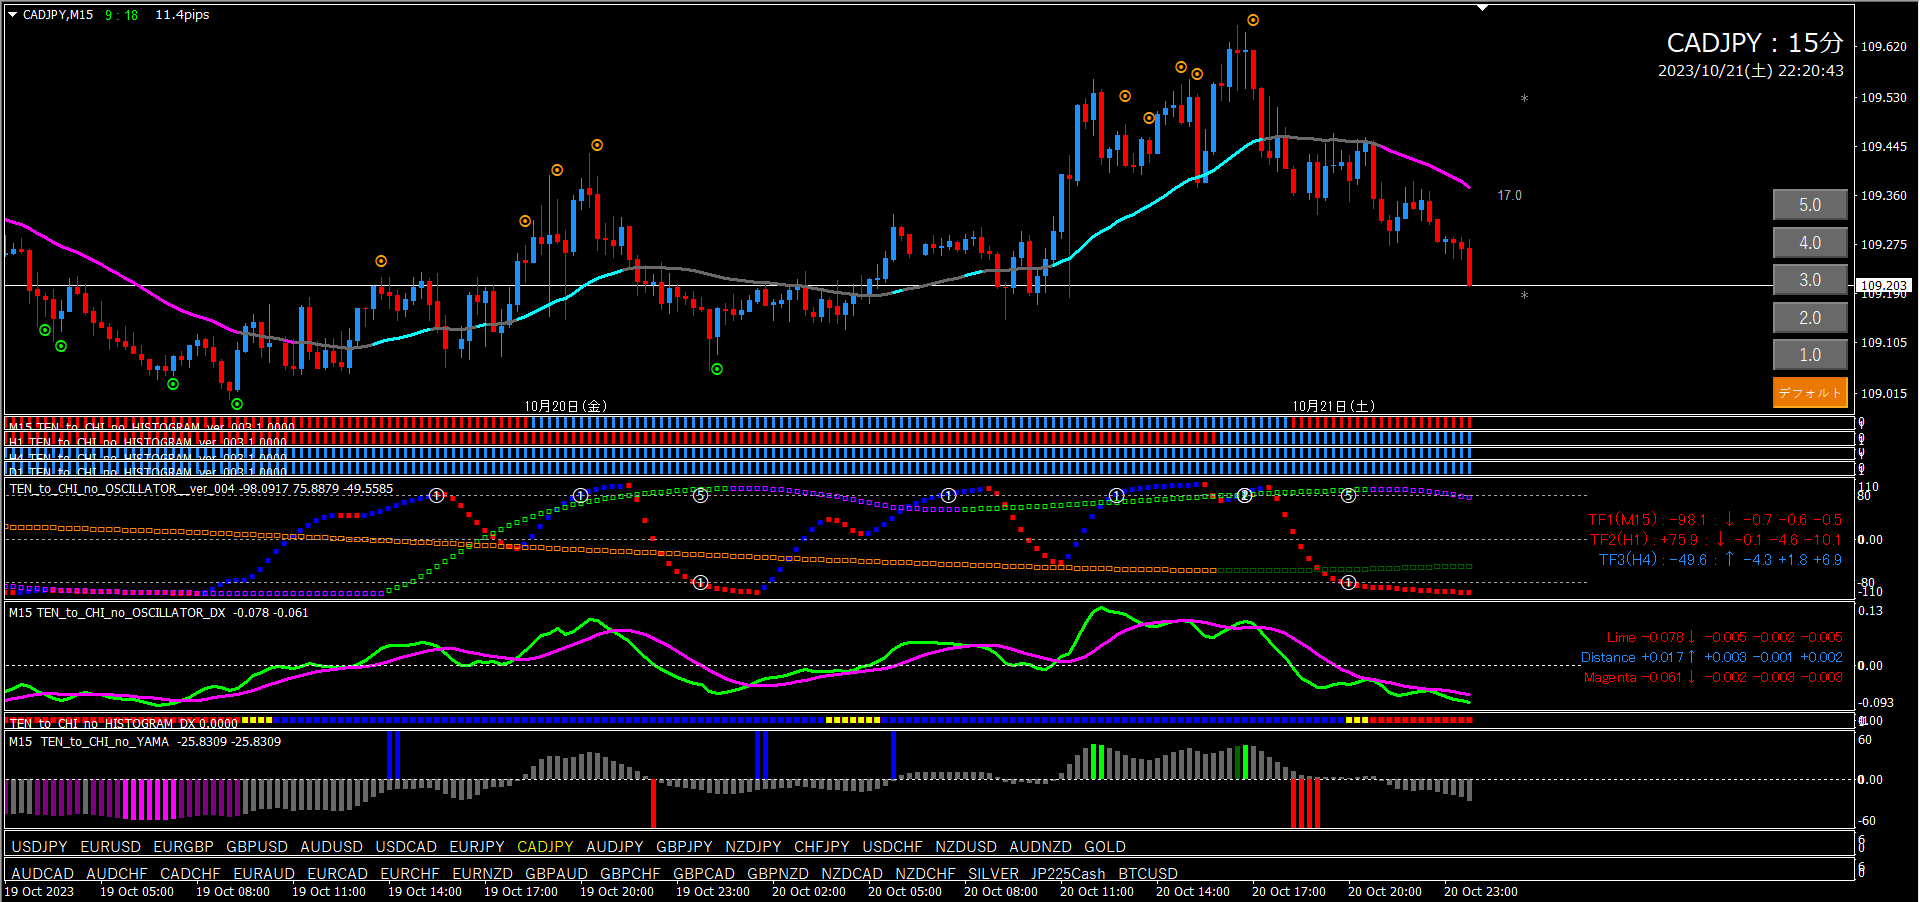
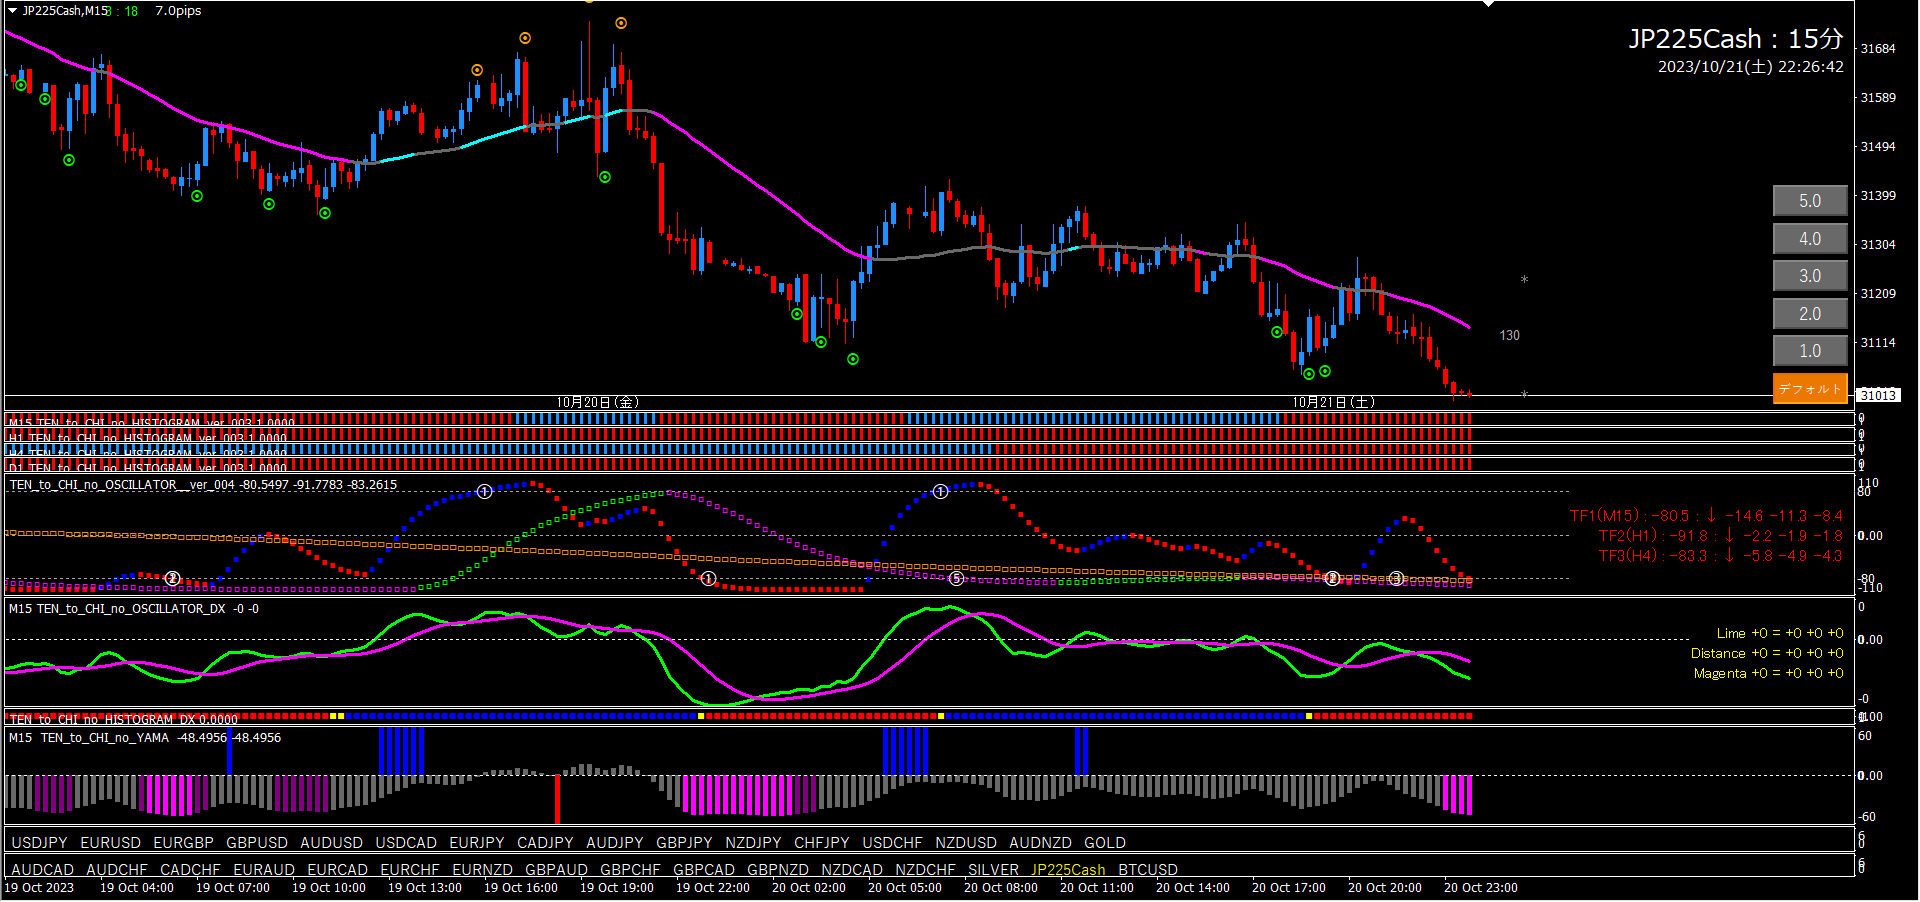
■ 15-minute chart (entry trigger)
Since we are bullish on the 4-hour chart, we will target long entries only on the 15-minute chart.
Oscillator TF2 is already rising, so the future scenarios are: long dot signal, TF1 turning up below the zero line, and use these as triggers.If TF1 descends cleanly and Oscillator Signal ⑤ lights up, that would be ideal.
■If using Heaven and Earth EA (on 15-minute chart)
Since we are already bullish on the 4-hour chart, it may be fine to set EA Pattern ① or ② at this stage.
However, judging by TF1 position, it may take a bit longer before the auto-entry conditions are met. If TF2 turns down before then, EA will stop, so stay glued and set it. If reset occurs, accept it and consider the next step.
■Abram's Signal (used on 15-minute chart)
If you have Abram’s Signal, you can enter long on Signal 1 after waiting for Signal 2. In Abram’s Signal, if the 4-hour view is clearly defined, you can ignore the direction of Oscillator TF2 and other evidence. It is a very strong trend-following signal, so there is no issue. The usage method is the same for other currency pairs, so I will omit it from further discussion.

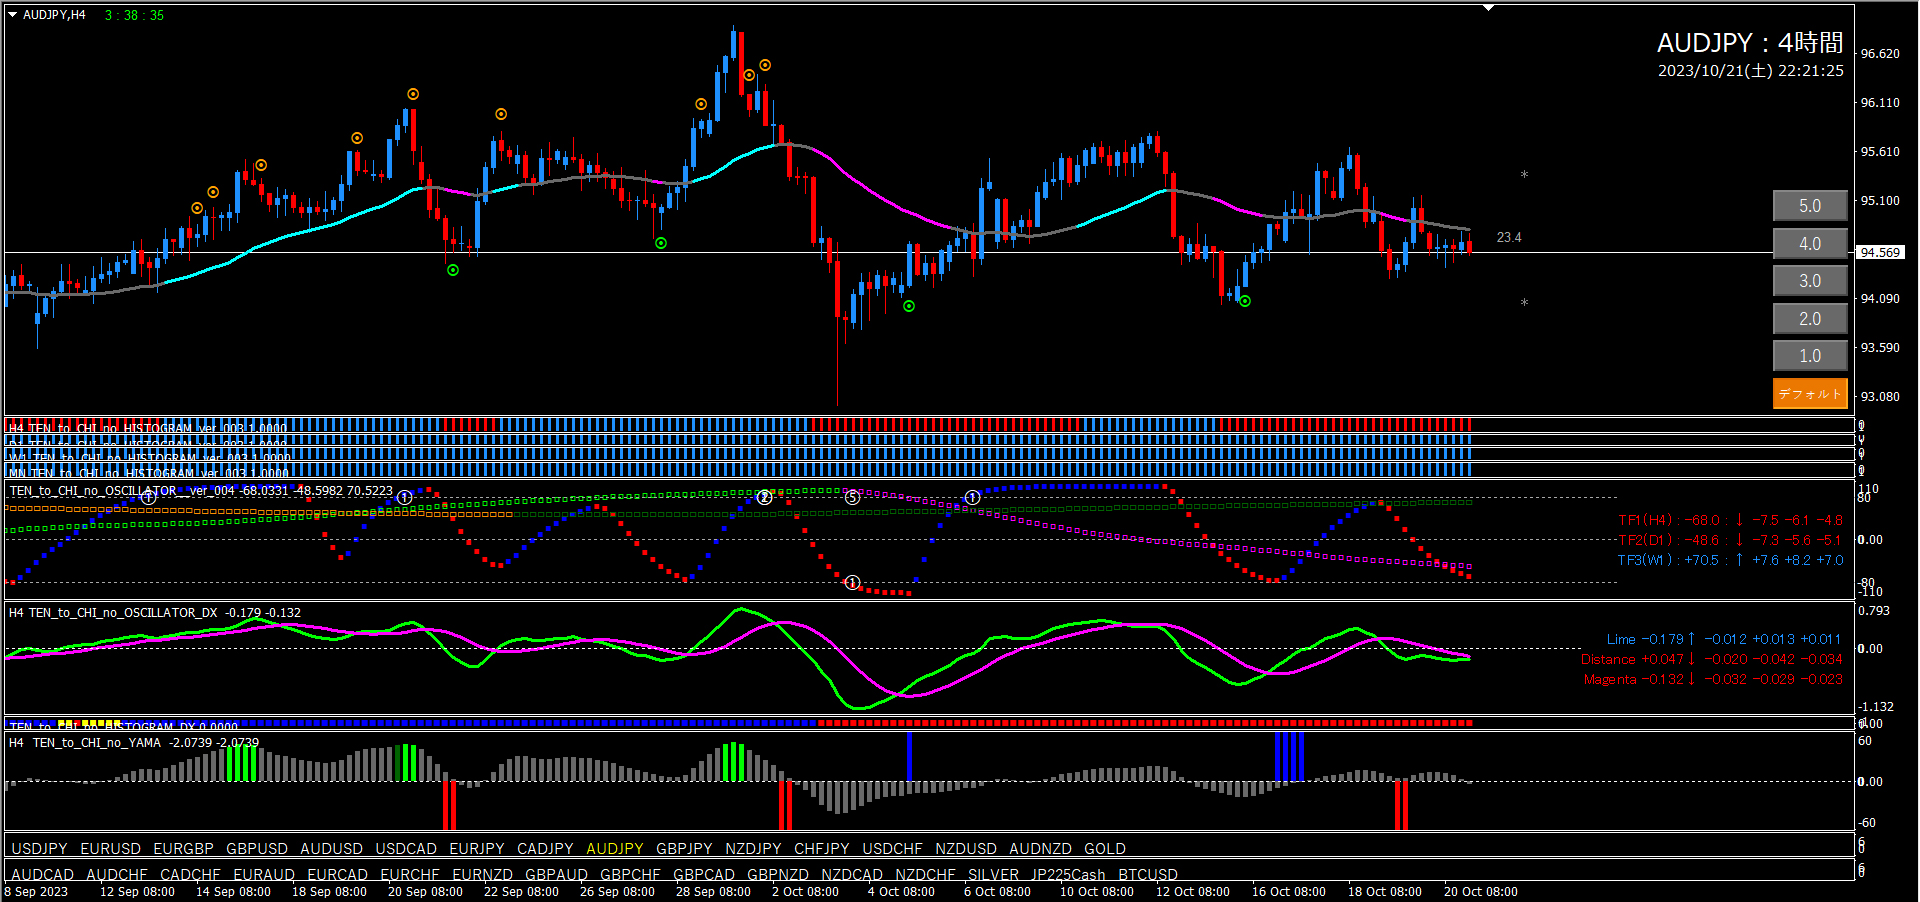
■ 4-hour chart (environment recognition)
Oscillator TF2 is rising; outlook is bullish, but at present there are no other bullish elements. TF1 is stuck near +100. Let's watch future movement.
In the future, if candles lie below the line and TF1 approaches around -80, a bullish outlook will be near. When a long dot signal appears, judge bullish.
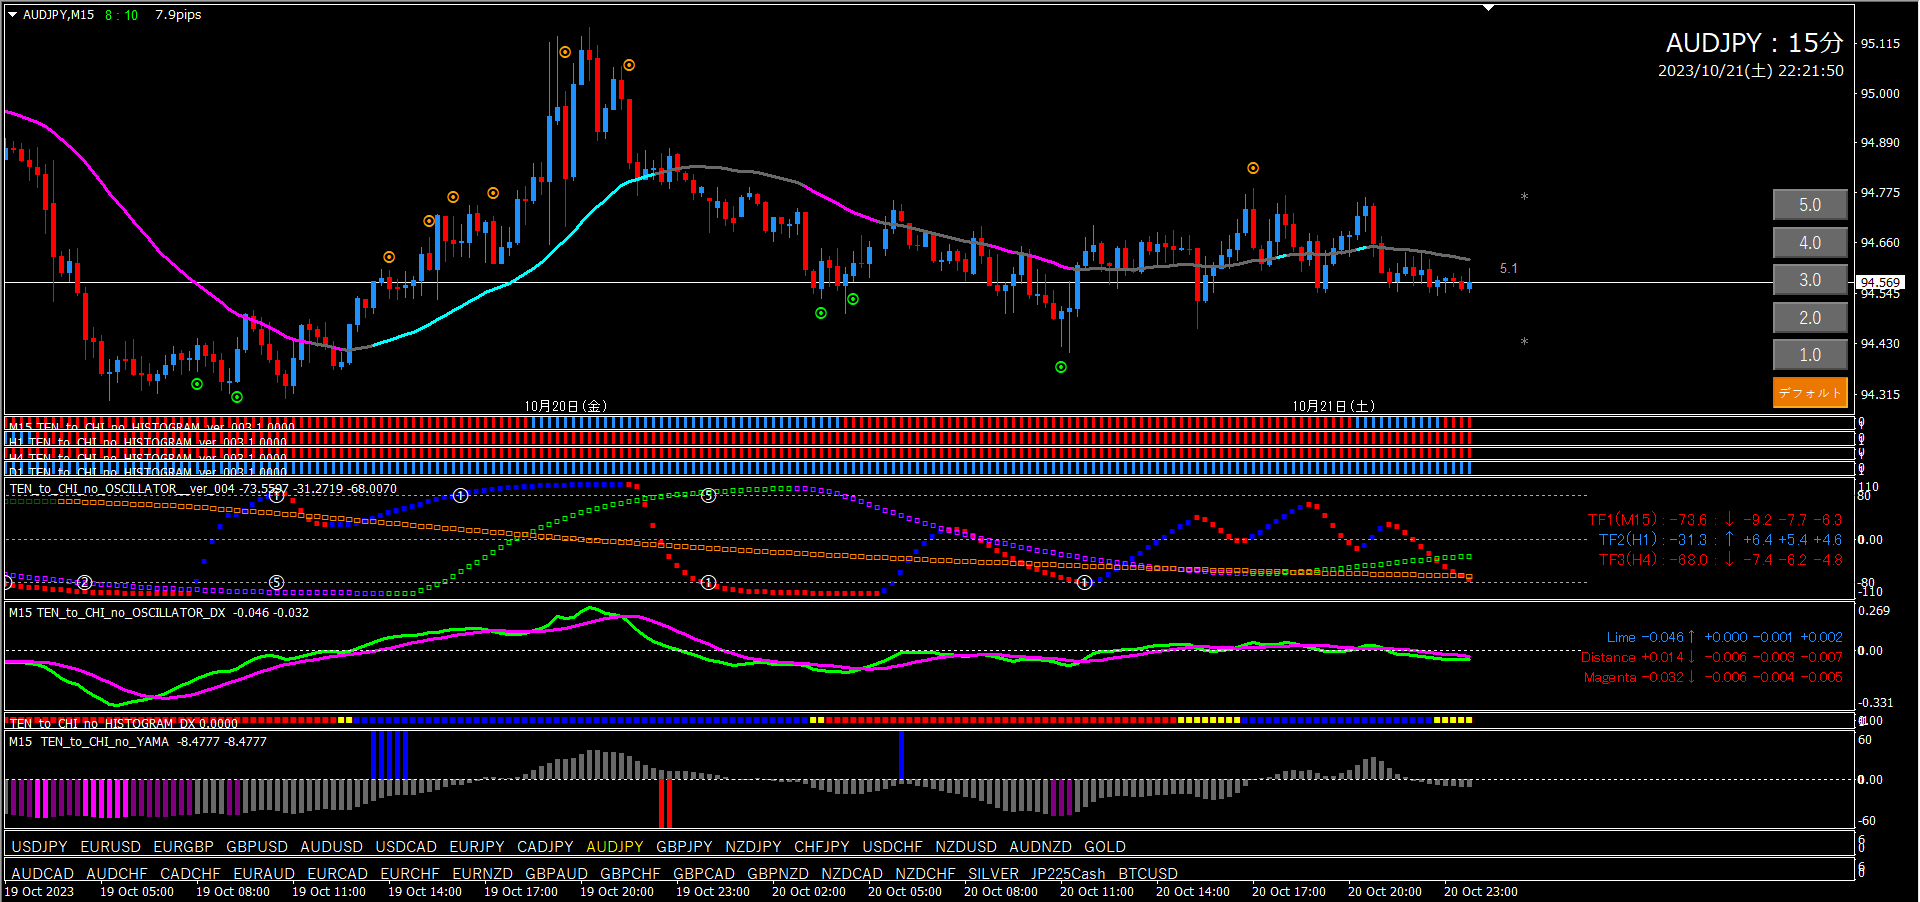
■ 15-minute chart (entry trigger)
After judging bullish on the 4-hour chart, target long entries on the 15-minute chart only.
The scenario is: after bullish judgment, confirm TF2 rise, then long trigger (dot, TF1, valley, if pattern looks good then DX) for entry. If all patterns look good, line trigger is acceptable.
■Heaven and Earth EA (used on 15-minute chart)
After bullish on the 4-hour chart, check whether Oscillator TF2 is rising.
When rising begins, use the EA pattern that best fits the current situation.
If the current candle is below the line, there is a high chance of a long dot signal, so set EA Pattern ①.
If TF1 is below the zero line, set EA Pattern ②.
If TF1 and TF2 reach -80 and Oscillator Signal ② appears, target EA Pattern ③.
If a valley lights up, set EA Pattern ④ at that point.
This is how we decide which EA to use based on the situation.

■ 4-hour chart (environment recognition)
Overall downward trend, so it seems reasonable to be bearish now, but it is safer to wait for the next pullback pattern.
If Oscillator TF2 continues to fall, TF1 rises toward +80, and candles break above the line, then a short signal dot or downward turn in Oscillator DX would indicate a bearish outlook. This may take more time.
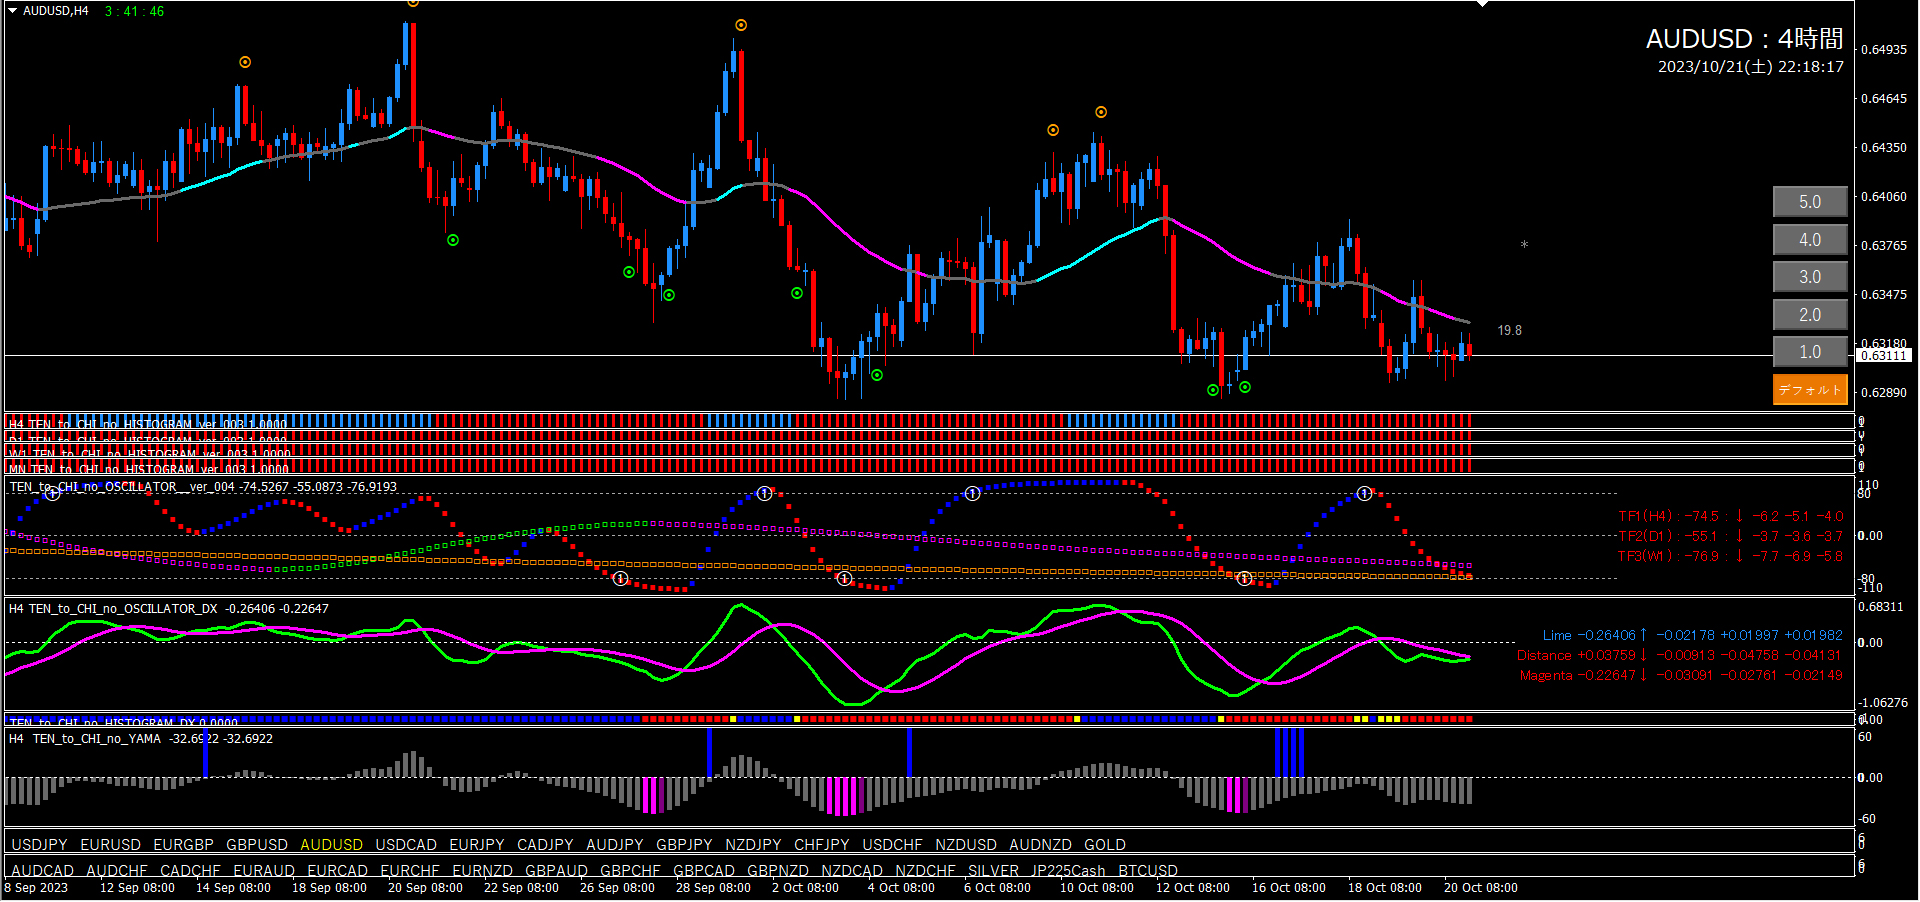
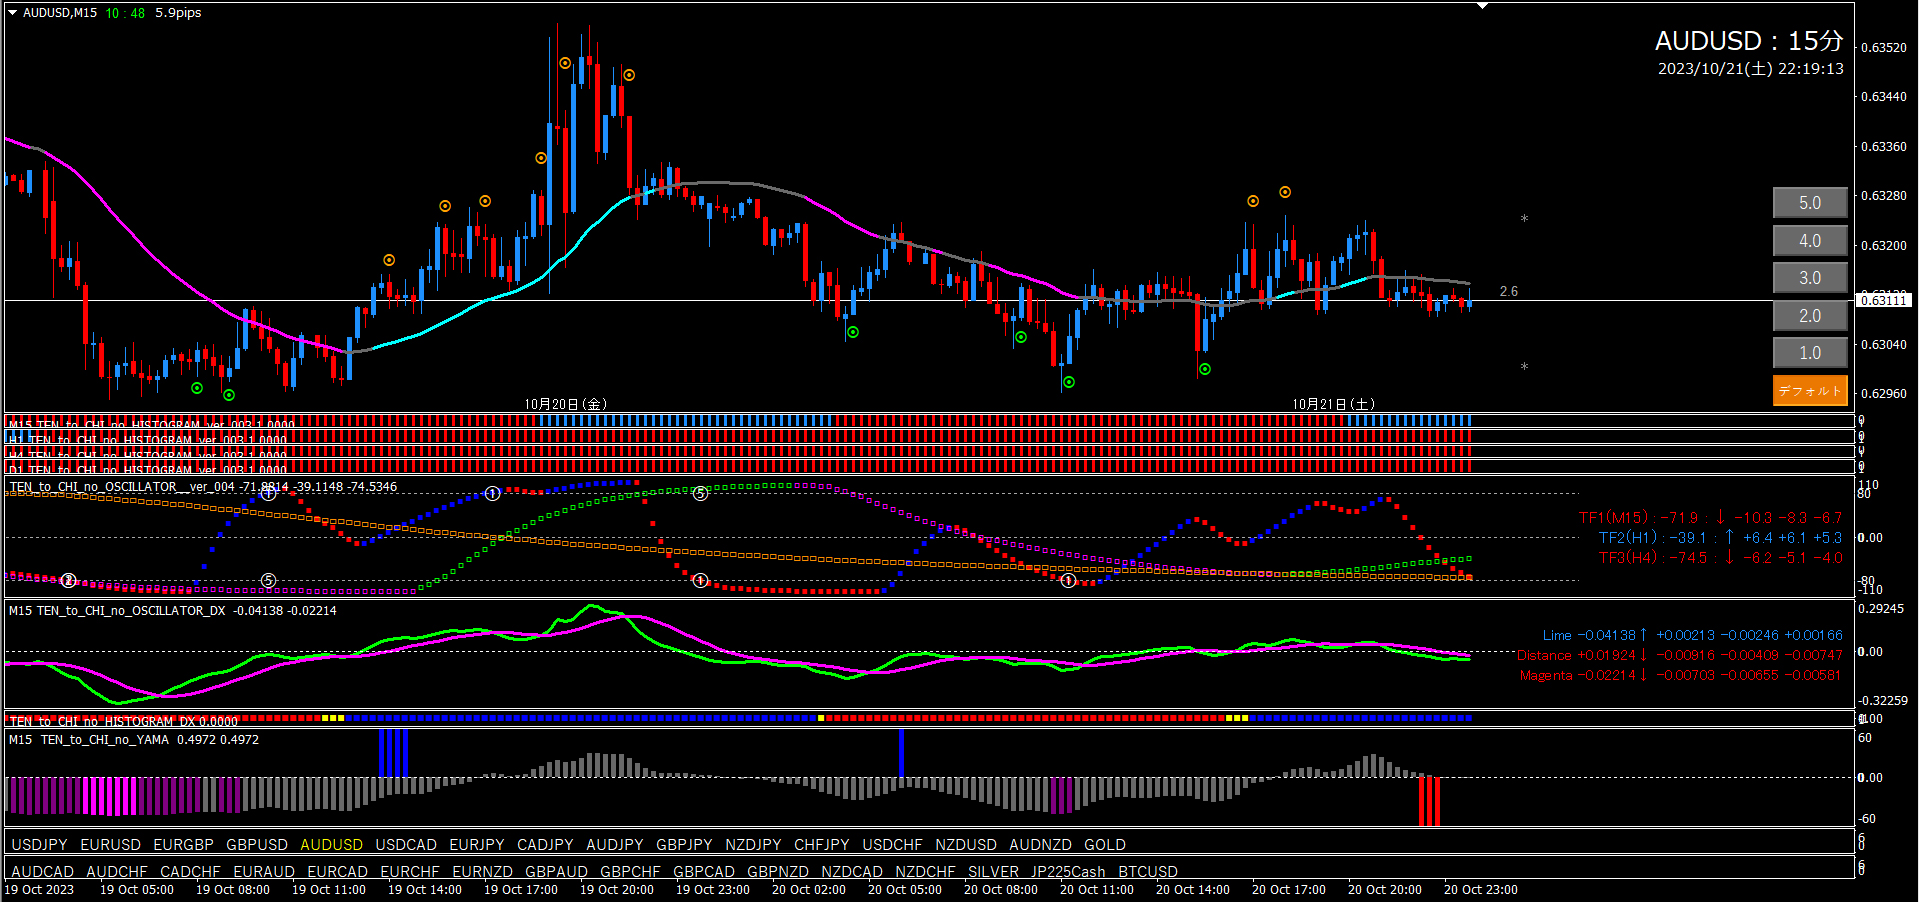
■ 15-minute chart (entry trigger)
After judging bearish on the 4-hour chart, target only short entries on the 15-minute chart.
Currently Oscillator TF2 is rising, so nothing can be done until it turns downward. By the time the 4-hour chart indicates bearish, TF2 should have turned. When it turns, enter on short trigger (dot, TF1, valley, if pattern looks good then DX). Line trigger is also acceptable in some cases.
■Heaven and Earth EA (used on 15-minute chart)
② EURJPY as reference.

■ 4-hour chart (environment recognition)
Oscillator TF2 is rising slowly; advantage is limited, but other conditions (TF1 turning up, DX rising cross, histogram all blue, valley) are favorable, so a bullish outlook is reasonable. However, looking at the candles, there is a possibility that it falls further and then rises when long signal appears. It might be wise to wait a bit. If Oscillator DX crosses downward or TF1 turns downward, reset the view and observe.
■ 15-minute chart (entry trigger)
Because the 4-hour chart is bullish, we target long entries on the 15-minute chart only.
Oscillator Signal ⑤ appeared, but TF2 declined. However, based on the 4-hour environment, there is still an edge.Future scenario: long signal plus Oscillator DX (Lime↑Distance↓) confirms a long entry. If TF2 continues to fall, wait for a new scenario.
■Heaven and Earth EA (used on 15-minute chart)
② EURJPY as reference.

■ 4-hour chart (environment recognition)
Oscillator TF2 is heading down toward -80, TF1 shows a similar shape. If you only look at the oscillator, bearish outlook remains until -80 is reached. However a risk factor is that Oscillator DX might cross upward. For safety, keep bearish stance unless Oscillator DX crosses up. Even if long signal appears, reset.
■ 15-minute chart (entry trigger)
With a bearish view on the 4-hour chart, target short entries on the 15-minute chart.
First wait for Oscillator TF2 to turn downward. Currently TF2 is moving mildly sideways with upward trend, so not much edge yet. The scenario is to wait for TF2 to turn down, then short trigger (dot, TF1, valley, if pattern looks good then DX) for entry. Line trigger is also acceptable depending on situation.
■Heaven and Earth EA (used on 15-minute chart)
② EURJPY as reference.

■ 4-hour chart (environment recognition)
Nice pattern. Oscillator TF2 is rising cleanly, position is good. TF1 is around -80. DX also suggests rising. At this point bullish outlook is fine. However, if TF2 turns down or a short dot signal appears, bullish outlook resets. If Oscillator DX turns downward, reset as well.
■ 15-minute chart (entry trigger)
Since bullish on the 4-hour chart, target long entries on the 15-minute chart only.
Oscillator TF2 is already rising. However TF1 and candle positions are not ideal. It may take a while before a short trigger appears, but if TF2 stays rising and long dot signal and TF1 near -80 align, that would be ideal. Oscillator DX is converging, so not useful this time.
■Heaven and Earth EA (used on 15-minute chart)
Since 4-hour chart is bullish, you may set EA Pattern ① or ② at this stage.
However, looking at TF1 position, it may take a little longer before auto-entry conditions are met. If TF2 turns down before then, EA will stop, so stay glued and set. If reset occurs, accept it and think of the next step.

■ 4-hour chart (environment recognition)
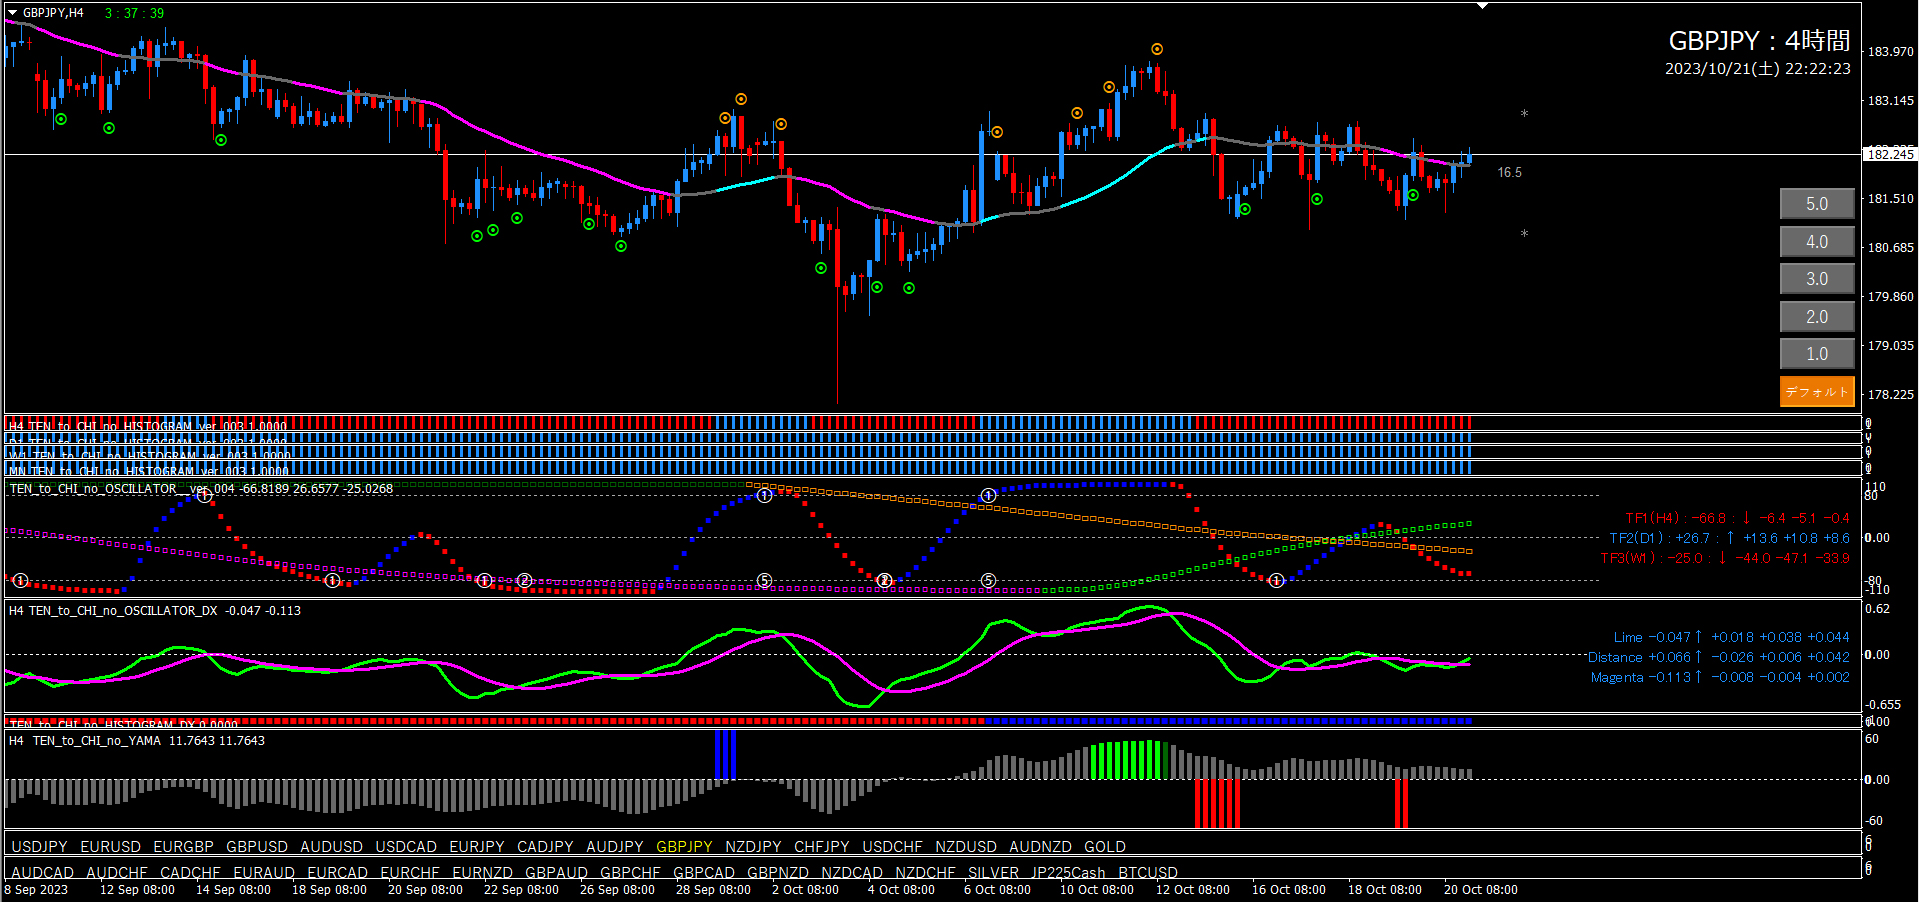
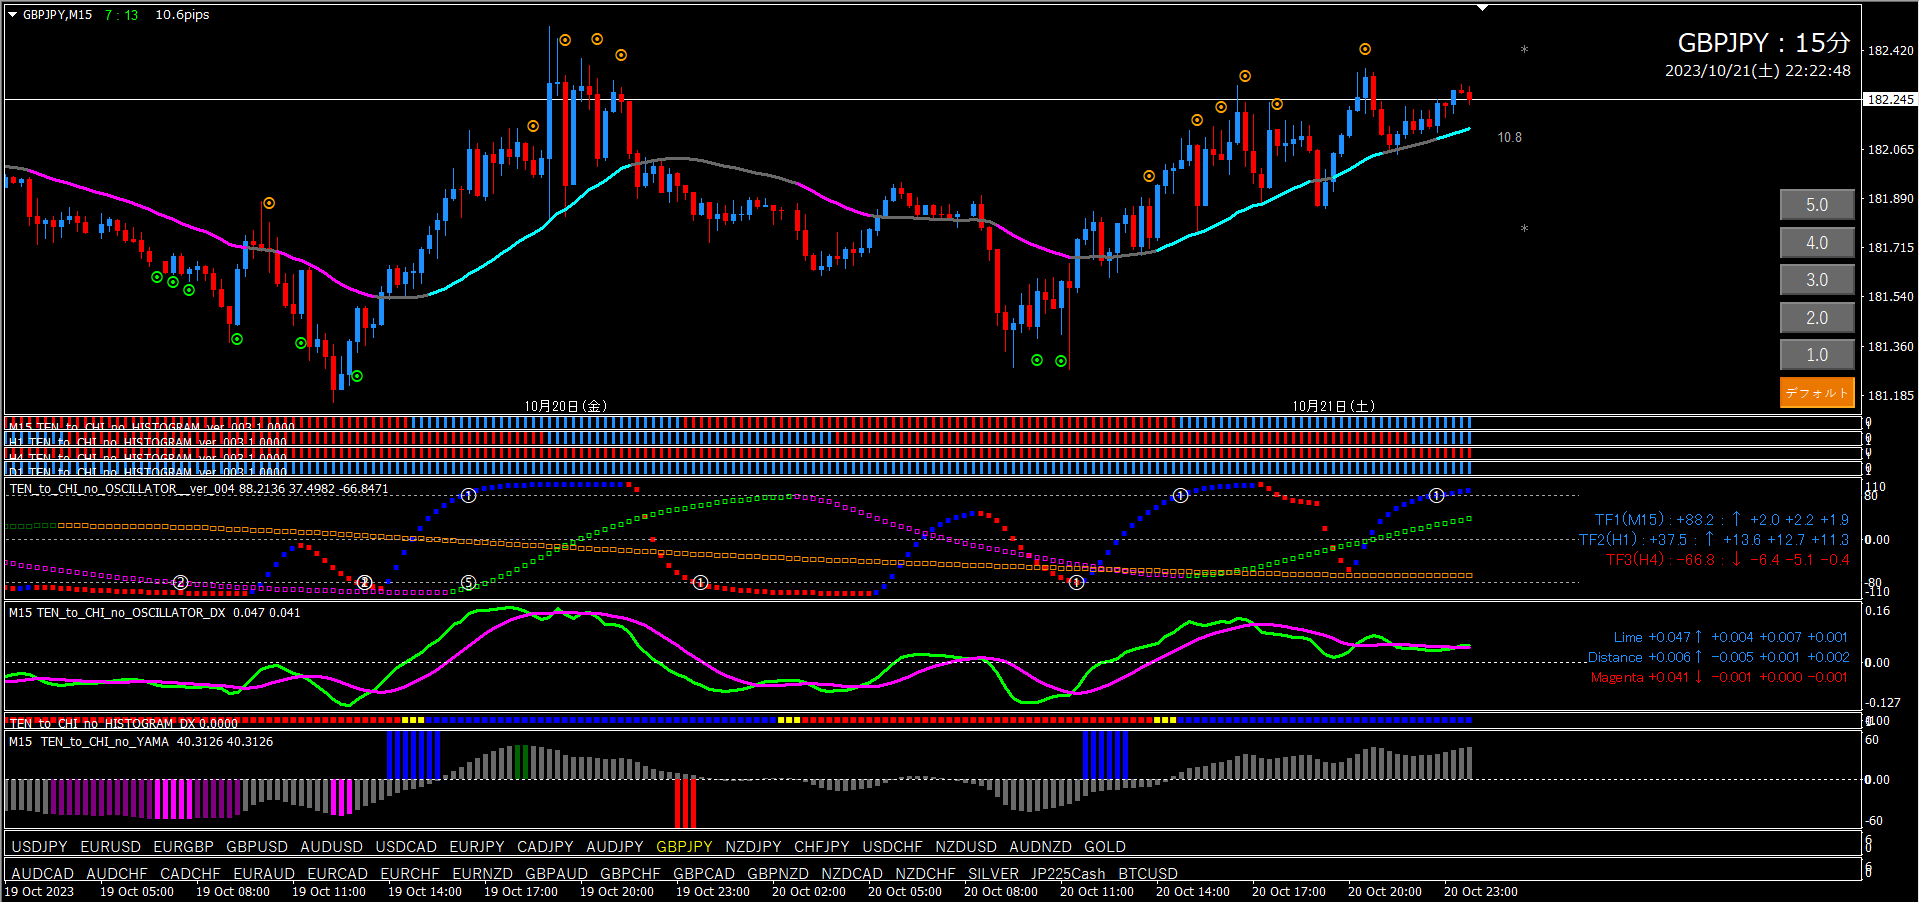
Oscillator TF2 and TF1 are rising from the same level; nearly at +80. Oscillator DX is also rising. It already seems to have risen significantly, but there may still be some upward momentum. Maintain bullish outlook for now, and reset if a short signal dot appears. A downward cross in Oscillator DX would also reset.
■ 15-minute chart (entry trigger)
Since bullish on the 4-hour chart, target long entries on the 15-minute chart only.
It seems to have risen already. There is not much to do currently. The future scenario may be to wait for a pullback to short-term decline at TF1, with long signal ideally, but may take more time.
■Heaven and Earth EA (used on 15-minute chart)
Since 4-hour chart is bullish, you may set EA Pattern ① or ② at this stage.
However, judging by TF1 position, it may take a bit longer before auto-entry conditions are met. If TF2 turns down before then, EA will stop, so stay glued and set. If reset occurs, accept it and think of the next step.

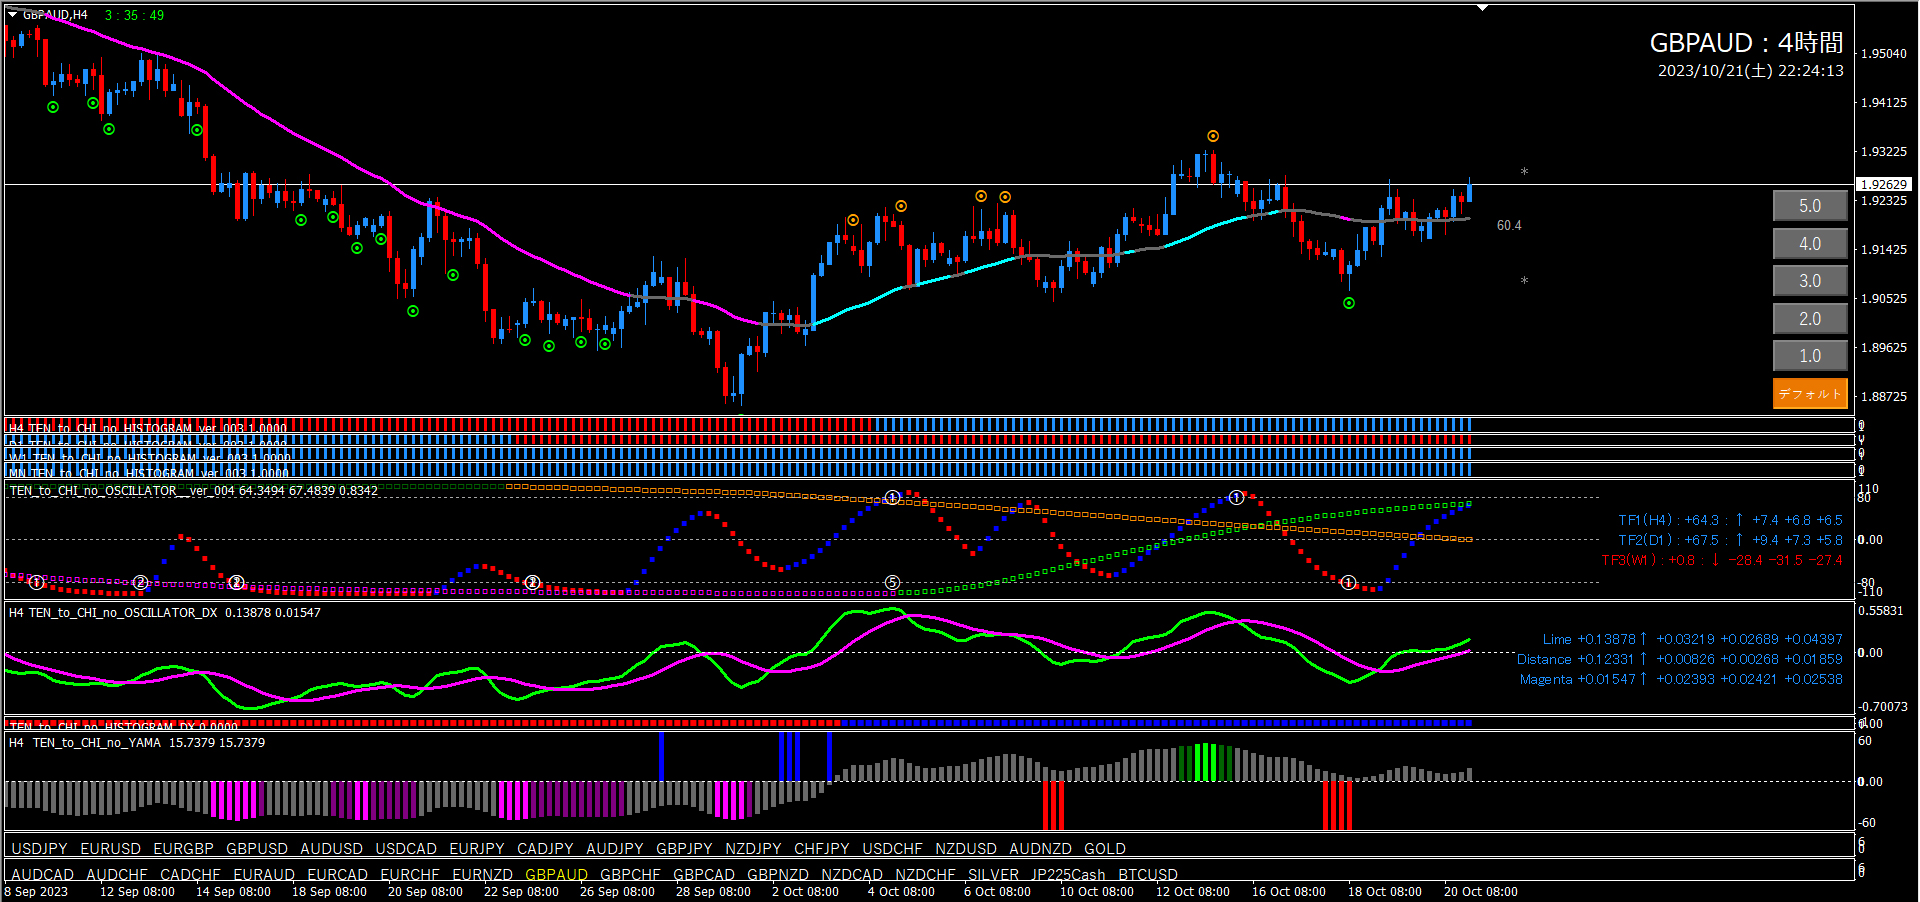
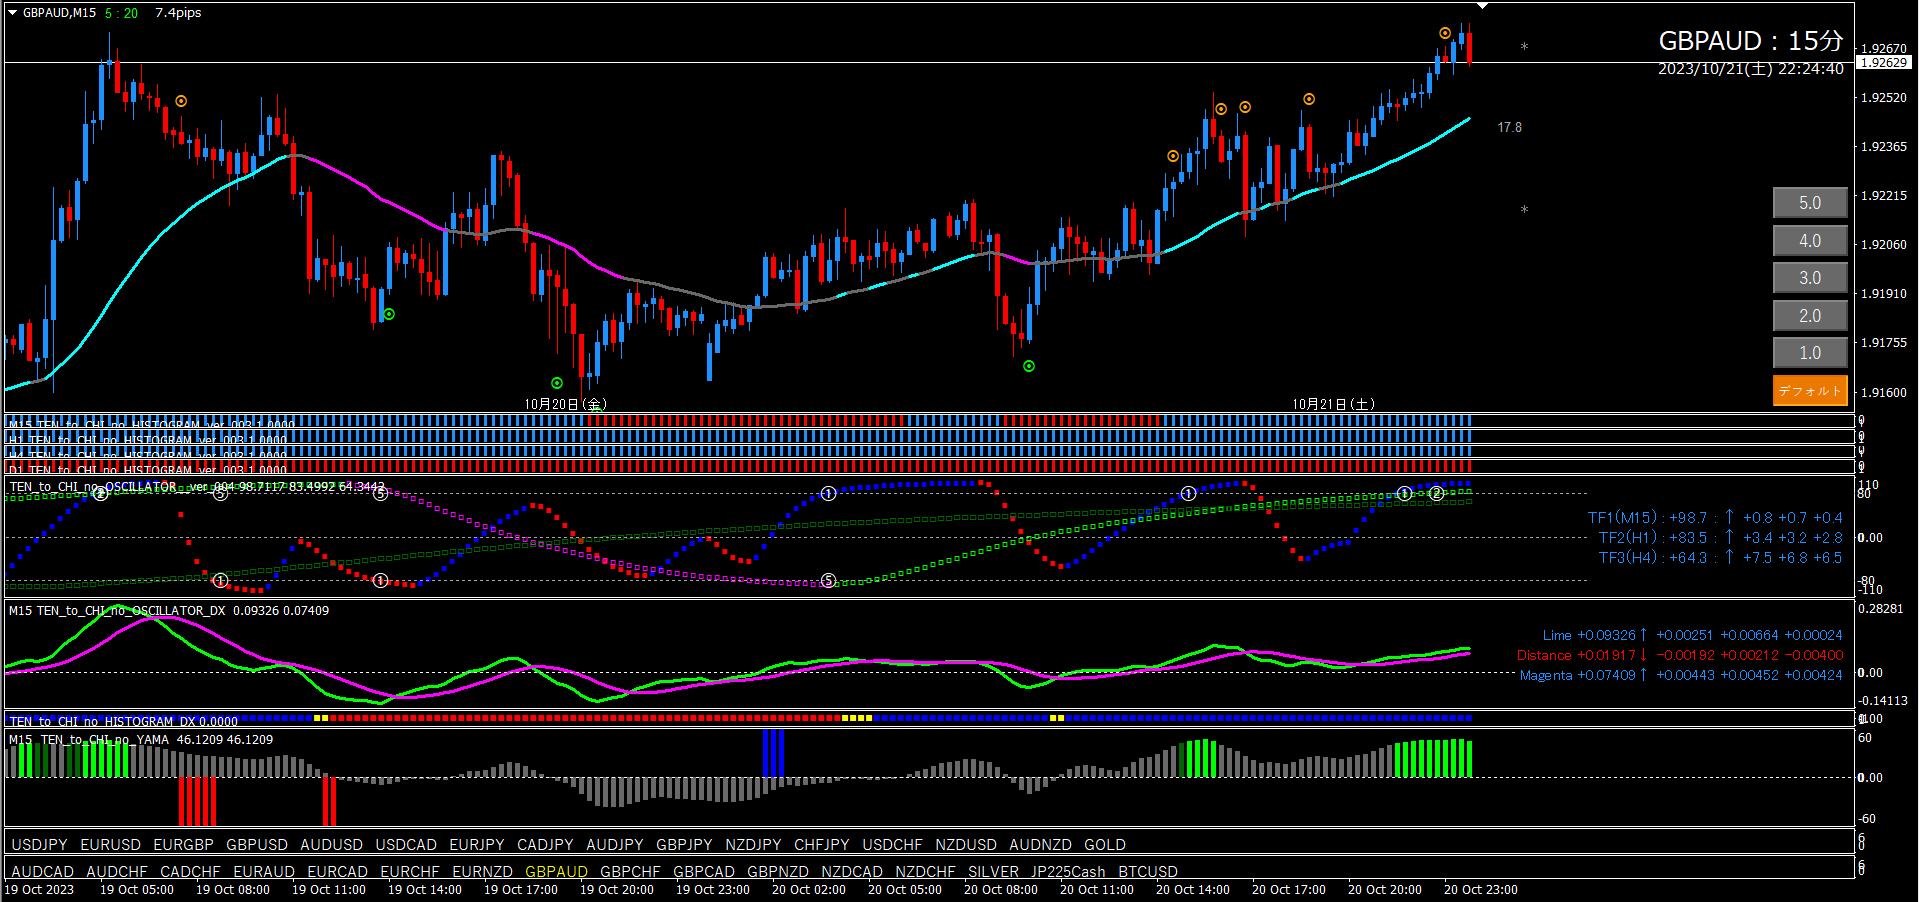
■ 4-hour chart (environment recognition)
Nice pattern. Oscillator TF2 is rising, TF1 has reached -80. This is a classic pullback buy pattern.
However Oscillator DX is still falling. The recent long dot signal can be avoided as a false breakout. When Oscillator DX fully crosses upward, consider bullish outlook.
■ 15-minute chart (entry trigger)
After confirming bullish on the 4-hour chart, target long entries on the 15-minute chart only.
TF2 has been hovering near -80 for a long time. First, wait for TF2 to rise. Then enter on a long trigger (dot, TF1, valley, if pattern looks good then DX).
② EURJPY as reference.

That is all.
I hope this is helpful to everyone.
