

Translate the following HTML content into English, preserving the HTML format and not introducing line breaks or Markdown code blocks. Decode any standard HTML entities before translating. Original: 億トレーダー達がやってるスキャルピング&【EA版】FXの普通じゃない両建て Translation: W
Good morning, everyone.
I have replied to all the messages I received from last night to this morning.
If there are still people who have not received messages, please let me know via a message.
I have summarized the important things about trading.
↓
[Definitive Edition] Billionaire Trader Scalp & Not-Ordinary Hedging
Yesterday's USD/JPY traded in a choppy range with many wicks throughout the session.
Around 18:00, when I started looking at the chart, USD/JPY was in a range vs. selling the pound.
At that time, the pound was being sold the most, and I wondered if it might start rising soon.
That was around 18:30.
The chart below is the 1-minute chart for GBP/JPY.
In the end, the uptrend continued from about 19:00 to about 23:00.
This chart eventually showed an uptrend, but
from the first move that might indicate this trend, the sequence of actions and thinking for taking positions
is described in the article, so I hope you will read it.
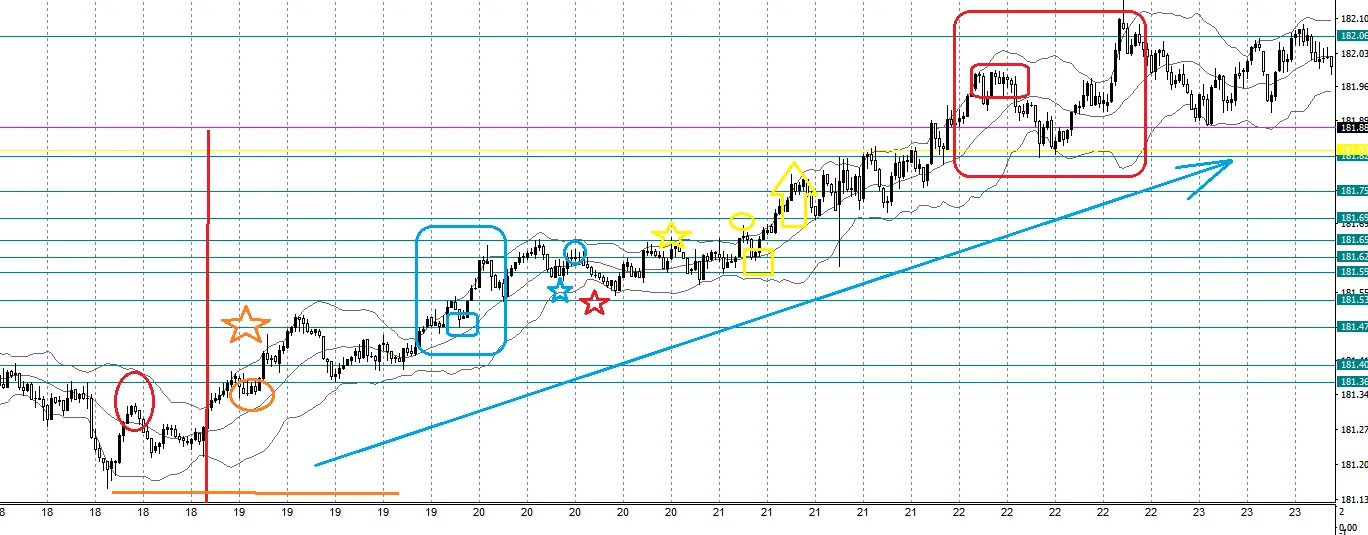
For all scalping users who are Billionaire Traders, please look at the GBP/JPY 1-minute chart.
From the red vertical line you can tell where buying and selling have reversed.
When the highest price on the far left (red circle) appeared, I thought if there would be another high...
I considered a quick scenario: go long at orange circle with L, take profit at the orange line or cut loss if the orange horizontal line breaks, and hold if it doesn’t break, but in the end I could not catch the initial move.
As an excuse, I felt I should have waited a little longer since I had just looked at the chart.
Often, when you skip such moves, the market moves as you expect.
Regathering my resolve, assuming the trend would continue, I went long with an L at the blue square, and
took about 10 pips.
Recently, as trading frequency has decreased, I’m taking a single shot of 200 units.
If I can gain 200k, that would be great.
After that, I expected it would probably move down to the day-before low yellow line, so I kept watching the chart only.
As a result, if you let your guard down, it moves, you know.
The market moves as if it sees through people's minds...
If you were trading then, there were options such as going long at blue star for a new high, or if blue circle does not exceed the left high, cut loss at the red star line, or hold until it breaks, etc.—and the result moved higher.
The result was an advance.
The yellow star line seems to be pressed from above, so if it breaks upward, there could be power behind it.
If you could have tested the L position at the yellow square, the chart would have been good in hindsight.
And in the final red square zone, this is somewhat different from the previous trend positions, so it would be good for Billionaire Traders' scalping users to confirm the red square zone on your own chart.
When a trend appears on a chart like this, it naturally forms clear pullbacks or reversals, but sometimes the pullback you’re looking at now could continue the trend as it is, and no one can predict that.
That said, the pullback you are watching now might break the most recent high, so you enter long at the pullback, and the rest is up to the outcome.
However, after a pullback or a retracement, there is a fairly high probability that the market will move a considerable amount.
Pullbacks or retracements are, in other words, tugging matches.
When I was a child, there was a comedy with Kinya Shinjirō and Chao Katō, where they held a rubber in their mouths and pulled against each other until one could not stand it and the rubber snapped with a pop.
It’s Showa-era TV, so young people nowadays might not know it.

This image was borrowed from Showa Guide's website.
In these tug-of-war outcomes, the chart extends as a result.
Charts that create pullbacks tend to rise in a V shape, big or small.
In the process of rising, taking profits or aiming for a breakout makes sense.
There are charts where power builds in a long range, and eventually one side breaks out, butUsers watching Billionaire Trader’s scalping charts are already aware whether it is a good time to buy or sell.
Pullbacks and retracements follow the chart direction you are watching, so it should be easier to plot post-position scenarios.
These three days of Investment Navigator+ have been writing about pullbacks and retracements; have you readers understood from my articles?
If you aim to master discretionary trading and live off the market, this trade will become indispensable.
Thank you again for today.
[EA Version] FX Not-So-Ordinary Hedging & Entry Tool
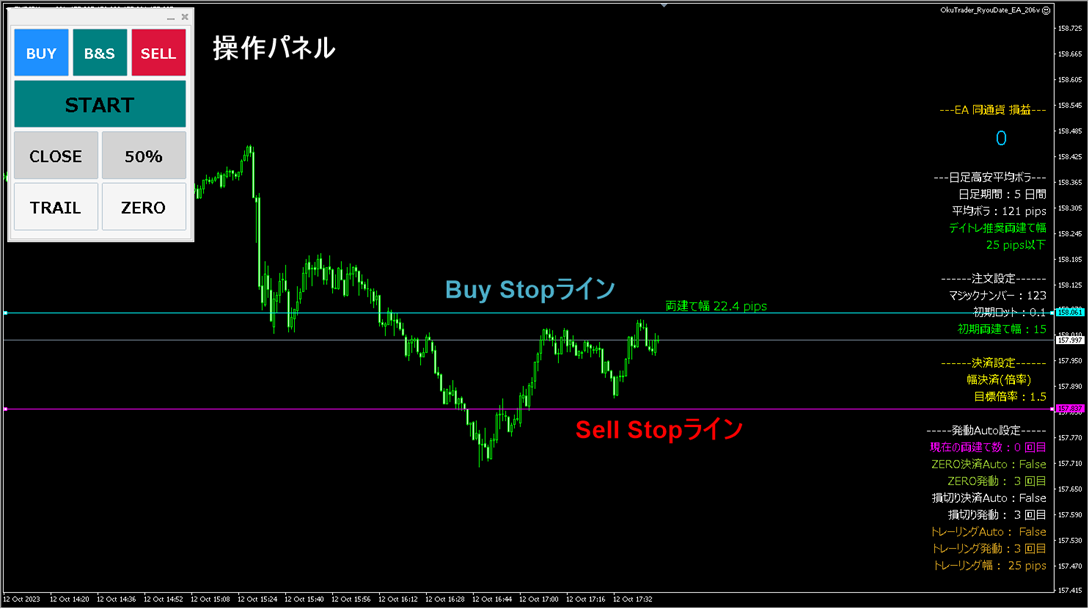
Scalping that Billionaire Traders are doing
↓
https://www.gogojungle.co.jp/tools/indicators/42559
Stress-free irregular hedging (well, it hardly loses)
FX Not-So-Ordinary Hedging
↓
https://www.gogojungle.co.jp/tools/ebooks/19435