

Hundred-million traders are doing scalping & [EA version] FX’s unusual hedging
Good morning everyone.
I have replied to all the messages I received from last night through this morning.
If there are people who have not received a message yet, please let me know via a message.
I have summarized the important things about trading.
↓
[Definitive Edition] Billionaire Trader Scalping & Not-Your-Average Hedging
During yesterday's daylight, there was dollar-buying and yen-buying, and the USD/JPY stayed in a range.
In times like these, European time tends to move European currencies, but predictions like this are, for example, because New York time last night was in a range, today during European time it will move.
Similarly, there are many cases where it repeats fairly often.
However, such predictions can only be discovered after watching charts for tens of thousands of hours; for someone starting FX now or who has been trading FX for only a year, easy predictions are not possible.
Nevertheless, readers who are currently reading this article have gained that wisdom now, so if such situations arise today, observe the flow and turn it into your future skills.
In short, what to look at.
All of those important points are written here in articles, so please do read if you’re interested.
The image below is the EUR/USD range after the start, and the 1-minute chart of the GBP/JPY during European time.
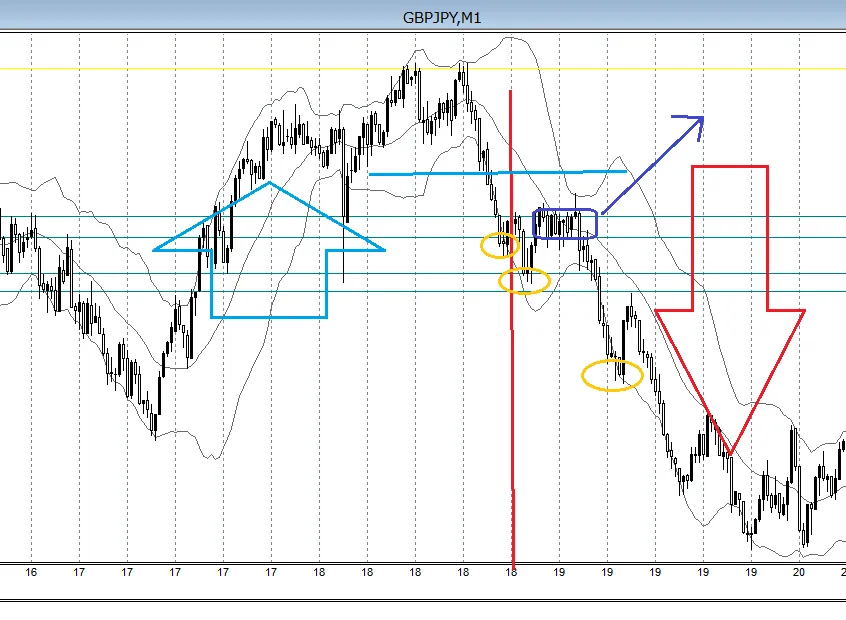
For billionaire traders who use scalping, from the red vertical line you can see that the buying momentum has shifted to selling momentum.
From here, please read yesterday’s Investor Navigator + article
to easily understand the meaning of the chart.
After posting yesterday’s article, several users messaged that the image made the buy-the-dip or pullback selling image much clearer.
With images, people tend to focus only on that part and try to find it only there, so it’s easier to understand by reading the text, thinking, and then looking at the chart to confirm.
“Understanding” and actually “being able to do it” are two different levels, so it’s common to feel you understand from an image but not actually understand in practice.
However, if my writing style is terrible, that defeats the purpose...
From the GBP/JPY 1-minute image above, first you can see that it bounced from the previous day’s high yellow line and fell, and once the blue horizontal line was broken, you could test the short position.
This line is not in the manual, but the blue line is something that the scalping users of billionaire traders will recognize by looking at it.
If you enter a short position after breaking this line, the stop loss point is the recent high or yesterday’s high beyond the yellow line.
The stop loss width may be large, but if a short position is successful, you may be able to hold to the bottom while trailing.
This is market, so you don’t know how long you can hold, but since you’ve caught the initial move, even if you close at breakeven, you’d want to hold to a reasonable goal for now.
Even the initial goal is determined in advance on the Billionaire Trader’s scalping 1-minute chart, before entering a position.
From the top two yellow circles, look for a short position in the blue □ zone, and if you move past that, the downward trend will not continue, so you should cut losses decisively.
Take profit when you break the second yellow circle from the top.
Whether you can hold onto it depends on the individual.
And if you see the third yellow circle, the pullback is in the zone up to the second line from the bottom.
If you short from the bottom up to the second line and then exceed that second line, it’s prudent to exit the position with a loss.
Here, it firmly rebounded at the first line.
Whether you can wait for that level depends on you, but if you lack confidence to wait, a split-entry might be fine.
Asset allocation is up to you.
Trading can be explained after the fact in many ways, but if you aren’t able to explain it to yourself in real-time while watching the chart, you probably won’t be able to create a “whatever-it-takes scenario” and enter.
A trade that can be explained in any way is, in a sense, a trend, so
with the mindset that trends will repeat as trends, you should face the charts.
In the end, the distribution of “success” and “failure” from those repetitions becomes the profit.
Thank you for your continued support today as well.
[EA Version] FX’s Not-Your-Average Hedging & Entry Tool
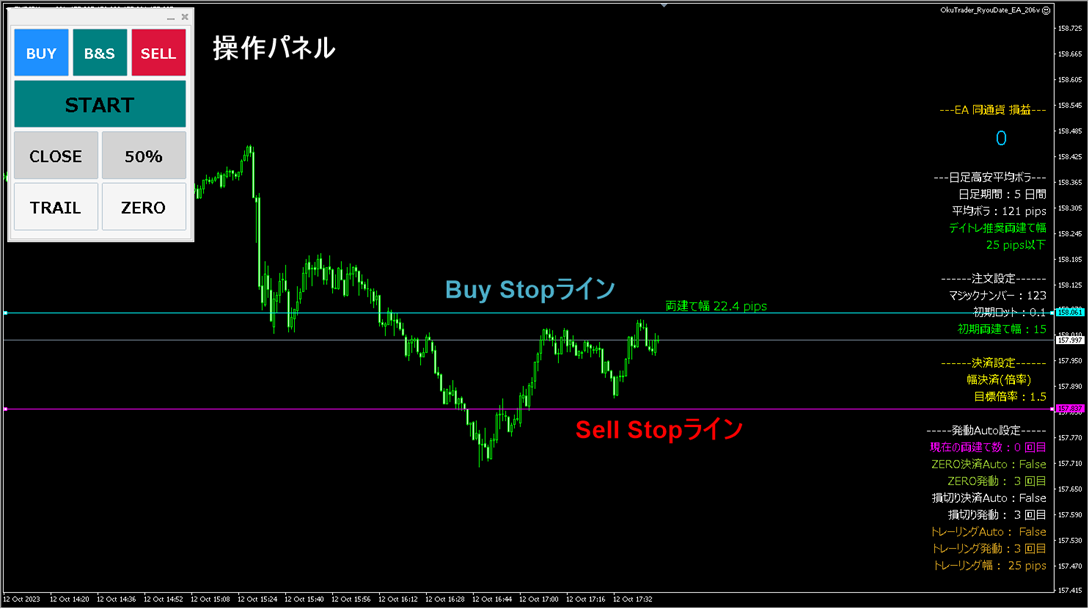
The scalping that billionaire traders do
↓
https://www.gogojungle.co.jp/tools/indicators/42559
Stress-free irregular hedging (well, you won’t lose much)
FX’s Not-Your-Average Hedging
↓
https://www.gogojungle.co.jp/tools/ebooks/19435