

Recommended indicators to pair with Stardust Edge Trade
Stardust Edge Trade
https://www.gogojungle.co.jp/tools/ebooks/45723
Stardust Edge Trade: Basic Chart Settings
https://www.gogojungle.co.jp/tools/ebooks/46928
Thank you for viewing.
The method of “Stardust Edge Trade” basically completes on a single chart.
However, monitoring many currency pair charts at the same time is time-consuming.
We want to maximize capital efficiency while efficiently selecting the targets to trade.
Therefore, there is an indicator that I recommend combining with “Stardust Edge Trade.”
Advanced Currency Strength28 Indicator
Please search for it on the MQL5 site. (Since it is sold by another company, I won't include a link just in case.)
This indicator displays the strength and weakness of each currency. Its unique feature is that it shows strength/weakness at Fibonacci levels.
I have tried it in combination with the “Stardust Edge Trade” chart.
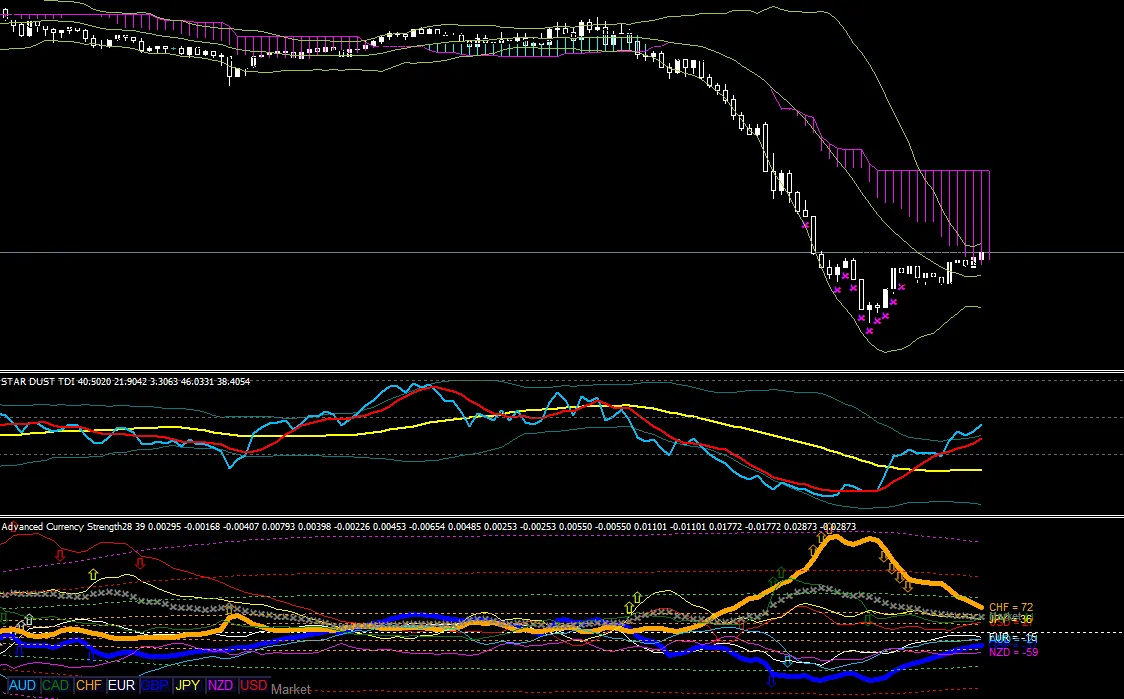
In the bottom sub-window of the chart, the indicator introduced here is displayed.
What this allows you to determine is that the most recent CHF is the strongest, and the GBP is the weakest.
Also, when Fibonacci levels approach the upper or lower bounds, signals of being overbought or oversold on the candlesticks appear (pink cross marks).
The merit of combining this indicator with “Stardust Edge Trade” is that even if the oscillator shows “too high” or “too low,” you can still judge that there is a high likelihood of entering using the Stardust Edge Trade method.
In the chart above, a recent downtrend signal occurred, and even if you consider selling, the oscillator level already appears “too low.”
However, by combining the indicator introduced this time, you can judge that there is still room for downside and proceed to trade according to the method.
So how should you utilize the oscillator? It is effective in situations of “pullbacks to buy on dips” and “re-entries for selling on rallies.”
In other words, you can use it to time your entries.
Please feel free to use it.