

Utilization of the “Visualization Indicator” (Part 116)
Use of the "Visualization Indicator" (Part116)
1. Further evolve the "28 Currency Pairs List Indicator" into the "8 CP Visualization Indicator" to drawAUDUSD on the chartwith AUDUSD.
The "8 CP Visualization Indicator" has versions for Oceania,Oceania版,London版,NewYork版,AnyCP版. This time, theOceania
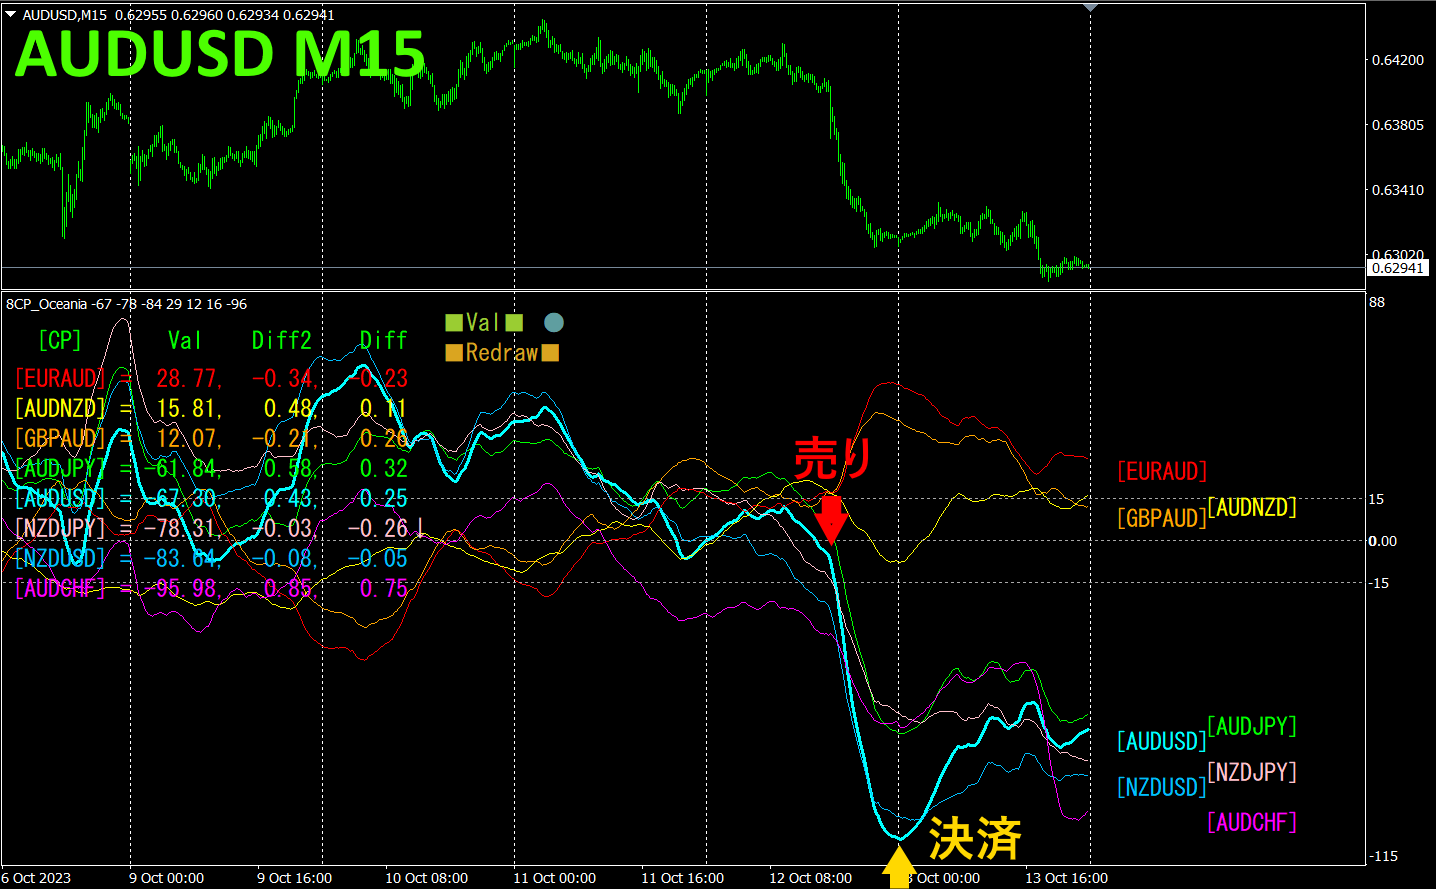
The upper half is the 15-minute chart ofAUDUSD. The lower half is from the “8CP Visualization Indicator”. The blue-thick line graph corresponds toAUDUSD.
On Thursday, AUDUSD fell below the threshold, so I entered a short. As the chart reached a bottom, I closed the position that day.About60 pips of profitwas obtained.
2. Best SelectTry the indicator
The below figure is a screenshot taken at2023 year10 month9 day23:39 (JST)
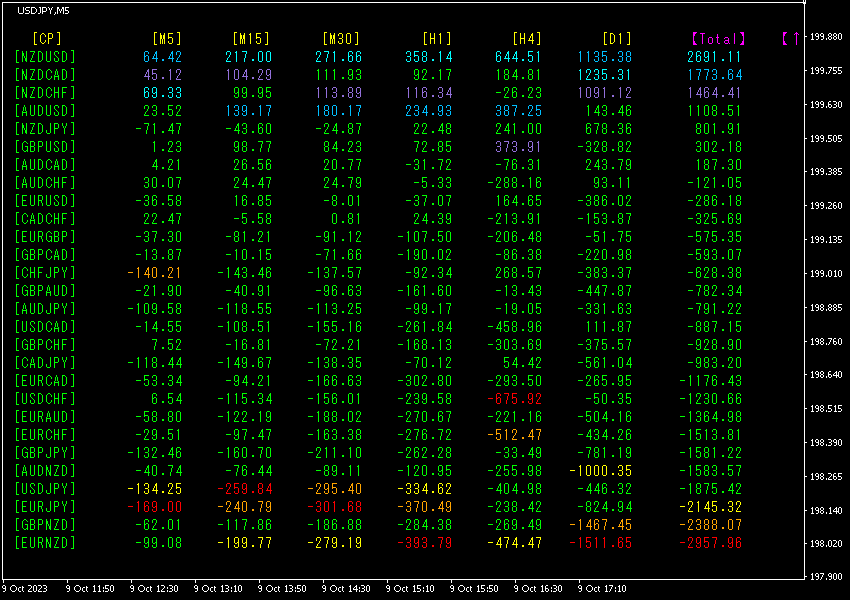
TotalValues are sorted in descending order. The top rowNZDUSD is shown in blue across all timeframes, and theTotal value is2691.11, indicating a large positive number. shows a strong uptrend.
Now, let’s look at theNZDUSD chart.
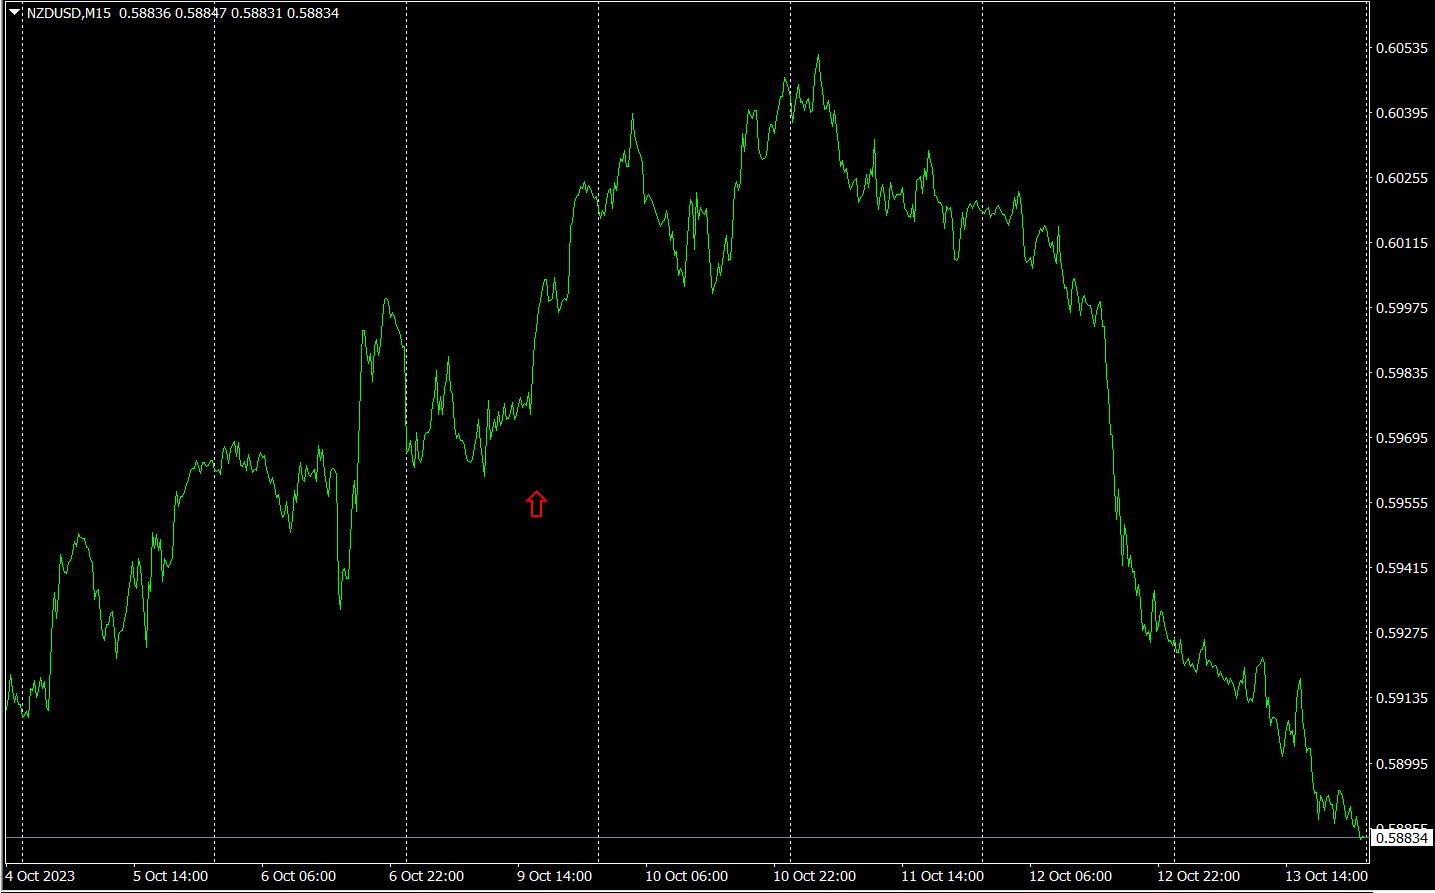
The red arrow marks where the screenshot was taken. It captures the surge in the middle of an uptrend with a rising slope.
“28 Currency Pairs Best Select Indicator” allows you to easily identify which currency among the 28 pairs is currently showing the strongest trend. It also tells you, with numbers and colors, whether you should trade now. It enables a quick, comprehensive view of all currency pairs’ movements.
“28 Currency Pairs Best Select Indicator”
https://www.gogojungle.co.jp/tools/indicators/35128

3. Since May of the year before last, what happened to EURJPY?
From May year 5 month, EURJPY has been tracked.
To view the overall trend, a30-minute chart showing about the last3 weeks is drawn.
Previously, I wrote the following.
EUR tends to move horizontally to the upside,JPY rose briefly but then turned, moving downward. In any case, shows a stronger tendency than. Hence, EURJPY is expected to rise in the future.
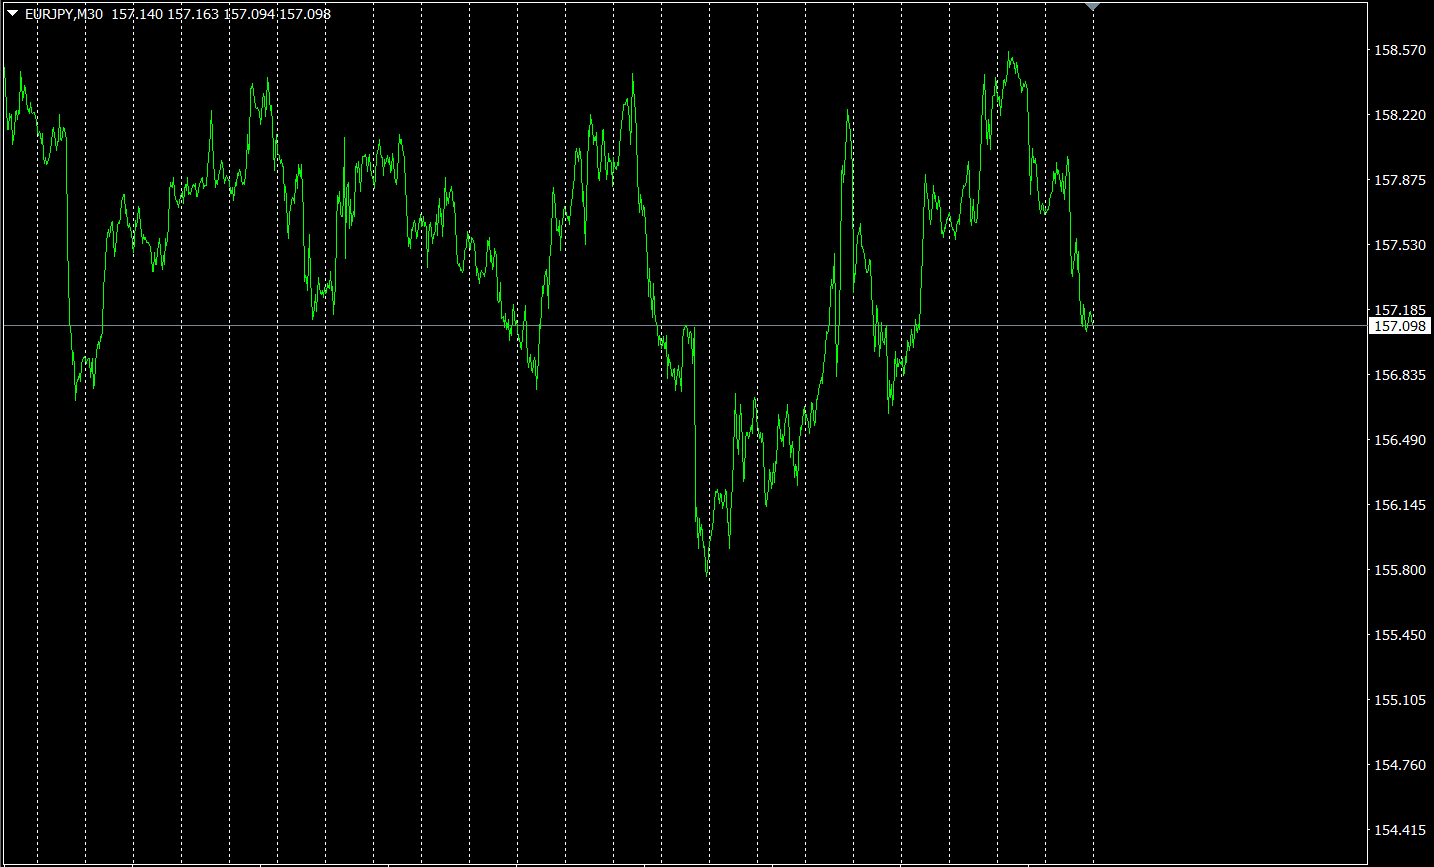
Monday fell sharply, but later rose and closed lower by the weekend.
4 Timeframe currency strength chart.
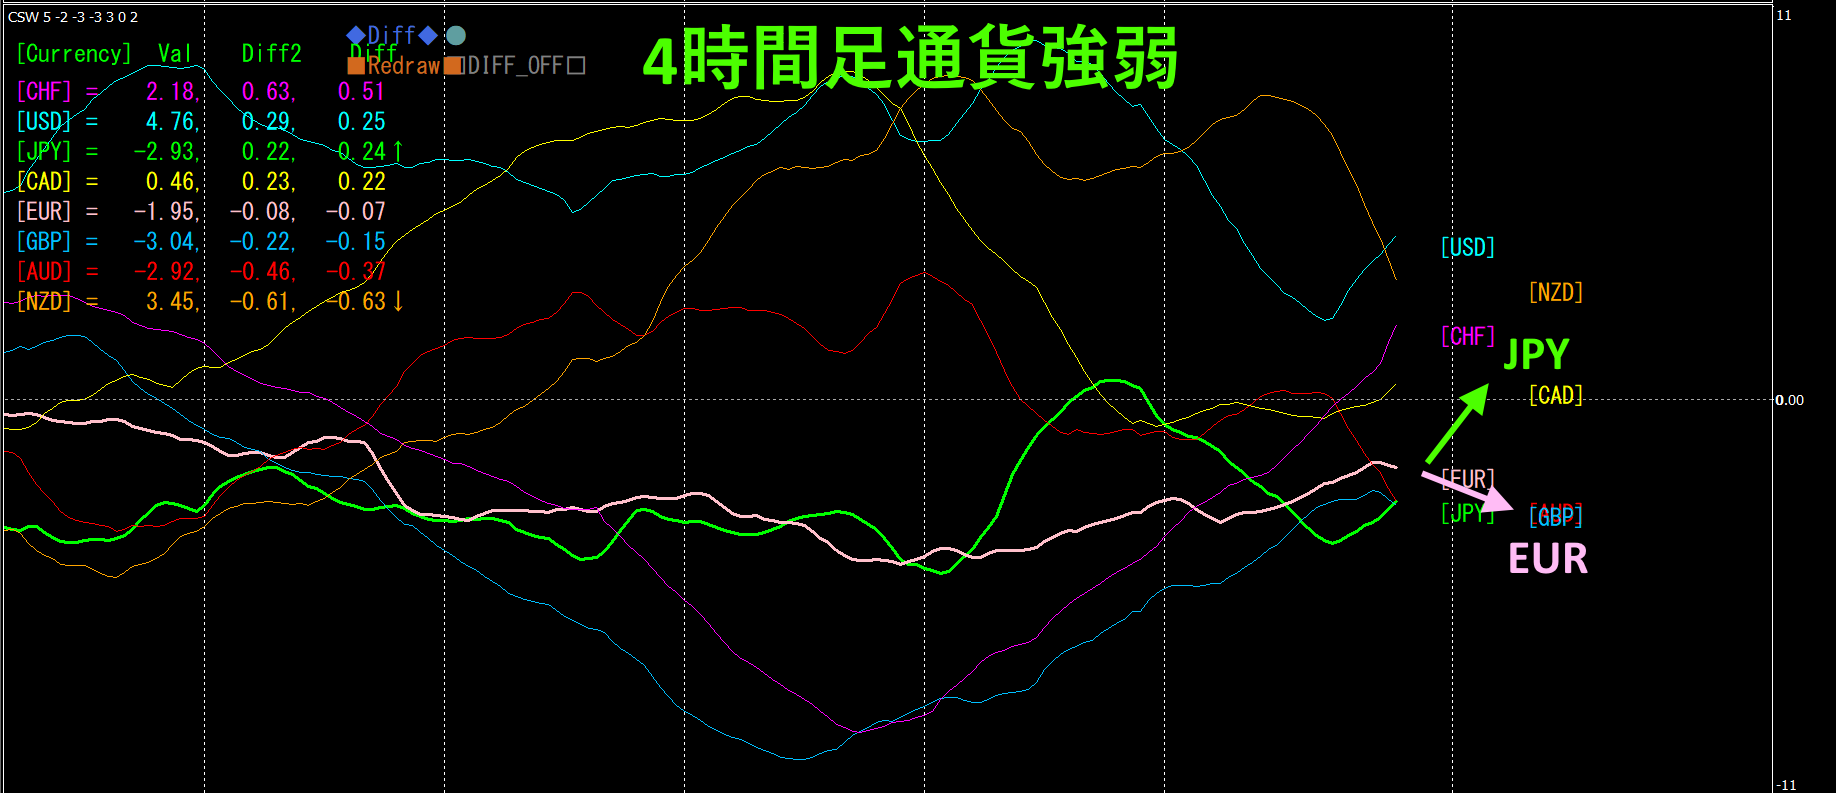
Pink isEUR, green isJPY. EUR is slightly downward from horizontal; JPY has turned upward. The overall direction is not very clear. In the future, EURJPY is likely to move in a range.
4. Scan all currency pairs for tops and bottoms and devise a trend strategy (new targets)
Last time, the USDCHF buy strategy yielded substantial profit, so I will look for the next target. As before2505 “Top and Bottom Search Indicator” is used.
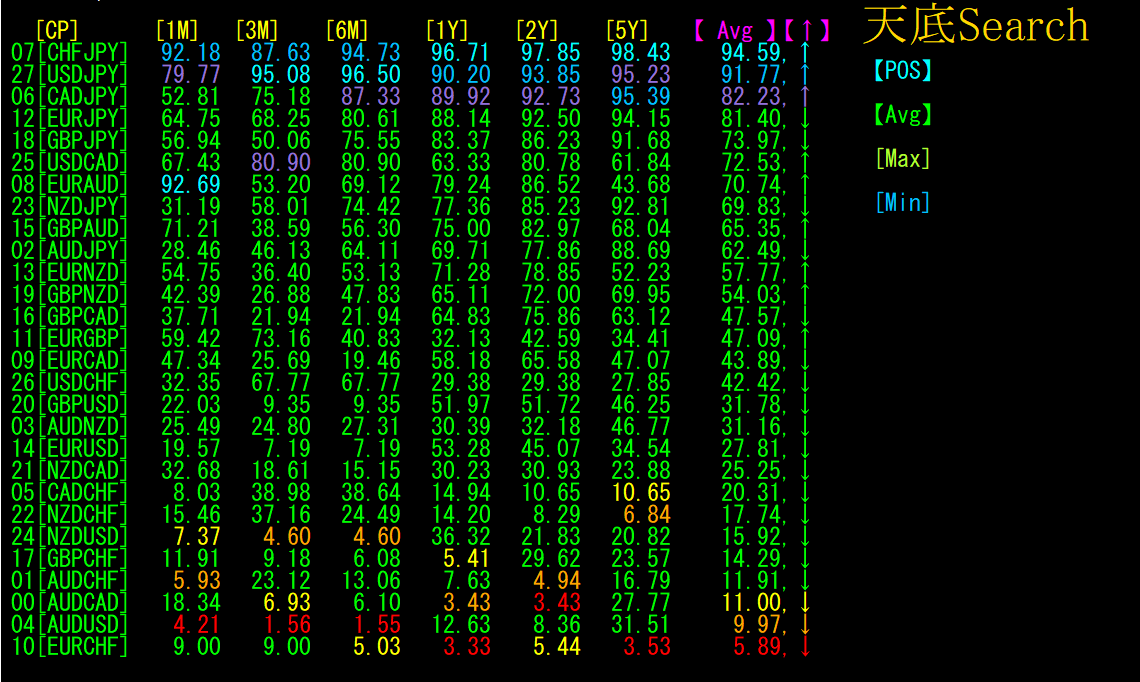
According to the “Top and Bottom Search Indicator,” the currencies at the tops are,USDJPY, and those at the bottoms are,which can be selected.AUDUS
Now, let’s view each daily chart.
<Top Zone: Two Currency Pairs>
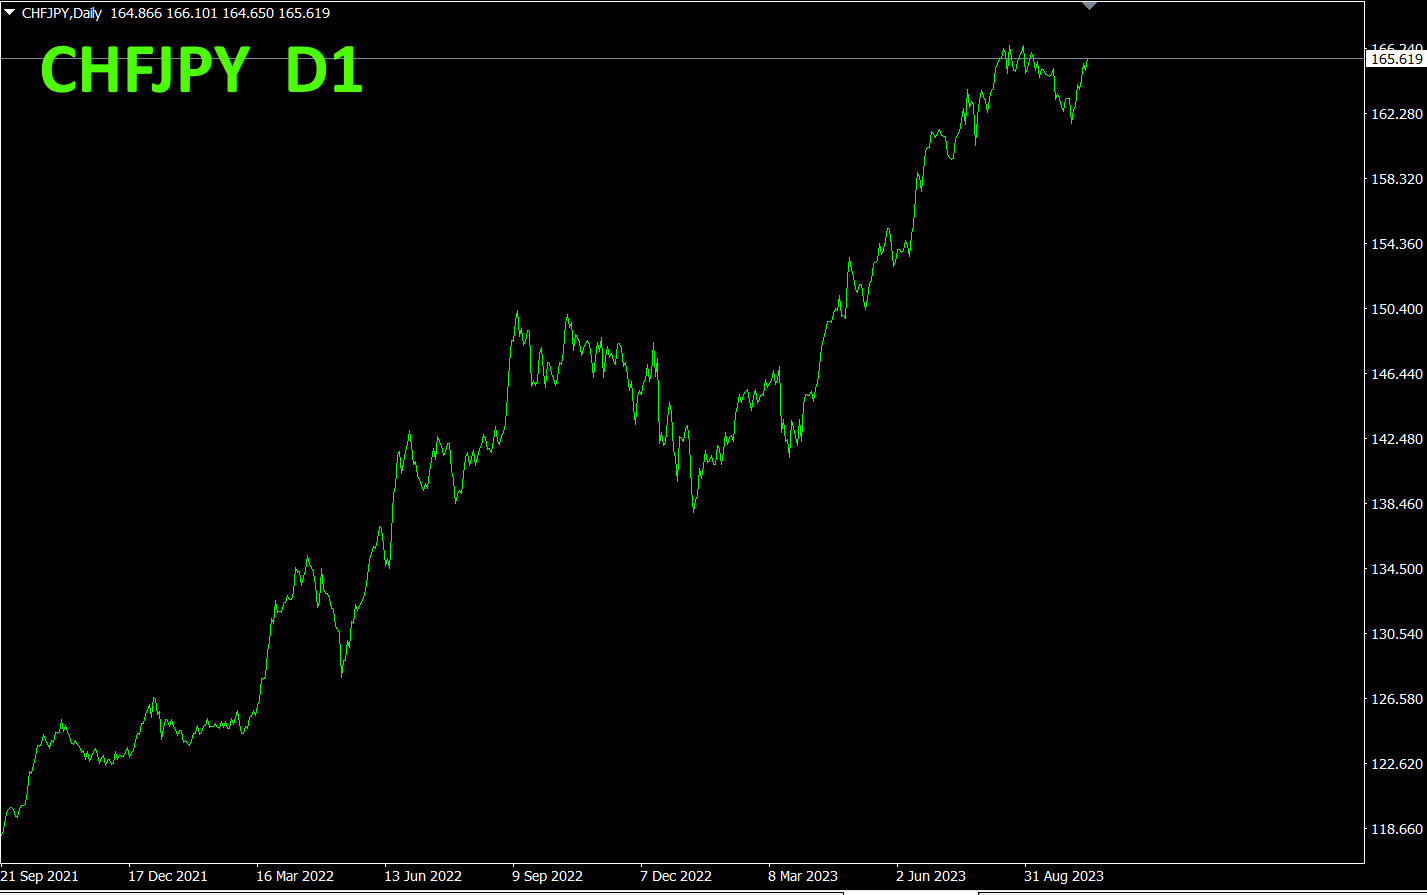
CHFJPY appears to form a double top at the top. The direction remains upward (Top and Bottom Search Indicator also shows an upward arrow), so wait until the rising trend line is broken downward.
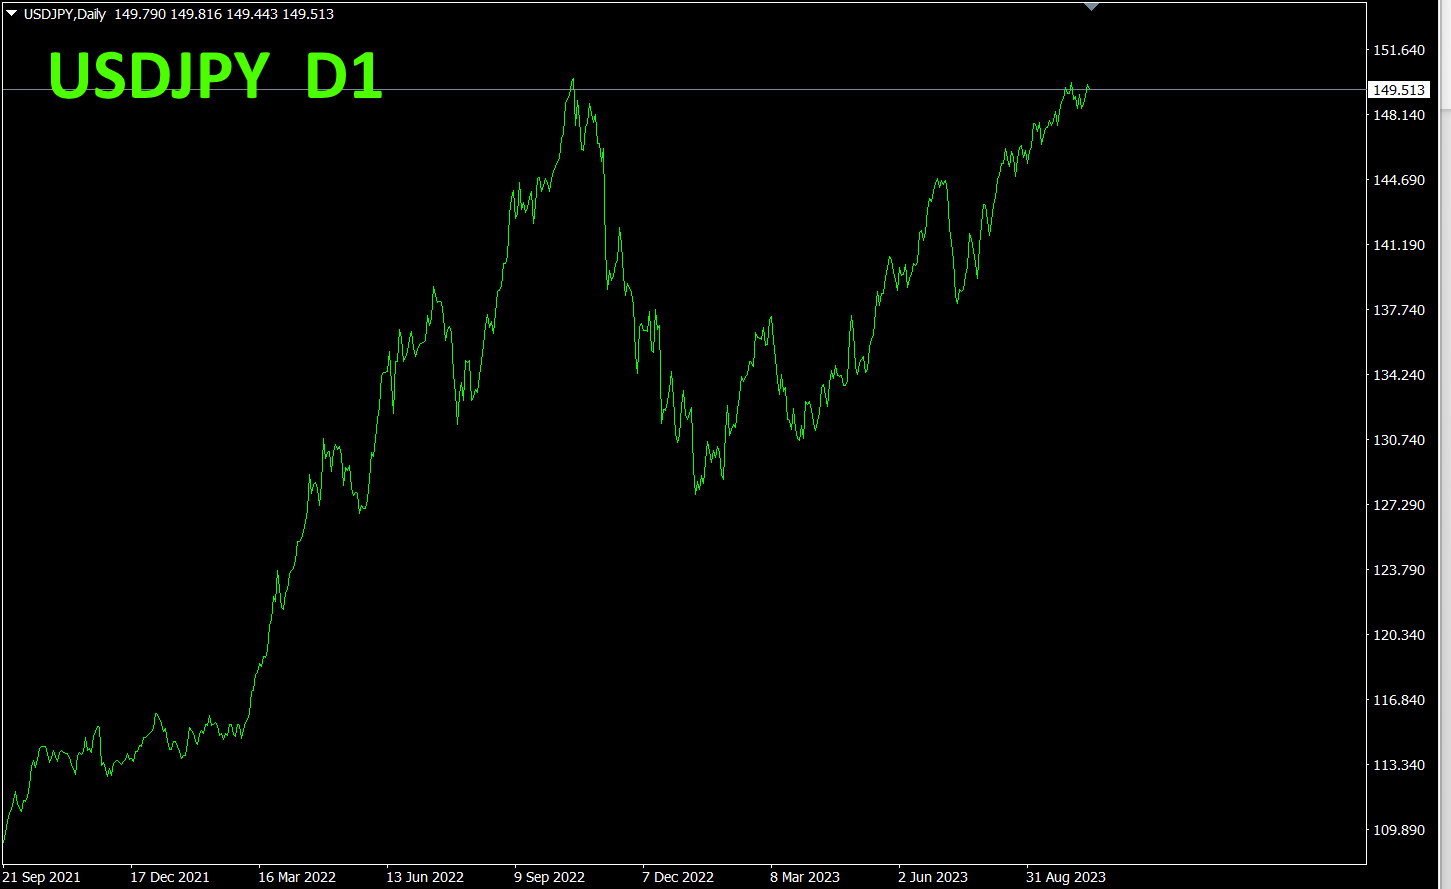
has reached the recent high. It sits around the round number 150 yen, acting as a strong resistance line. However, if it breaks through, the dollar could move toward 200 yen. The yen is "too weak as a currency," so the USD/JPY rate could reach 200 yen.
<Bottom Zone: Two Currency Pairs>
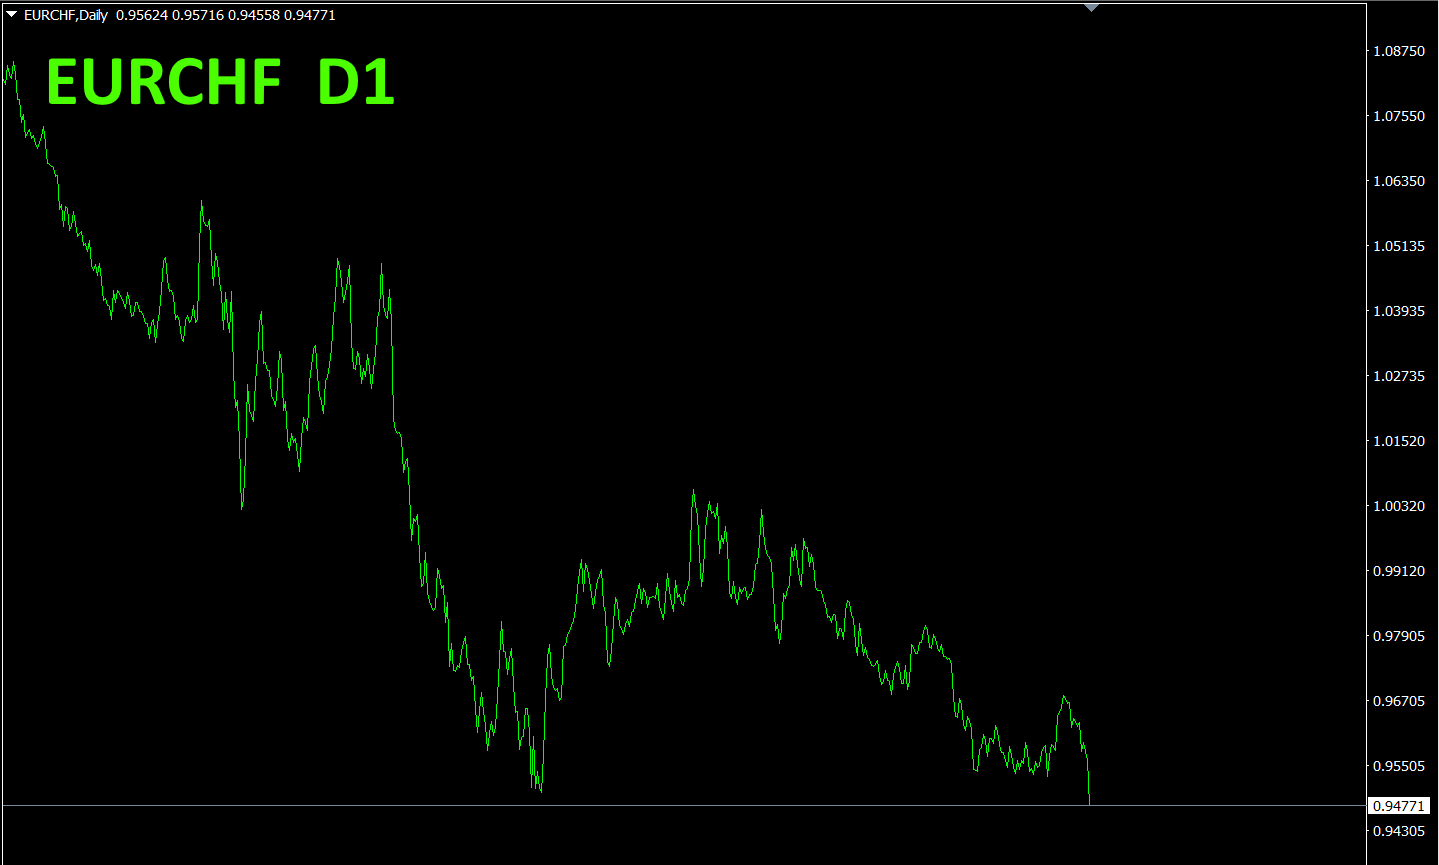
EURCHF has fallen below the recent low. It may take a while for it to reverse and rise again; be patient.
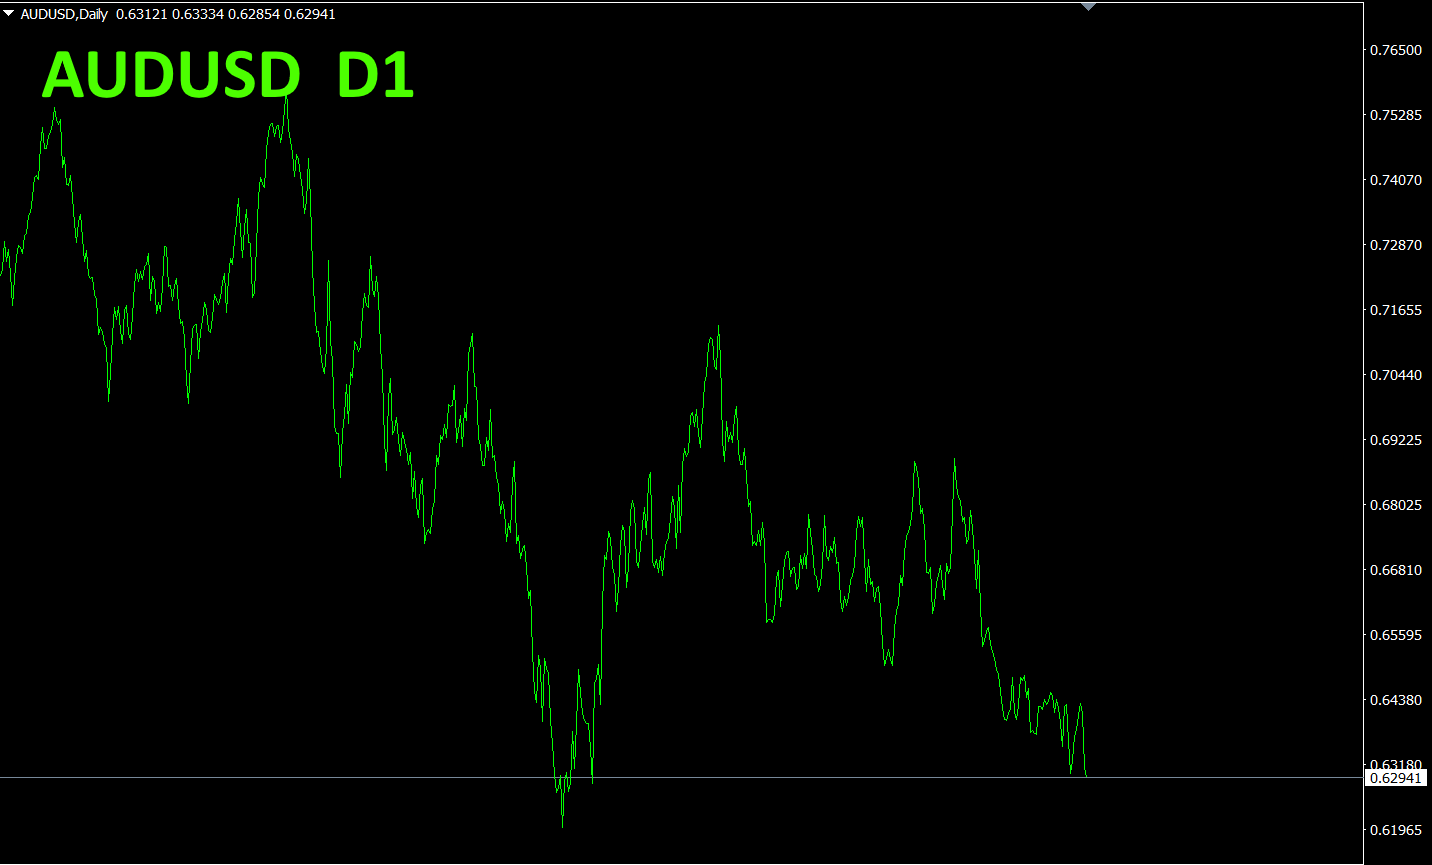
AUDUSD shows no signs of rising. Wait patiently for a reversal.
In the daily charts of the top-zone two currency pairs and bottom-zone two currency pairs, none are ready to trade immediately. Monitor suitably and simply keep waiting.
With a semi-automatic EA, the “Trend Line EX” lets you draw a slanted downward line; if price breaks above, it automatically buys, and if it breaks below the rising line, it automatically closes the position, enabling a hands-off trading setup.
※“Trend Line EX”

https://www.gogojungle.co.jp/tools/indicators/42257
If you are interested in the “8C Currency Strength Visualization Indicator,” please refer to the following page.
MT4 version https://www.gogojungle.co.jp/tools/indicators/39150
version https://www.gogojungle.co.jp/tools/indicators/39159
【My items for sale】


