
What is the underlying cycle theory that explosively increases the accuracy of cycle theory?

In recent years, a trade method that has gained explosive popularity in Japan, including something called cycle theory, exists.
・What is cycle theory?
It is one of Dow Theory, Elliott Wave, cycle theory, and Wave Theory, andit is said to be able to predict the timing and periods when a chart reaches a top or a bottom.
Raymond A. Meriman proposed that the market is a measurable phenomenon in which bottoms, tops, and bottoms appear at regular intervals as one cycle.
In Japan, the first prominent figure of cycle theory is Makoto Matsushita.
It is mainly at the 4-hour, daily, and weekly levels, and among them, it is particularly suited for long-term market analysis that can be confirmed at the daily and weekly levels.

4-hour chart (4H cycle): one cycle in about 60–80 candlesticks
(60–80 bars ÷ 6 bars per day = 10–11 days per cycle)
Daily chart (Major Cycle): one cycle in about 35–45 candlesticks
(35–45 bars ÷ 1 bar per day = 1 month to 1.5 months per cycle)
Weekly chart (Primary Cycle): about 24–35 bars per cycle
(24–35 bars ÷ 1 month ≈ 4 bars) = roughly 6–9 months per cycle)
Half-Primary Cycle: about 55–70 candlesticks on the daily chart for one cycle
(some traders do not use this)
and the number of candlesticks is fixed.
Sometimes the bottom occurs at 70 bars, other times at 75 or 78 bars.
Meriman referred to this error as the “orb,” noting a ± one-sixth-week orb exists.
Probabilities are said to be 80%, and it does not always fit exactly; for example, on a 4-hour chart, it may range between fewer than 60 bars and more than 80 bars, with a 20% probability.
In terms of period, on a 4-hour chart the cycle ends in the second week, and a new cycle begins.
・How to use and how to think about cycle theory
For example, in a 4-hour cycle, one cycle consists of about 60–80 candlesticks, forming the bottom → top → bottom sequence.
That means the next top is expected to occur 60–80 bars after the bottom of the previous cycle.
If you are trading with a trend-following approach, this 60–80 bar window can be used as a guide for taking profit at the bottom, and if the trend continues, as a point to add to your shorts.
If you trade contrarily, a bottom will come within the 60–80 bar window, providing a cue to initiate a counter-trend trade from there.
Once a cycle begins, it inevitably rises and then falls after reaching the top.
The target is either the initial rise of the cycle or the decline after the top.
In an uptrend, the early rise tends to be longer, so you target the former; in a downtrend, you target the decline after the cycle’s initial rise, once the top has formed.
・Translation
There are two forms of cycle shapes.

The first is a Light Translation.
It forms the top toward the latter part of the cycle.
In this shape, the advance in the first half is long and the reversal in the second half is short, commonly seen in an upward trend.
In other words, the first half is the rise in the uptrend and the second half is the pullback wave.
The second is a Left Translation.
Contrary to Light Translation, the top comes in the first half, so the first half’s rise is short and the second half’s reversal is long, commonly seen in a downtrend.
Conversely, the first half’s rise becomes a return wave and the latter half’s rise becomes the continuation of the downtrend.
・The combination of Risk-Reward and Cycle Theory is the strongest

If you can predict that a top is near with cycle theory, you can determine the top’s location by fitting it to a chart pattern.
In other wordssetting the stop loss right above the predicted top minimizes risk and enables you to target the top!
If you can capture the top, you can reduce the risk-to-reward ratio and maximize rewards up to the point of profit-taking.
If a chart pattern shows a left translation from the top, aiming for N waves, meaning two cycles’ worth of left translations, would be ideal to extend rewards.
Since the left translation forms the latter half with a longer rise, the pullback is the early wave.
Using this pattern, the risk-reward ratio can be secured at 5 or more, so even with a win rate of 30%, your capital can grow.
・Where will the top be?
To predict the top, you need to know whether the cycle is a Light Translation or a Left Translation.
Especially in an uptrend, Light Translation means the top comes in the latter half
In a downtrend, Left Translation means the top comes in the first half (the latter half declines)
This is the rule.
On a 4-hour chart, since a cycle spans 60–80 bars, focus on roughly the 30–40 bar midpoint.
In that case, it looks like this
Light Translation = the top comes after the 30–40 bar range
Left Translation = the top comes before the 30–40 bar range
Knowing this helps you anticipate whether the latter half will move down or move up.
・Many people feel cycle theory did not work in recent markets
For cycle traders, since 2023 some have felt that the cycle is“not functioning well?” and so on.
Even so, there were traders who kept winning.
The difference was that they softened the method of analysis within cycle theory a little.
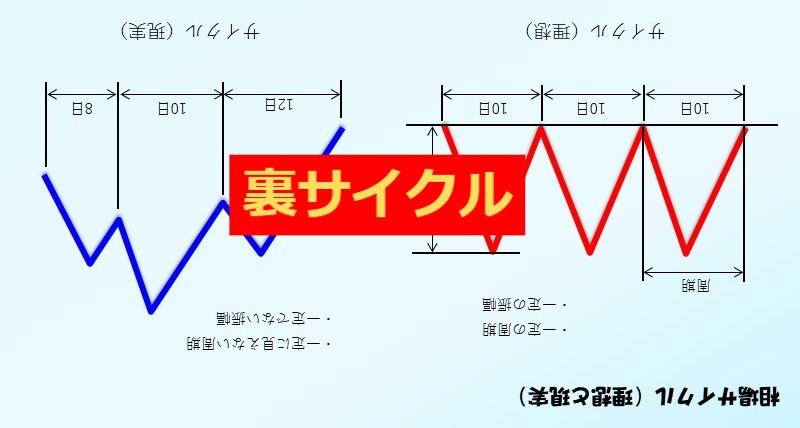
That method has many names, but is known as the “裏サイクル” (ura saikuru, back/hidden cycle).
There are various theories, but among cycle traders, Japanese are the majority, though a portion of overseas traders also use it; back cycles have become popular in the UK in recent years.
・What is ura cycle?
The ura cycle is simple: the normal cycle theory’s“Bottom → Top → Bottom”counts one cycle as“Top → Bottom → Top”counts as one cycle.
Literally counting the back side of the cycle.
Please flip the chart upside down on the screen.

In other words, this is what it means. (laughs)
Just kidding.
It’s difficult to explain, so I’ll provide an explanation.

The red line in the image above is the ura cycle.
To count Top → Bottom → Top, you must cross two normal cycles(the following is the normal cycle)Top to Top

Because ura cycle forms starting from the previous cycle’s top,
you can estimate the approximate number of bars to the top of the current normal cycle.
・In TradingView you can view the opposite currency pair

In TradingView’s currency pair inputtype “JPY”and you will get the opposite chart against the yen.
Recent market examples using ura cycle

With GBP/JPY, the above image shows a harp primary cycle entering,
First Major Cycle is about 59 bars?
Second Major Cycle is 35 bars
Third Major Cycle is 57 bars?
Fourth Major Cycle is 48 bars
(Possibly a new first Major Cycle)
The above is formed.
So how about ura cycle?

If you select “JPY/GBP” in TradingView, you will see an inverted chart.
Counting here yields
First Major Cycle = 43 bars
Second Major Cycle = 45 bars
Third Major Cycle = 45 bars
Fourth Major Cycle = 43 bars
All of the above fall within the Major Cycle ranges.
Moreover, this can apply not only to Major Cycles but also to Primary cycles and 4H cycles when counting ura cycles.
・Predicting price movement from ura cycle
The ura cycle has the same properties as the normal cycle, so translations are the same.
Therefore, by counting ura cycles, you can roughly predict the translation shape of the normal cycle.

Also, the ura cycle’sgreatest weaponexists in the normal cycle as well“If the starting point within one cycle is breached, it does not exceed the cycle’s high within that cycle.”which is a property of the normal cycle as well.
Therefore, if the starting point is breached in ura cycle, it means thehigh within the cycle (the starting point of the normal cycle) will not be exceeded.
From this, you can forecast cycle price movements to a reasonable extent.
However, irregularities, like with the normal cycle, must also be considered.
As noted at the beginning, considering that there is an 80% probability that movements stay within the cycle, combining ura cycles with other methods is highly effective.
We would be glad if you could refer to this article and reconsider.
Finally, FX Library offers indicators that can be used with cycle theory and ura cycle, so please give them a try.
▼▼▼▼▼▼▼▼▼▼▼▼▼▼▼▼▼▼▼▼▼
Indicators for cycle theory can be found here
▲▲▲▲▲▲▲▲▲▲▲▲▲▲▲▲▲▲▲▲▲
▼▼▼▼▼▼▼▼▼▼▼▼▼▼▼▼▼▼▼▼▼
If you trade with cycle theory, click here
▲