
Risk management of EA (Super Recovery) and how to operate Indicator Recovery entries, SL, TP, and trailing stop
There are two themes for today.
The first is that the number of users of the EA named Super Recovery has been increasing, so we’ve been receiving various questions and I recorded this video to share the gist with everyone.
If you’re watching the video, please click here.
In the first 15 minutes, I talked about risk management for parameter settings of Super Recovery.
In the latter 15 minutes, I explained the Recovery method of the indicator and the recent market context.

Regarding questions we’ve recently received about the EA, first from those who intend to purchase the EA.
“I want to see a 10-year backtest.”
That sort of request.
The figure below shows the 10-year backtest results using Super Recovery.
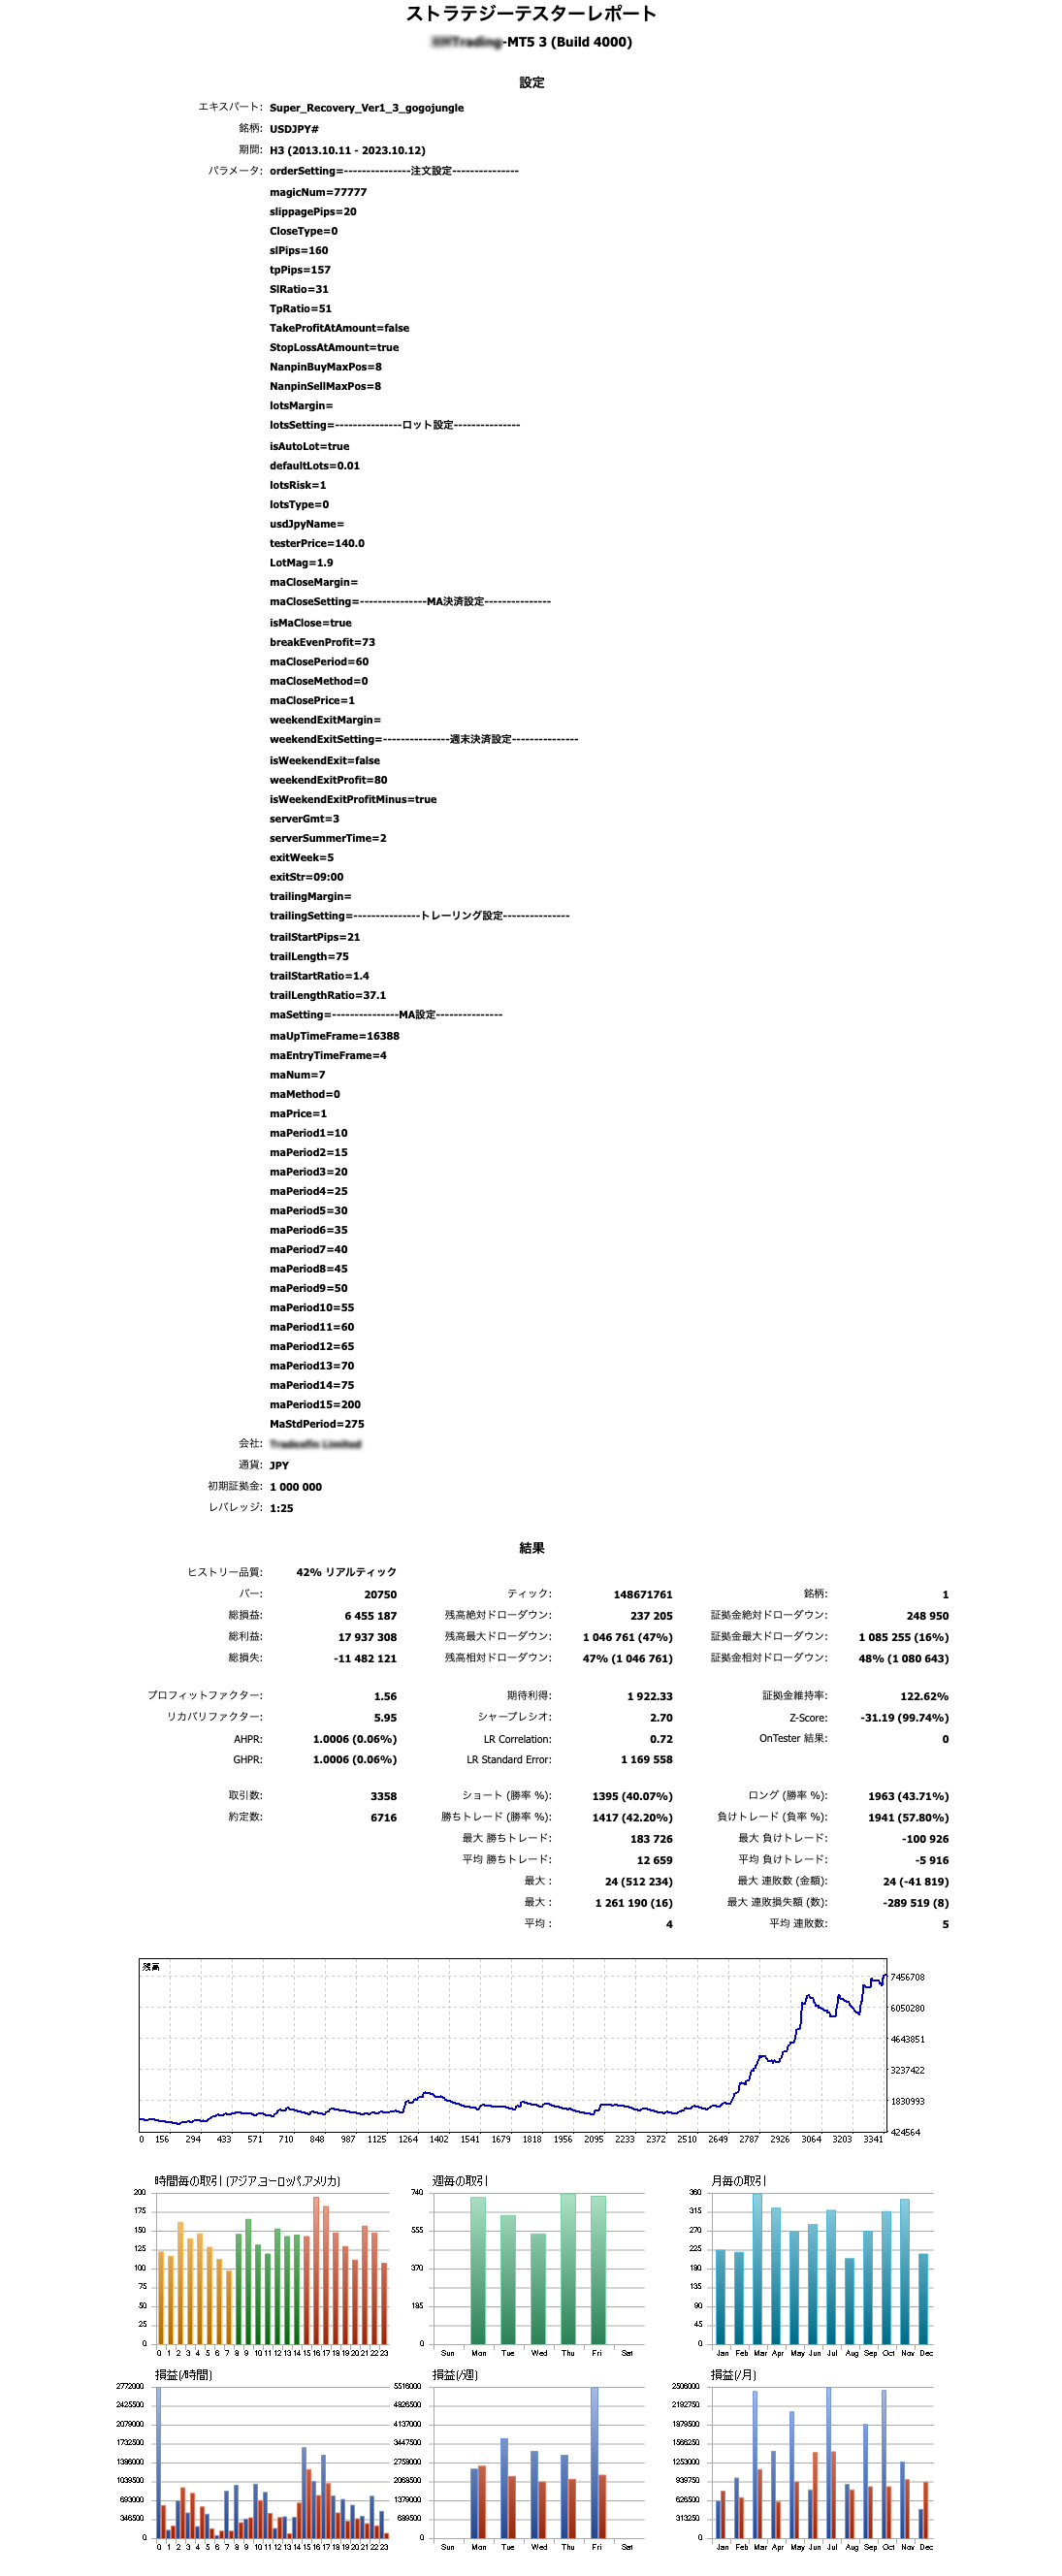
As shown above, the results show that the early to middle period barely manages to hold without breaking down.
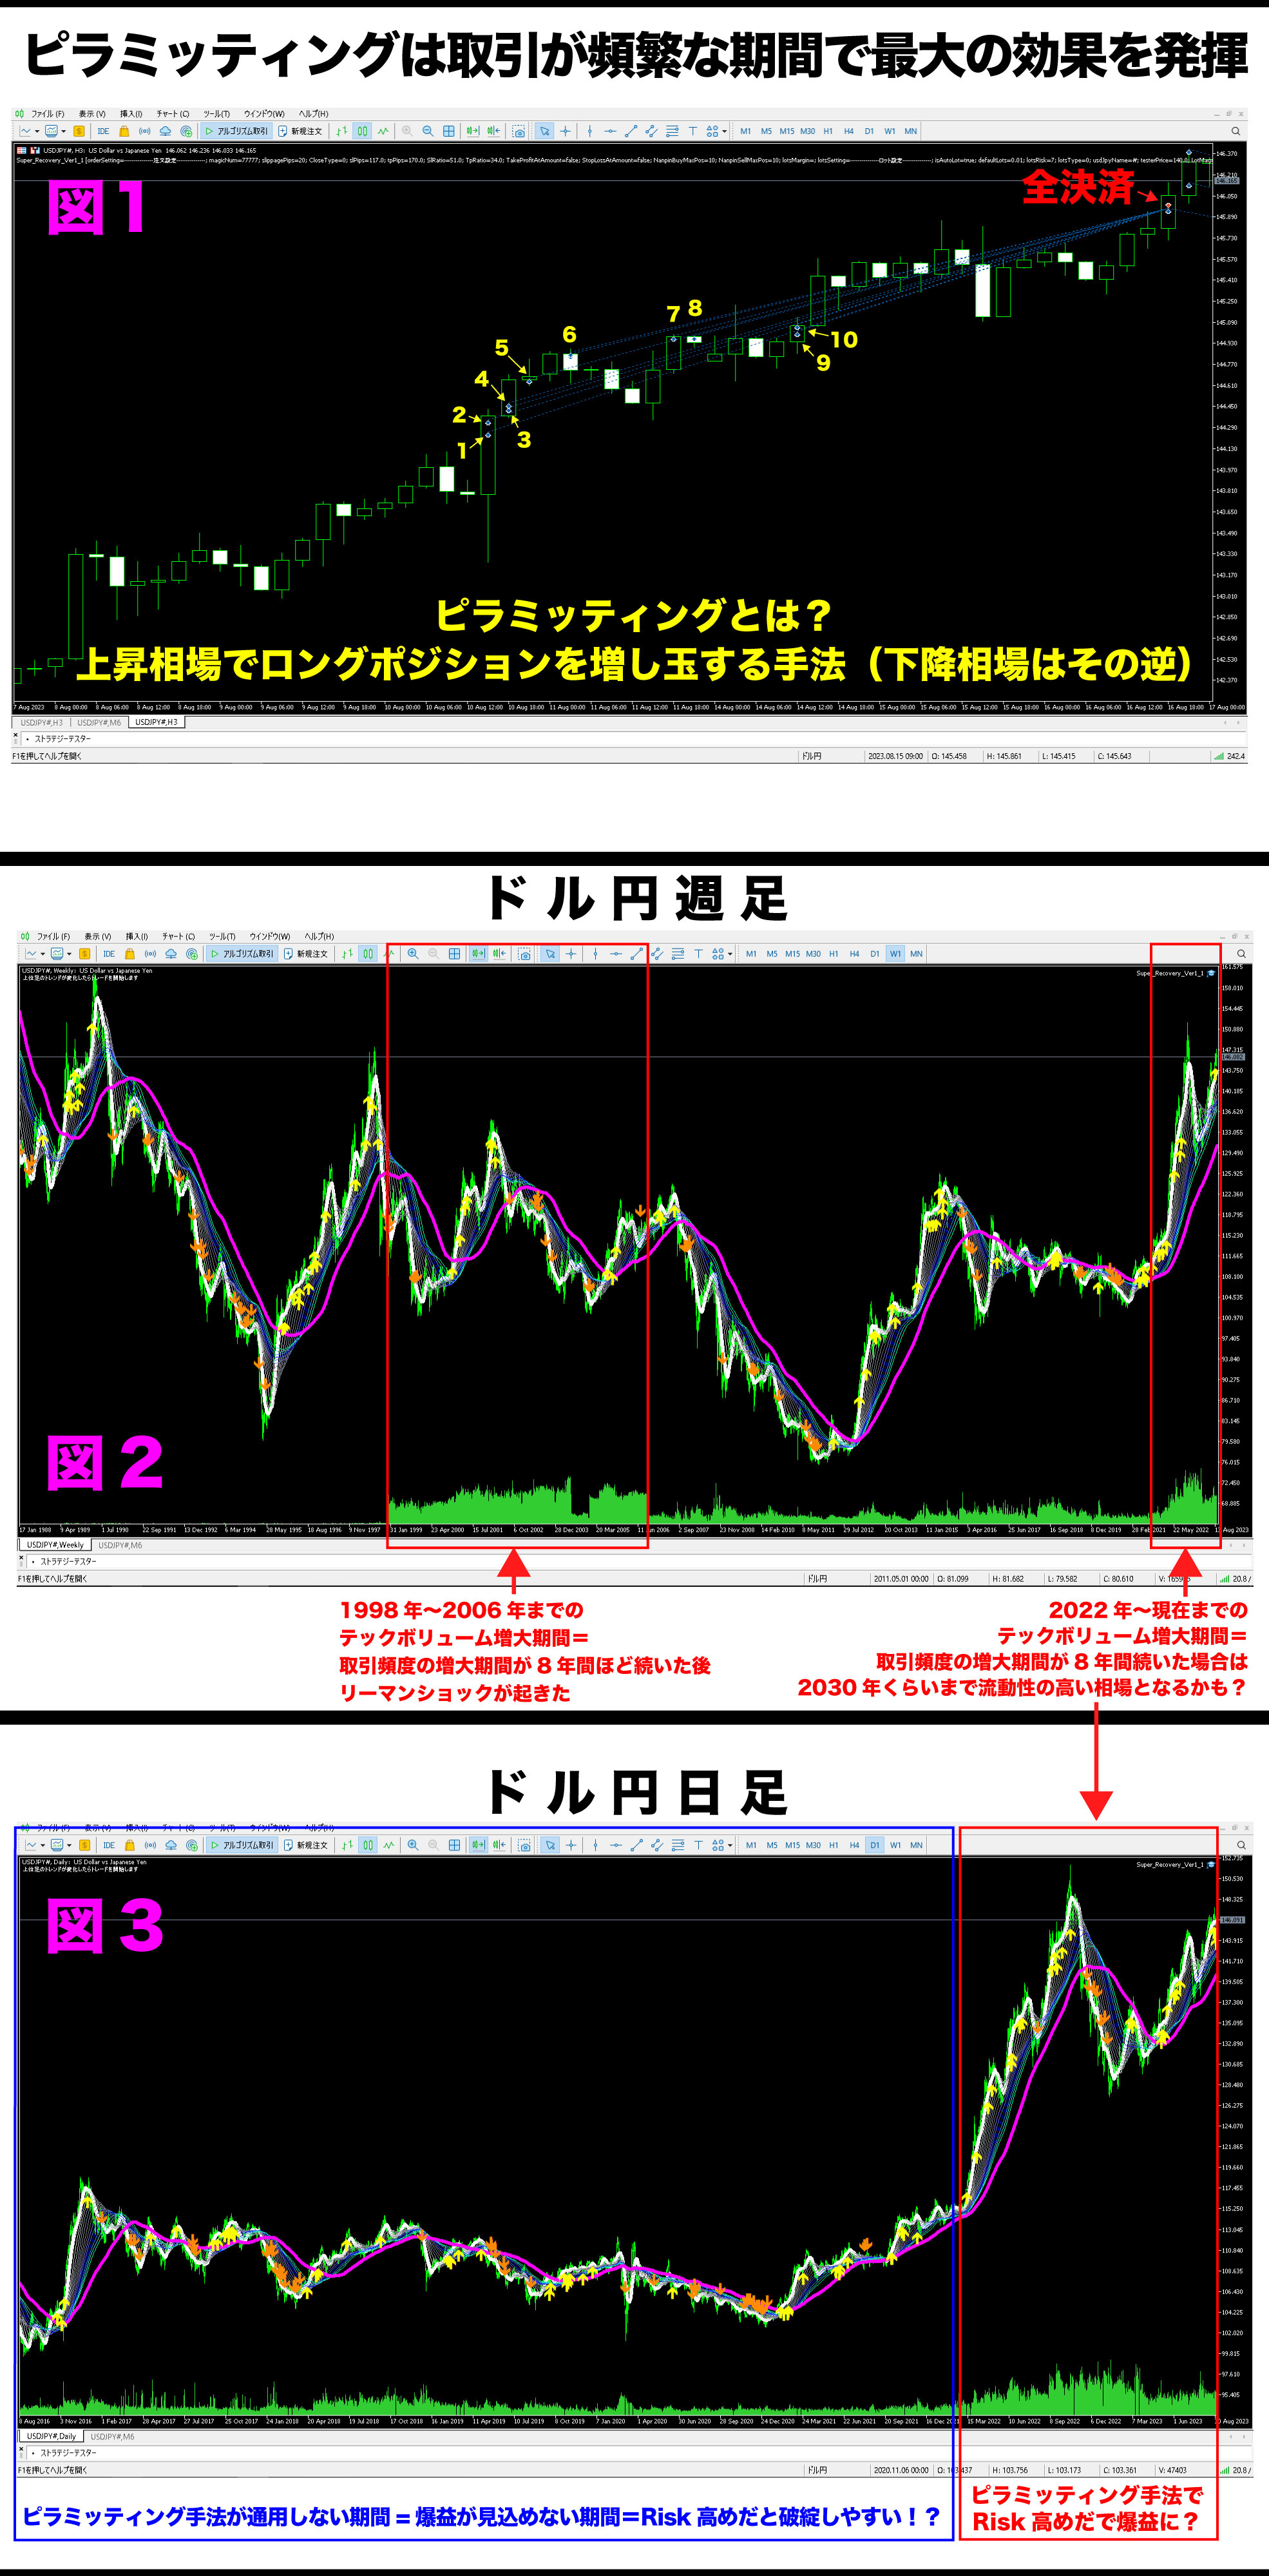
In low-volatility market conditions, the downside of pyramiding is that profits do not grow easily.
Profits are increased in the latter part, but the overall performance over 10 years ended at 600%.
The above shows a backtest from October 11, 2013 to October 12, 2023, starting with an initial margin of 1,000,000 yen, leverage 25x, and Risk 1.0%.
I’ve also written articles about tech volume and pyramiding since 2022, noting that contrarian strategies can be profitable when volatility is low.
This is a grid logic that adds positions as the market moves against expectations and the unrealized loss increases.
https://www.gogojungle.co.jp/finance/navi/articles/59551
As discussed in past articles, the greatest characteristic of Super Recovery lies in pyramiding.
This is a method that only works on biased trends.
Whereas reversed-position averaging and martingale, such as with grids, tend to have deep stop losses, Super Recovery is somewhere in the middle—neither too deep nor too shallow—at around 117 pips.
And the most distinctive feature is that it can acquire up to 12 positions in pyramiding.
When the market moves in the opposite direction of expectations, the logic includes averaging down and martingale, but often the conditions are not met, so you frequently see a small number of positions hit SL.
Conversely, when the market moves as expected and there are unrealized gains, it often holds up to 12 positions.
This results in a favorable win-to-loss ratio.
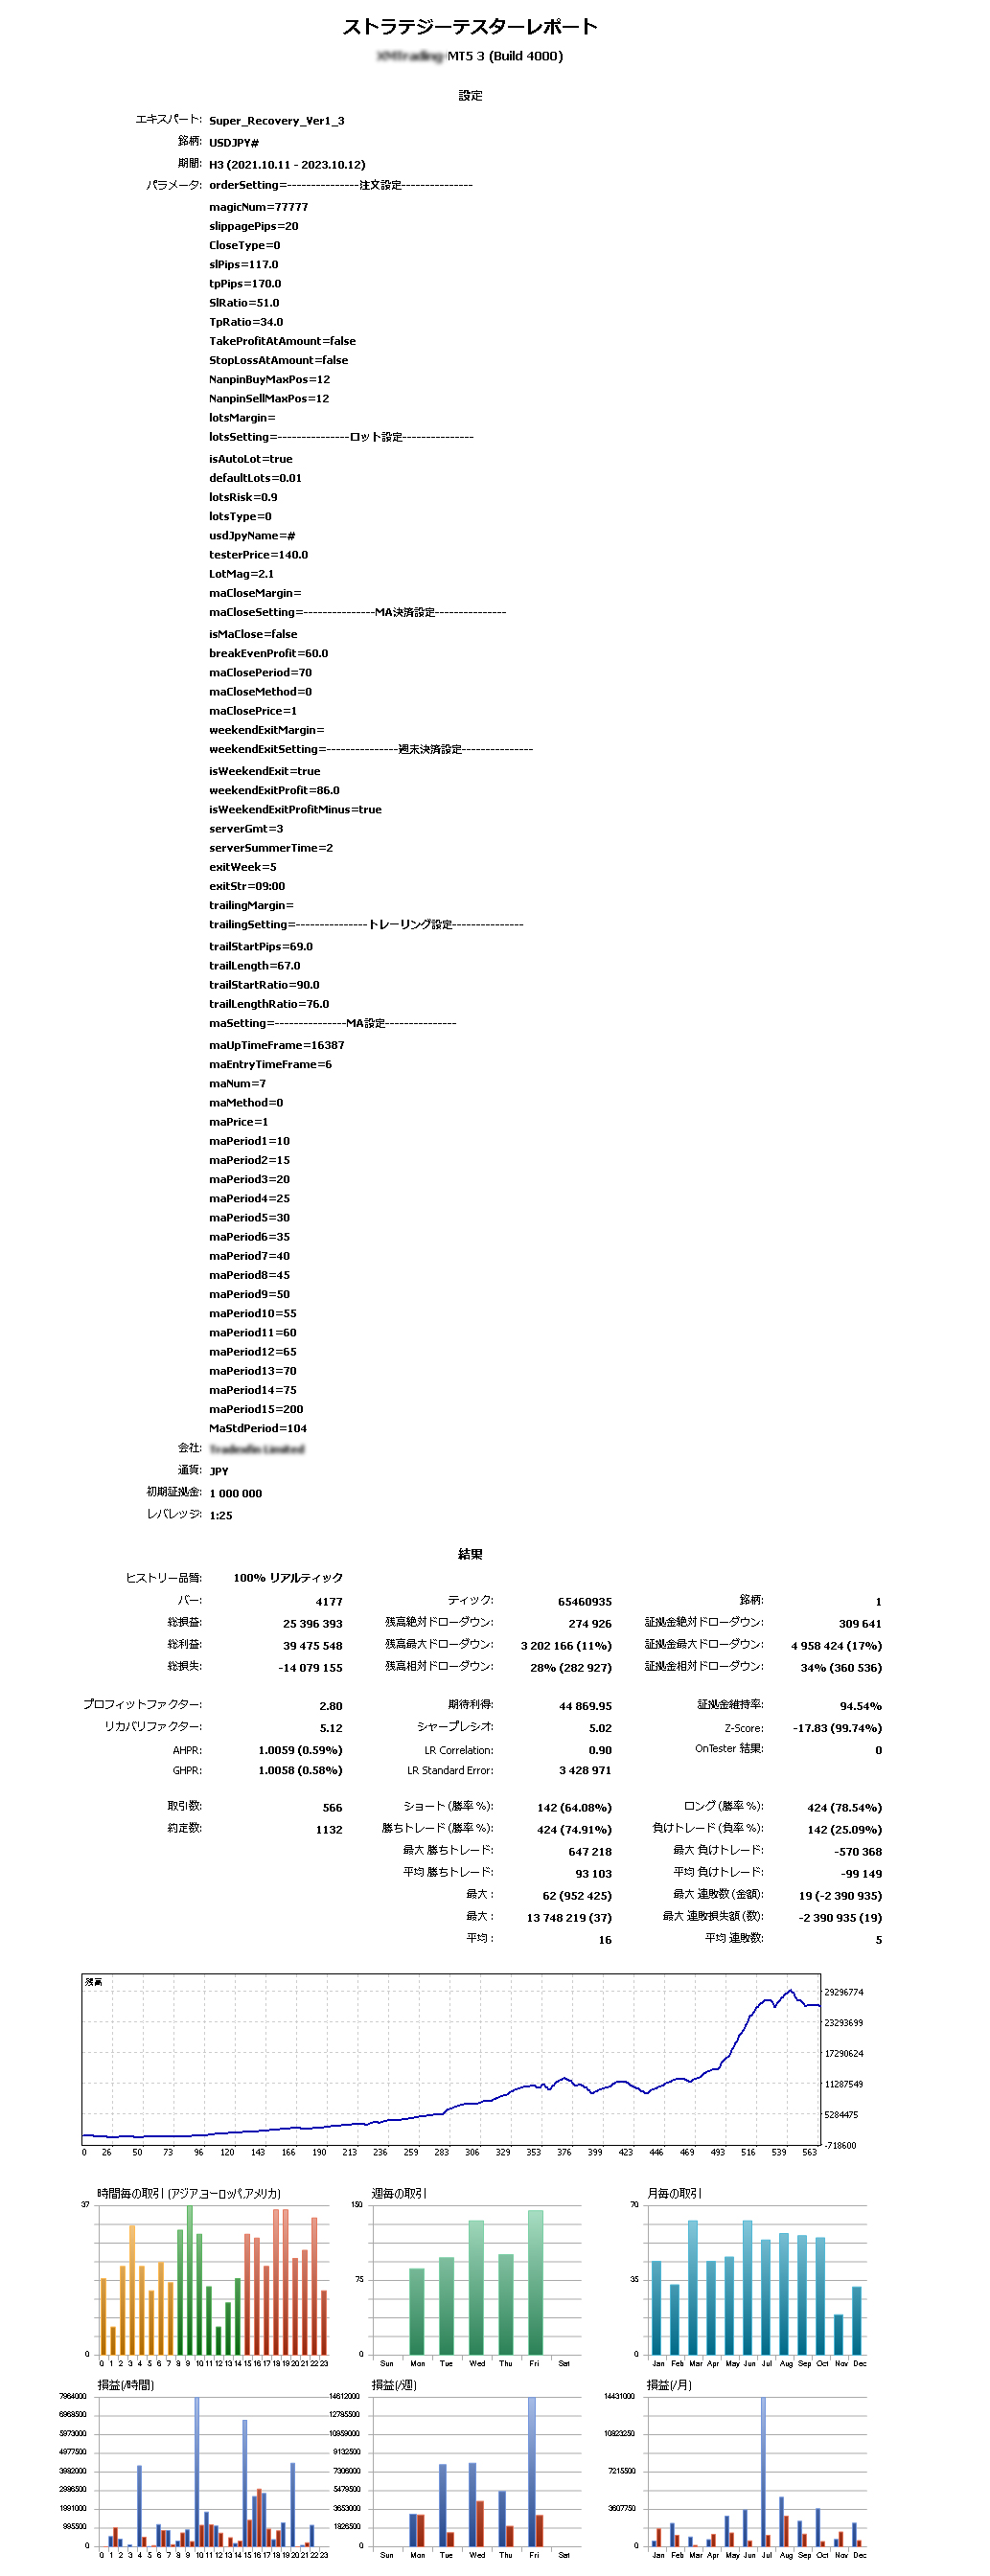
On the other hand, from October 11, 2021 to October 12, 2023, a backtest was run with initial margin 1,000,000 yen, leverage 25x, and Risk 0.9%.
In other words, this is a parameter setting aimed at short-term explode gains, completely different from the previous 10-year test.
The result exceeded 25,000,000 yen in two years.
6x over 10 years (a parameter set planned for distribution to low-risk seekers in the future).
25x in two years (the current default setting of Super Recovery for sale).
6,000,000 yen profit in two years (a parameter set calculated to avoid account collapse over a long period).
25,000,000 yen profit in two years (the current default parameter setting for Super Recovery).
Which setting would you like to run?
Using the optimized test result that was calculated with the objective of preventing account collapse over 10 years, the recent two-year results were like this.
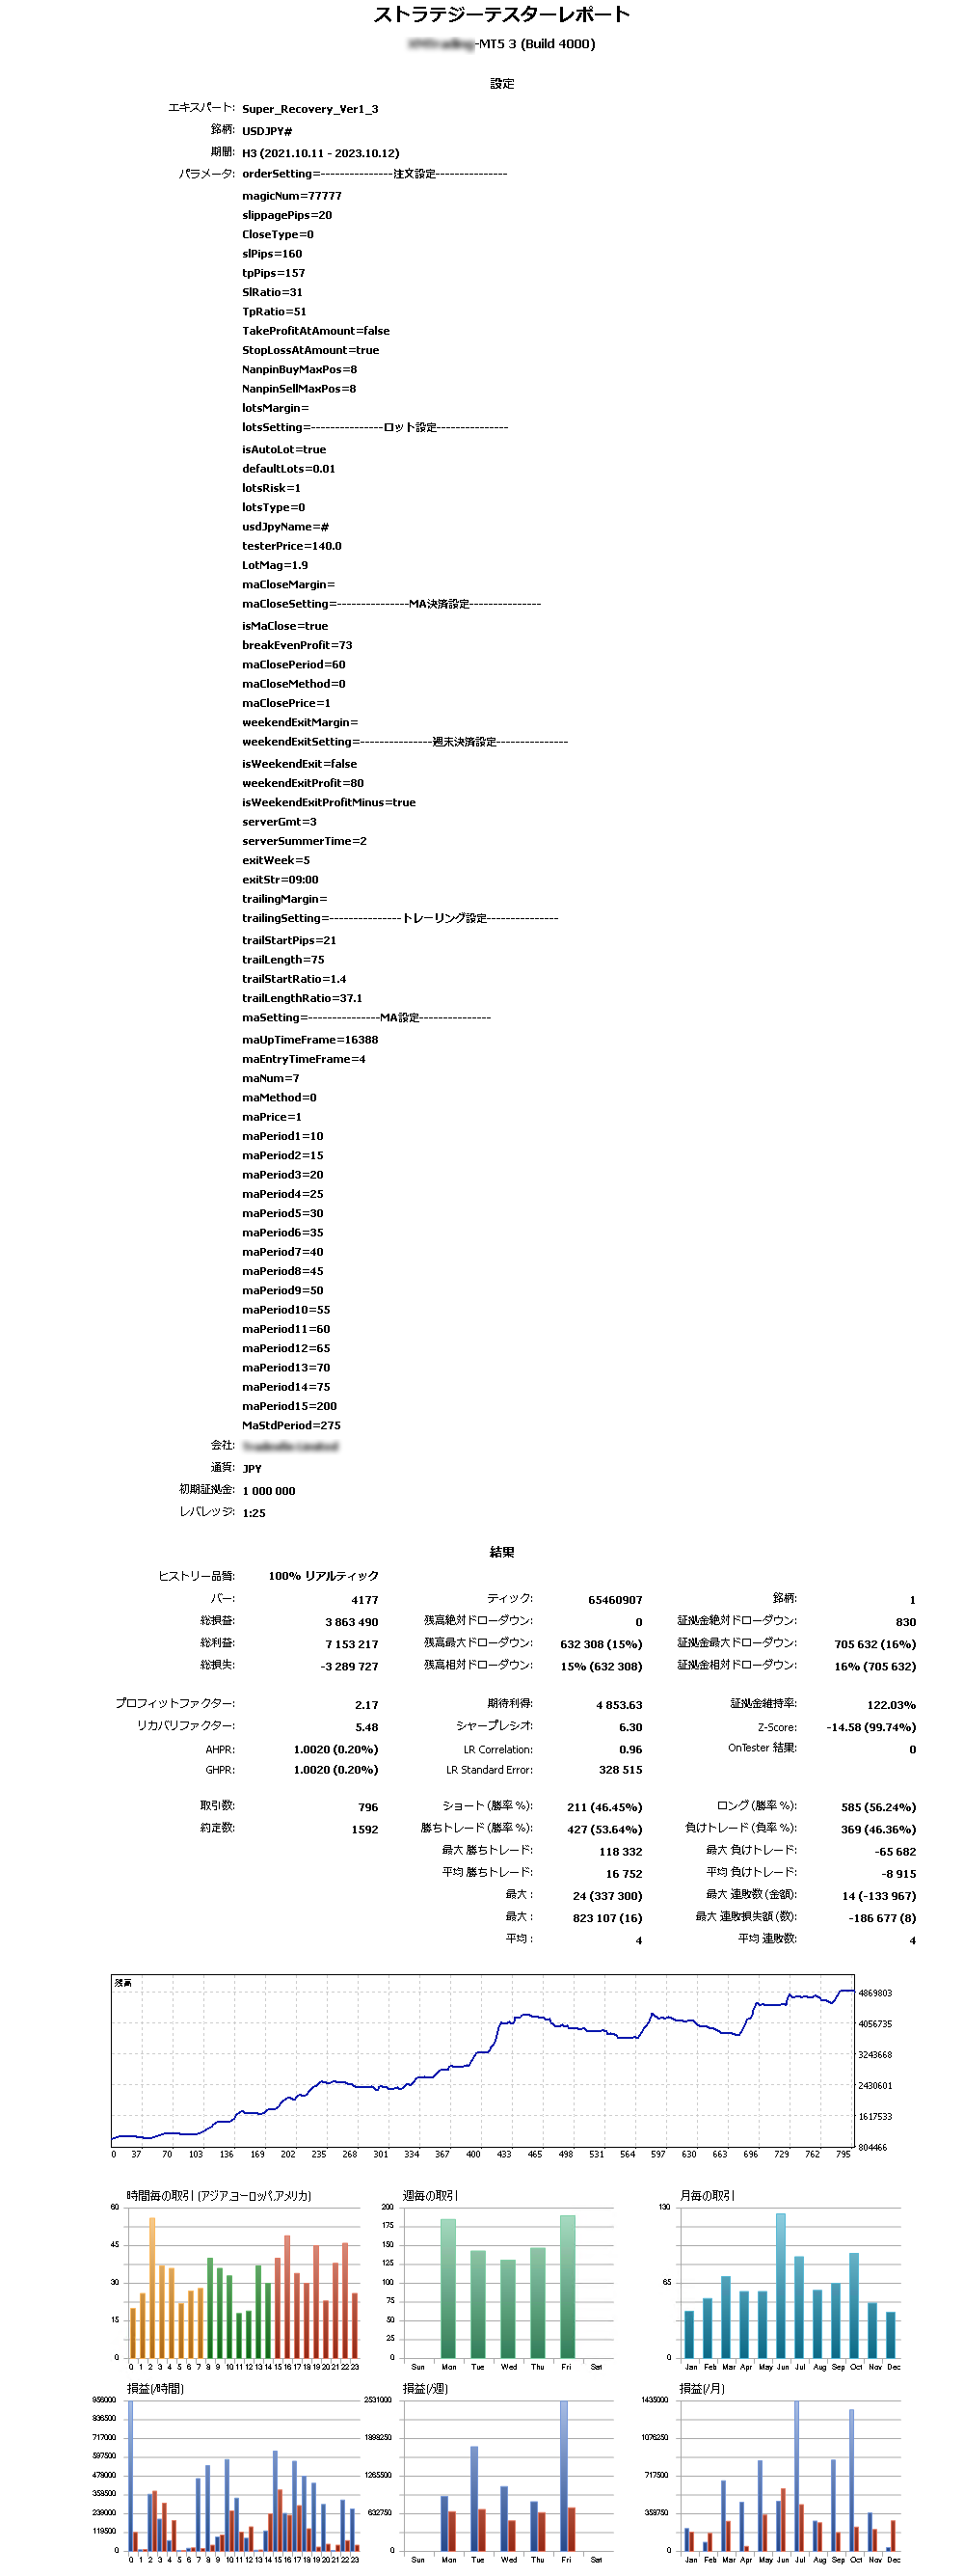
The figure below shows the two-year test using the long-term parameter setting introduced at the start.
From October 11, 2021 to October 12, 2023, with 1,000,000 yen funds, leverage 25x, and Risk 1% over two years.
The result: 3.8x, increasing 1,000,000 yen to 3,800,000 yen.
Two years, 380%—not bad, but what do you think?
From now on, we will refer to parameter settings suited for long-term operation as the 'low-risk setting'.
If you’re an Super Recovery purchaser and want it, please send a private email.
Write “Requesting low-risk set file.”
However, I wonder whether a 10-year backtest showing no account collapse will be applicable in the near future.
The recent yen depreciation has made liquidity very high, and tick volume has surged since around 2022.
Given that the market conditions clearly differ before and after 2021, might the near-future profits be better aligned with the two-year results?
Such questions keep arising.
If the risk is low, but profits are smaller, perhaps it’s because the two-year result is only about triple; is that acceptable?
If you’re going to take on risk anyway, wouldn’t it be better to use a high-risk parameter that only works in the last two years and yields 25x?
I have decided to propose Super Recovery to everyone with this in mind.
The low-risk set file also has a lower winning rate.
Reducing risk tends to result in deeper stop losses and shallower take profits.
Low-risk SL is 160 pips: high-risk SL is 117 pips
Low-risk TP is 157 pips: high-risk TP is 170 pips
At first glance, it seems inconsistent that high-risk, which aims for larger profits, also has smaller stop losses, but other settings such as trailing stops and MA exits differ greatly.
Also, the maximum number of positions is eight for low-risk and twelve for high-risk, so indeed low-risk carries lower risk.
Even with many averaging-down or single-position strategies, shallow take profits do not yield huge returns.
Strategies that incur large losses yet make large gains tend to rise and fall with an upward trend.
Also in the video, we discuss the special connectors at the end of each instrument name.
In some companies, when the pair currency ends with a special connector like “#” such as USBJPY#, you must enter “#” in the parameter settings.
If you do not enter the special connector, the EA will not start trading.
Please look at the figure below.
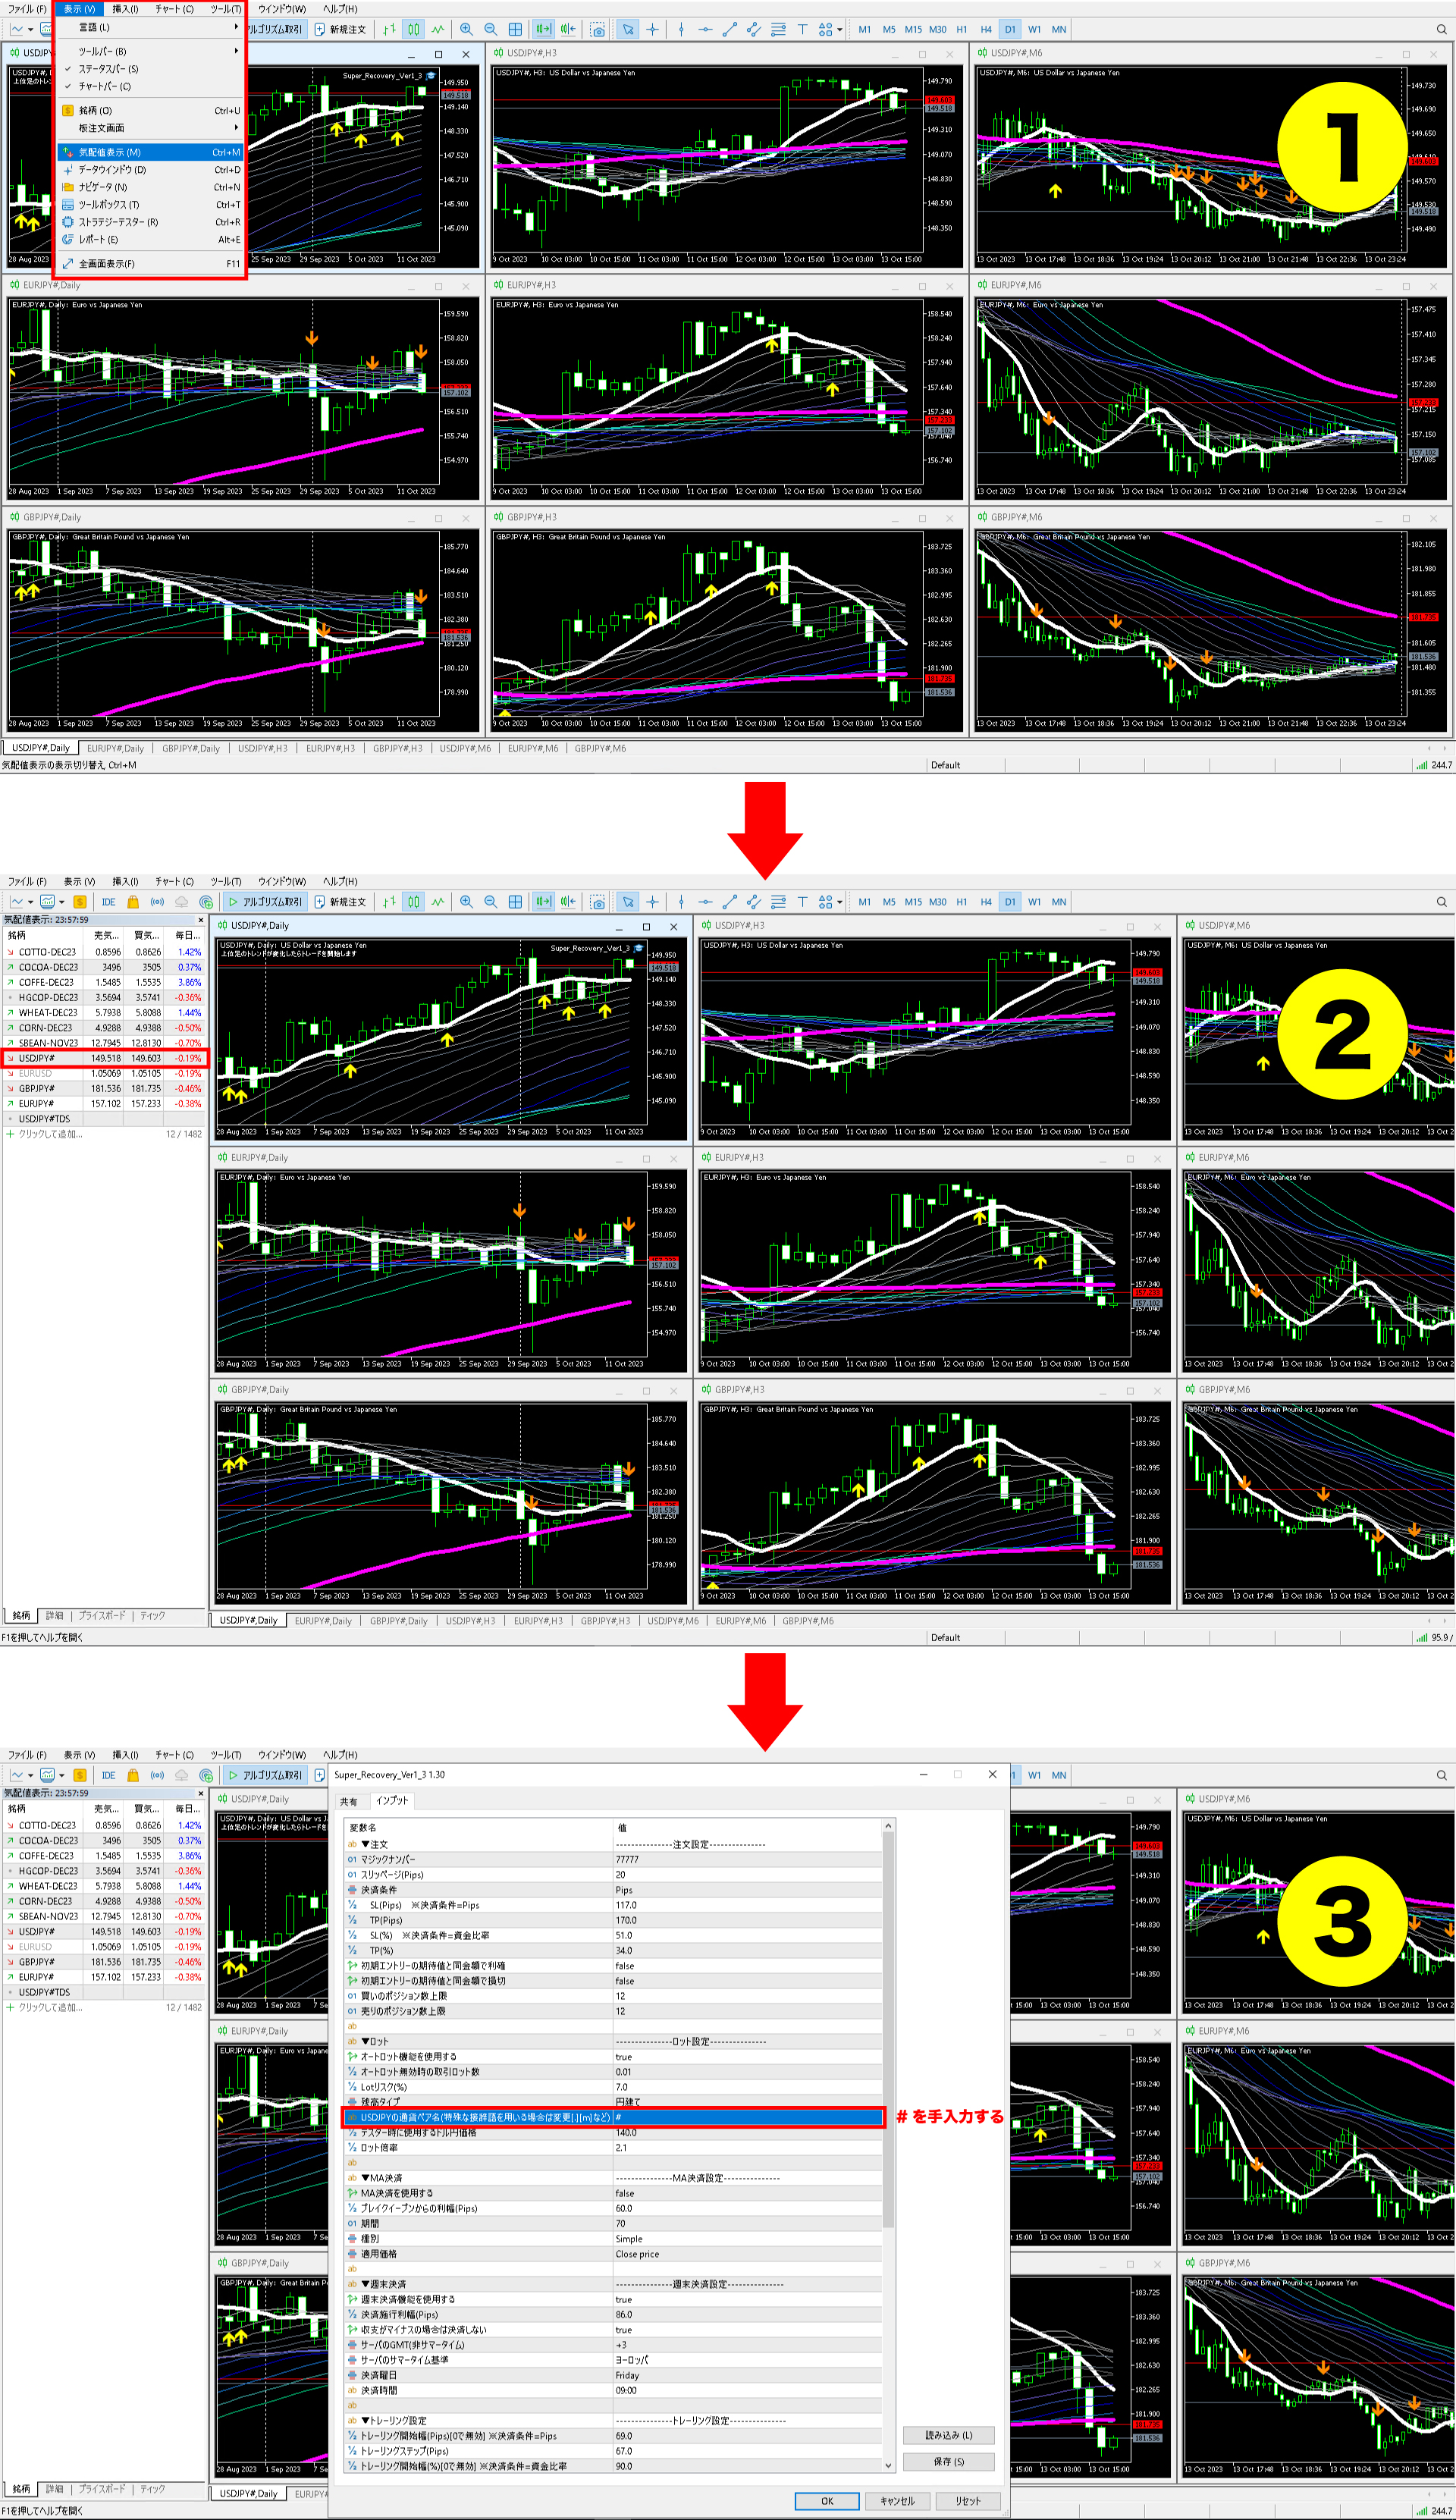
As shown above, some brokers do not append anything at the end, but occasionally there are special characters attached to the instrument name.
My broker includes “#”, so I enter “#” in the appropriate field of the EA parameters.
Super Recovery users should check their broker’s instrument names, and if there is nothing at the end, the default is fine.
Generally, in Japan, OANDA Securities and FX Primex performed well in backtests, but AVA and Phillip did not perform as well.
The final section of the EA explanations concerns the time frame.
Super Recovery defines the trend on a 3-hour chart and enters on a 6-minute chart, but you do not need to display both 3-hour and 6-minute charts on the actual chart.
For example, a USD/JPY chart can operate correctly on any time frame, whether daily or 1-minute.
Please look at the figure below.
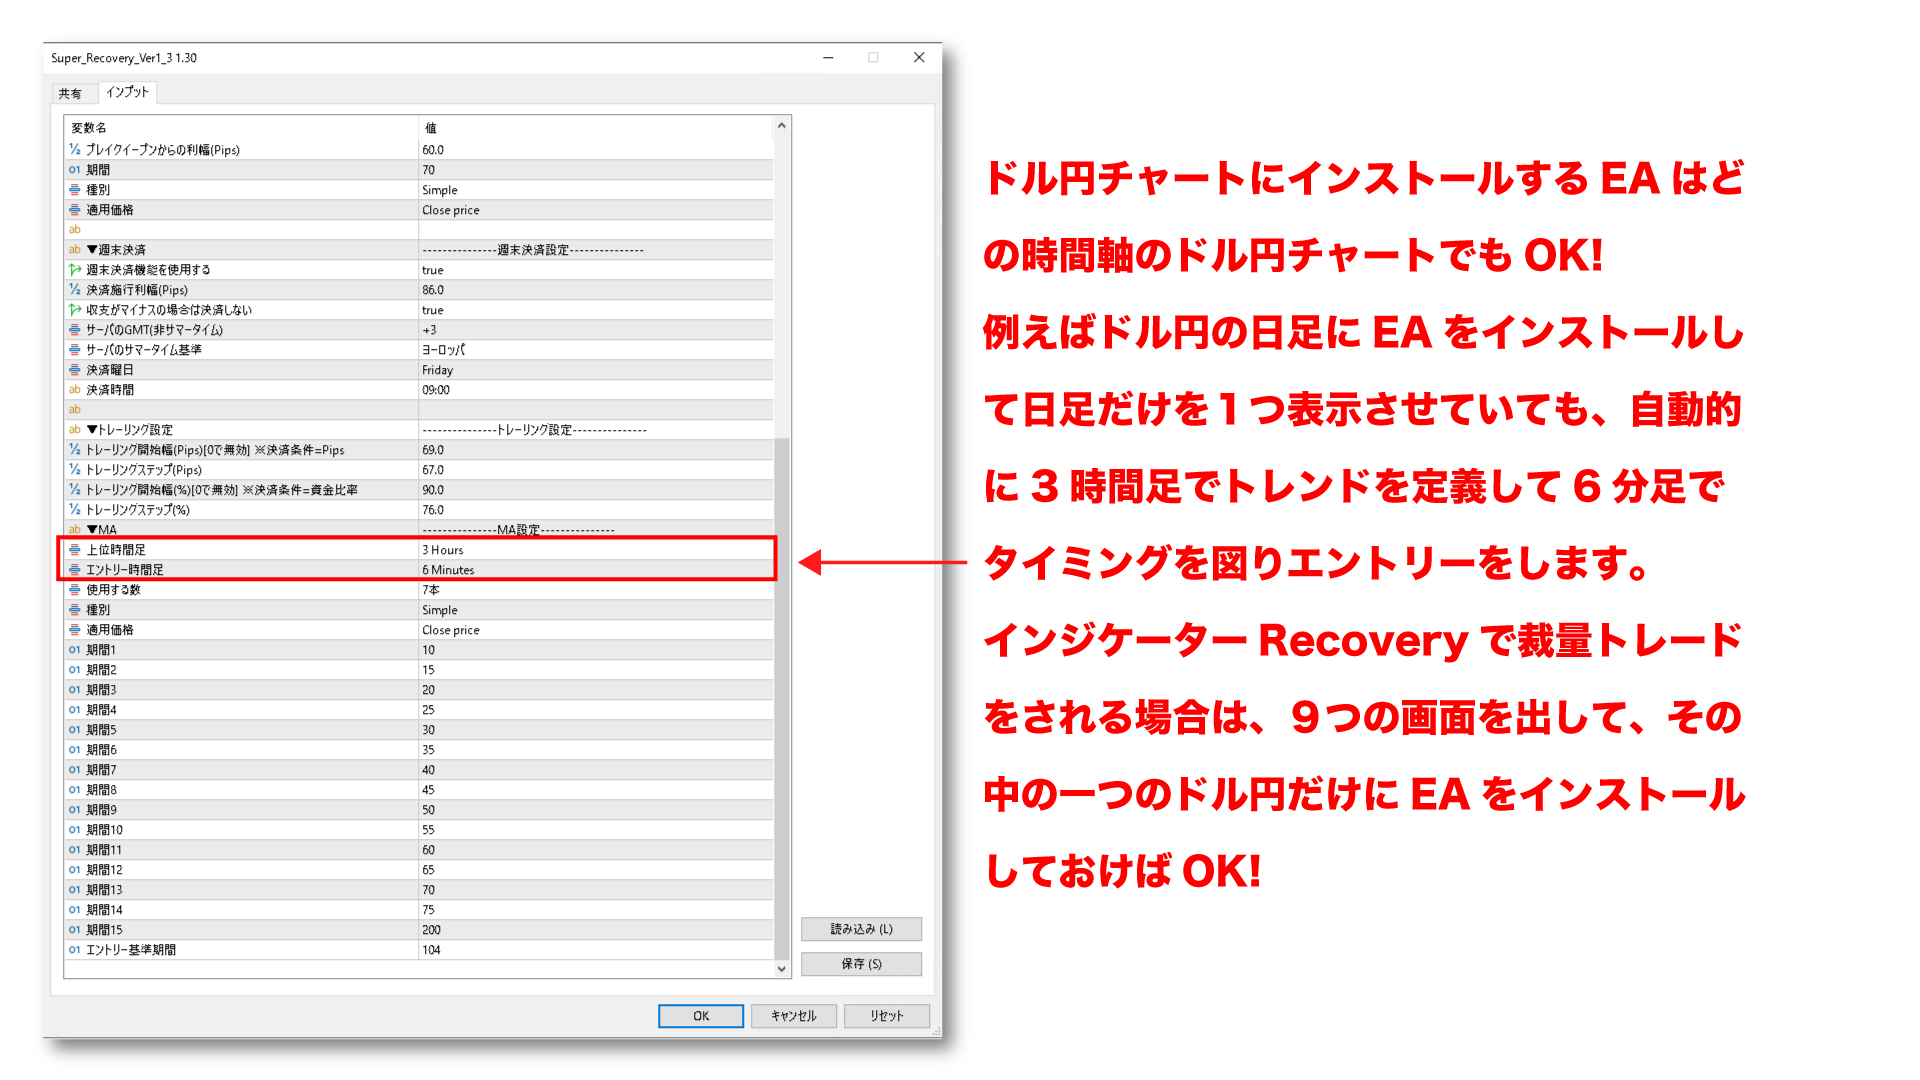
As shown above, the time frame that defines the trend and the time frame used as the basis for entries are both set by parameters.
So on a USD/JPY chart, just install one EA on one USD/JPY chart, and it will automatically enter and exit using the 3-hour and 6-minute charts.
Please note that if you install two EAs on both the 3-hour and the 6-minute charts, you may end up with double the lot size, so use a single USD/JPY chart per account, and install only one EA.
In the latter part of the video, we discussed discretionary trading.
This is a technique explanation video for those using the Recovery indicator and those considering a future purchase.
Of late, the most notable event is Japan’s currency intervention.
The Japanese Ministry of Finance has offered no comment on intervention, but the act of not commenting itself suggests intervention, which raises suspicion.
It is hardly normal that immediately after surpassing the round figure of 150 yen by several pips, there was a drop of 300 pips.
And I discussed in the video how the decision criteria for discretionary traders have become highly opaque.
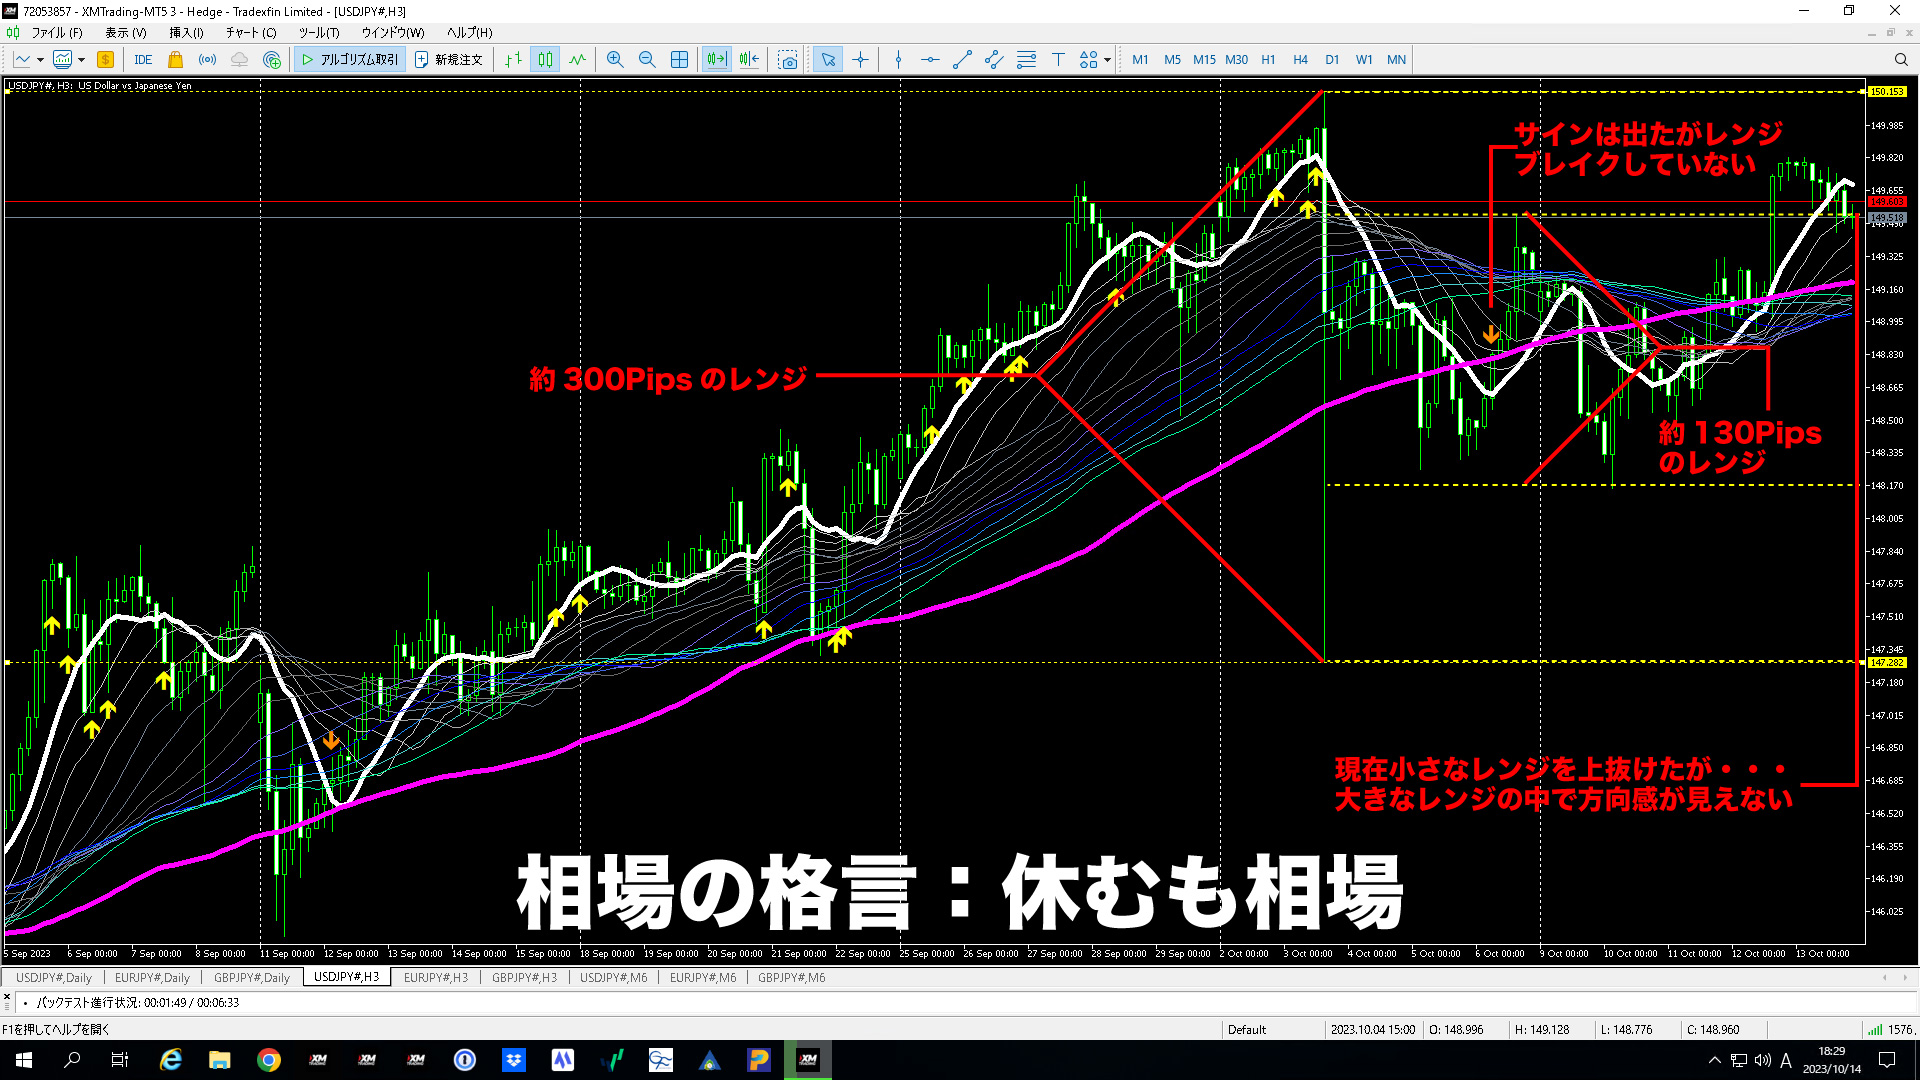
In such a wide-ranging range market, EAs also pause, but discretionary trading is prone to being stopped out, so please be careful.
There must be no rush in the market.
Please watch the video for details.
This has become quite long, so I’ll end here for today.
Have a good weekend!