

Free公開 Trade style Japanese stock trading methods daily trend technical 【Japanese stock trading secret】
How to Find Free Public Entry Points
The Basics of Stock Trading Are Here
Here Are Paid-Grade Trading Techniques
How to Target Rapid Gains with Obscure Stocks in the Shiller Stock Category
Delivering Techniques, Market Conditions, and Fundamentals
A newsletter that will surely be helpful.
Japan Stock Trading Essentials
Technical Analysis
I was invited by Gogojan to contribute after several years, and I am writing an article once again.
We will introduce a day-trend trading style using Japanese stock trading methods.
What differs greatly between stock trading and FX is the screening of stocks, the selection process.
Here, to convey mainstream, non-nerdy trading methods, we present examples of selection methods as follows.
✅ Trade mainly with physical stocks only, do not use margin trading
✅ But to be safe, do not buy stocks likely to be subject to short selling restrictions
✅ Stocks in sectors that are expected in the news
✅ Stocks with good performance based on quarterly reports
✅ Stocks with high volume and strong liquidity
✅ Stocks with dividends or incentives that make holding them less risky
✅ Stocks with volatility when viewed on long-term weekly and daily charts
✅ Trends appearing on weekly or daily charts
✅ Entering gradually and diversifying positions over time for capital management
Stock charts and FX charts are read in almost the same way, but
start by selecting stocks with high trading volume and ample liquidity
A major difference between stocks and FX is that some stocks have low volume
Stocks that attract little attention can move slowly or leap in price
For large-cap stocks or popular stocks, the higher the crowd,
the more clearly chart patterns reflecting investor psychology tend to appear
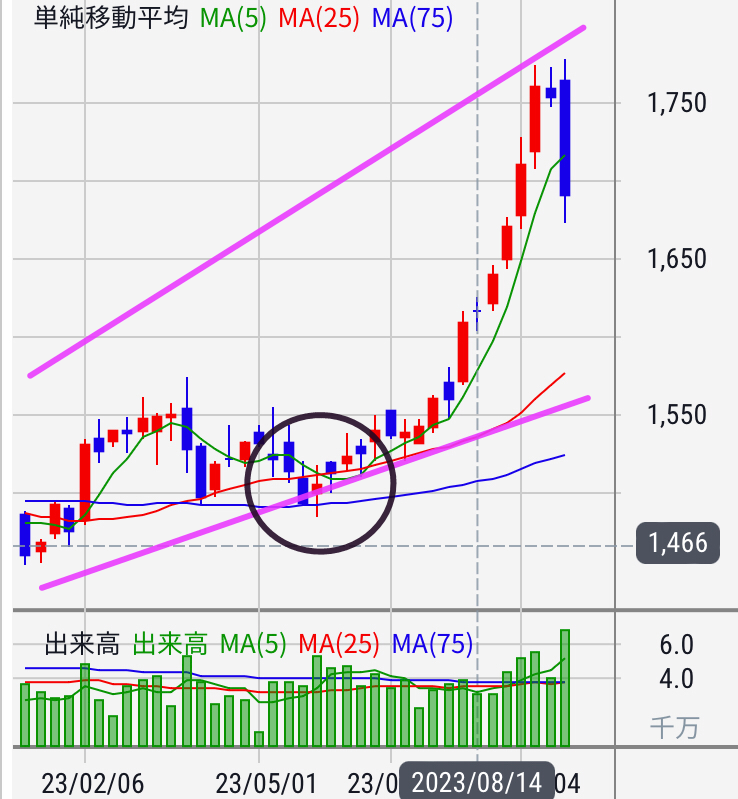
First, we will explain the basis for weekly entry.
Open the chart screen and select weekly.
If a linear trend is visible, the long-term rise is continuing.
This chart shows an ideal shape.
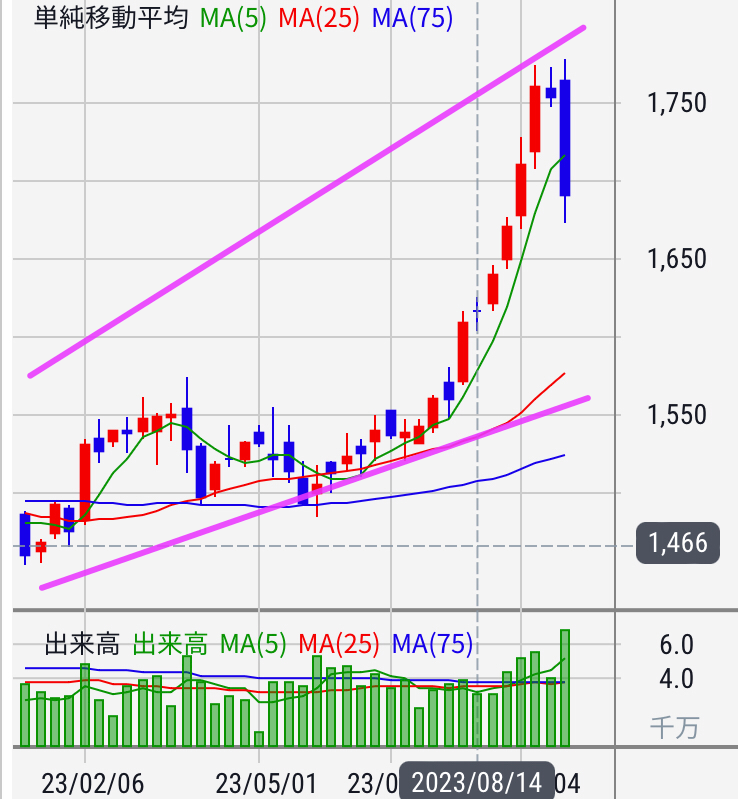
The moving averages are crossing.
The 5-day moving average is declining, but
the 25-day moving average is slowly rising
and those lines are crossing.
Next, we will explain how to view the daily chart.
To illustrate clearly, we will use a chart from another date of a certain stock.
First, draw a horizontal line at the clearly paused or reversed level
where the line clearly rebounds.
Where to draw the line is a question, but please draw it in the zone where it clearly rebounds.
This is a support and resistance line.
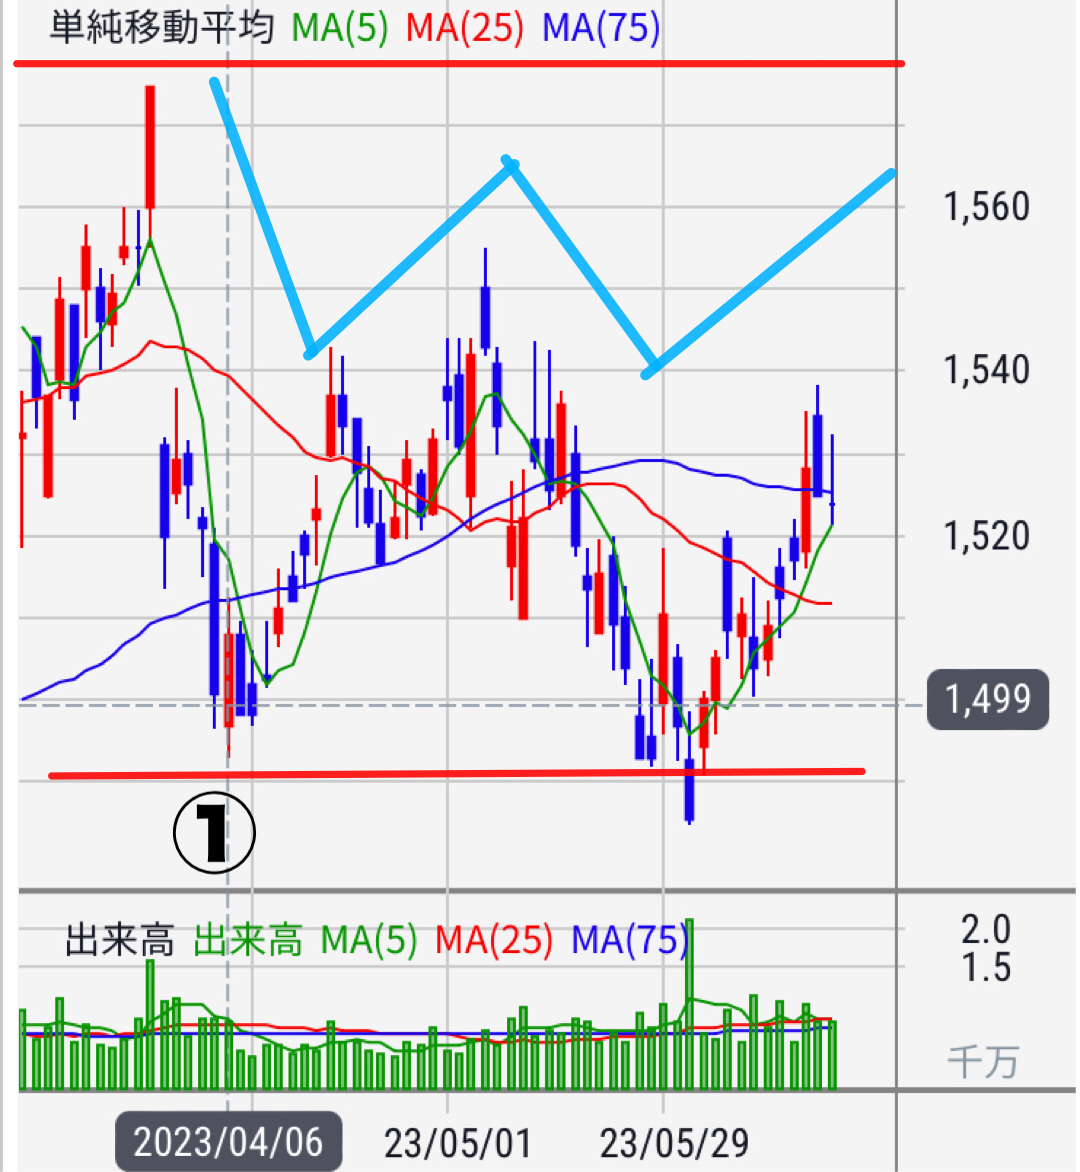
Entry occurs at point ① where it stops dropping and starts rising again. Many will enter here, but we will provide a more substantiated method here.
The chart shows a double-bottom pattern.
Although a bottom line could not be drawn at the double bottom, a clean W shape appears on the chart.
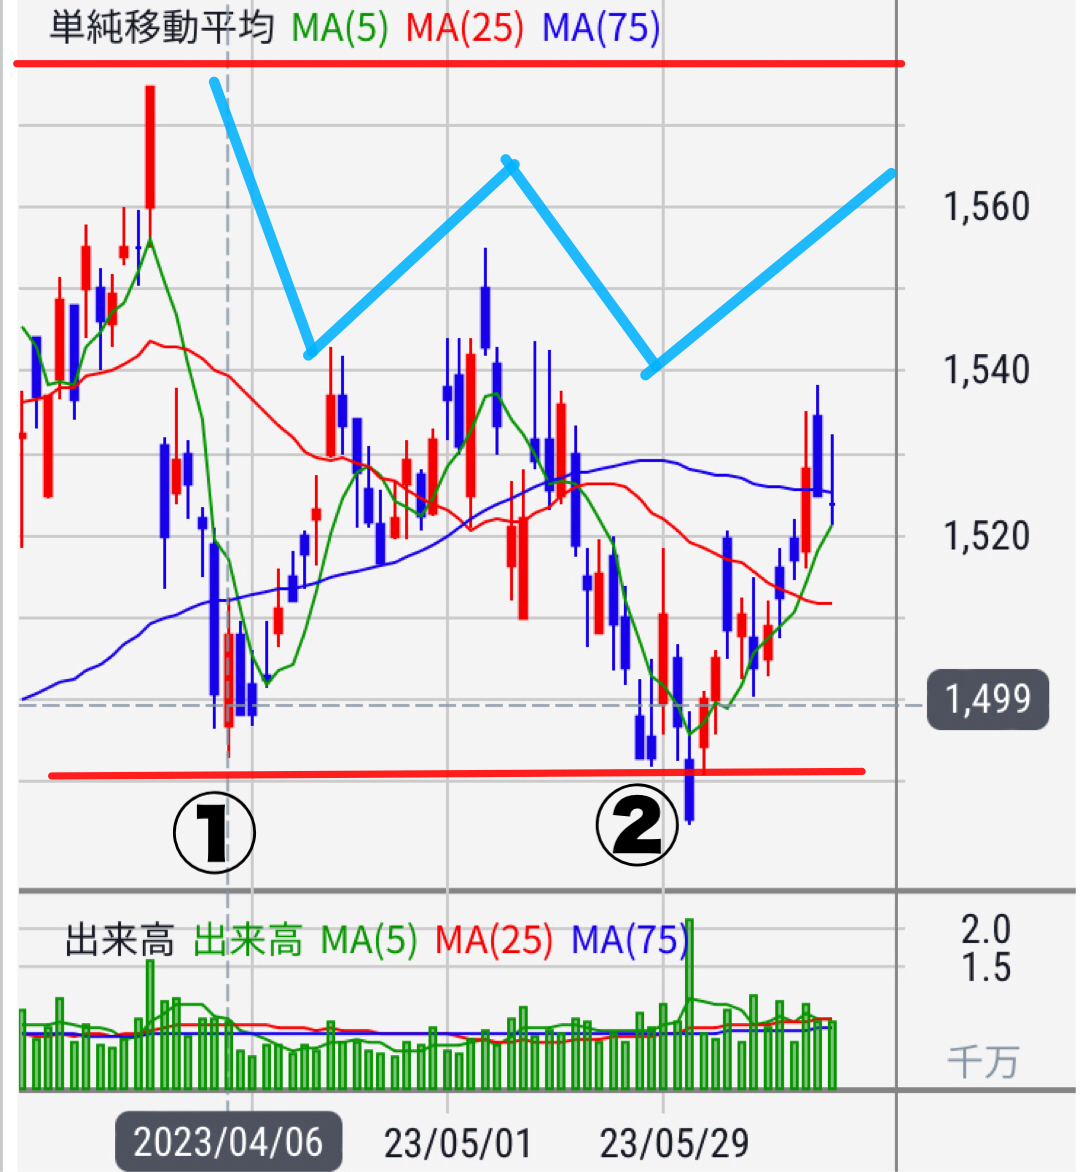
Entry will be at point ②.
This is from a large-cap stock on 2023-05-29.
It just hit a bottom and rebounded,
nearing the support line.
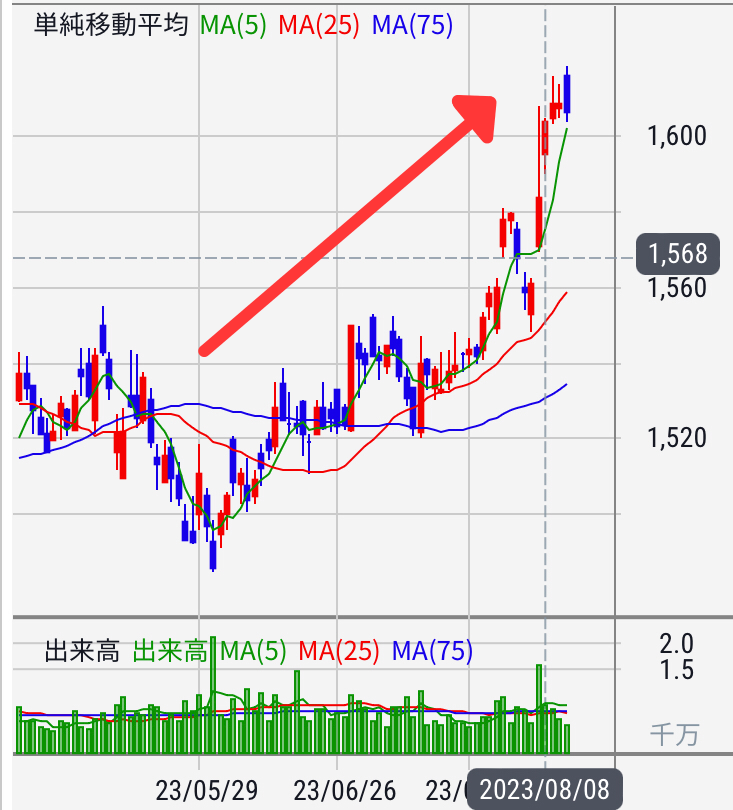
Afterwards, as the stock rebounded and consolidated,
it slowly rose leading up to around the Obon holiday.
As for exit points for profit taking,
in stocks, there are dividends or people accumulate and hold,
so it depends on personal risk management and comfort level to hold.
In mid-term swing trading, as long as the chart shows rebounds there are multiple entry points,
so it largely depends on individual judgment.
For both stocks and FX, if you monitor the market and day trade,
a little price movement can delight in scalping profit realization,
and the brain tends to remember the thrill, similar to gambling.
If that happens, you may start to wait for favorable entry points less and end up making new trades,
which is a gambling addiction rather than investment—please be careful.
Entering points blindly or stock hunting can lead to
a state called posi-positivity (posi-positiveness) where you cannot help but take positions
and end up repeatedly cutting losses; caution is required.
Even in day trading, to stabilize trades you should
not be greedy about entry dates,
and only enter on days with high volume and strong liquidity
with favorable market conditions
and in the morning, on days when weekly and daily charts show advantage,
such double-bottom lines and candlestick buy/sell signals can be easier to find.
Basically, repeat this method and
look at the long-term daily chart to confirm the trend, then search for entry points.
There are other points to consider when selecting stocks and things to beware of as well.
In stocks, there are many methods depending on the specific characteristics of the stock, such as thinly traded stocks; among the most popular is the entry basis we have introduced.
Stock trading methods vary with stock type and market conditions.
In addition, the newsletter also includes market analyses, perspectives on news and world events, warnings about dubious investment methods, and how to read charts.